
This February 2, 10,000 Bitcoin (BTC) that was previously stolen from Bitfinex was finally moved. In this article, BeInCrypto will examine the consequences of this movement on several on-chain indicators.
The Bitcoin CDD Indicator
The first indicator that is significantly affected by this movement is the number of days of parts destroyed (CDD). This is a lifespan indicator that accumulates one day of coin for every day a BTC is not spent. Once it is spent, all these accumulated days are therefore destroyed.
On February 2, 195,057,413 day pieces were destroyed. Knowing that the sale amounted to a total of 10,000 BTC, each of them would have had to accumulate 1,950 days of coins to arrive at this figure.
This corresponds to the fact that these BTC had not yet moved since 2016.
Bitcoin long-term holders
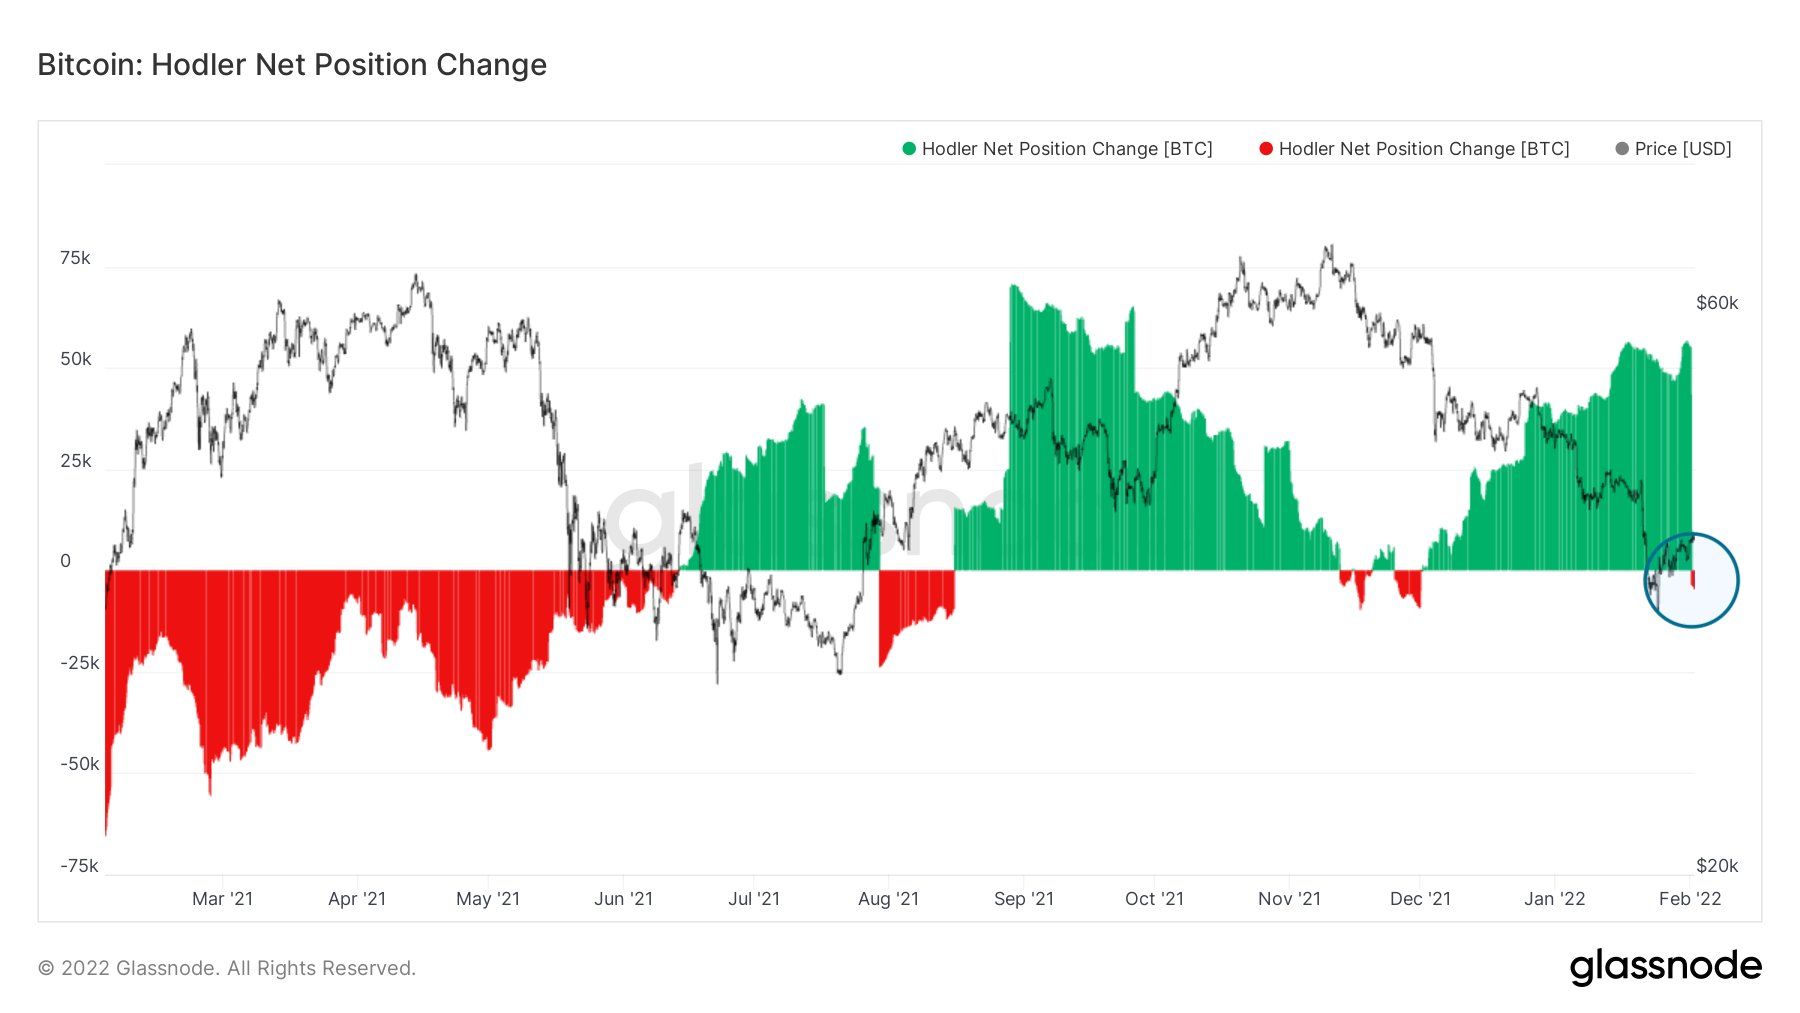
Another indicator to feel the visible effects of this movement of Bitcoin is the “change in net position of holders”, or “Hodler Net Position changes” in English. This indicator isolates the accounts of long-term holders and then measures whether they have increased or decreased their total holdings.
The indicator turned negative for the first time since December 2021.
However, despite this drop, it is unlikely to bring an end to the ongoing accumulation of BTC since last December. Rather, it is a one-time event and not a change in behavior of Bitcoin holders.
The BTC outputs spent indicator
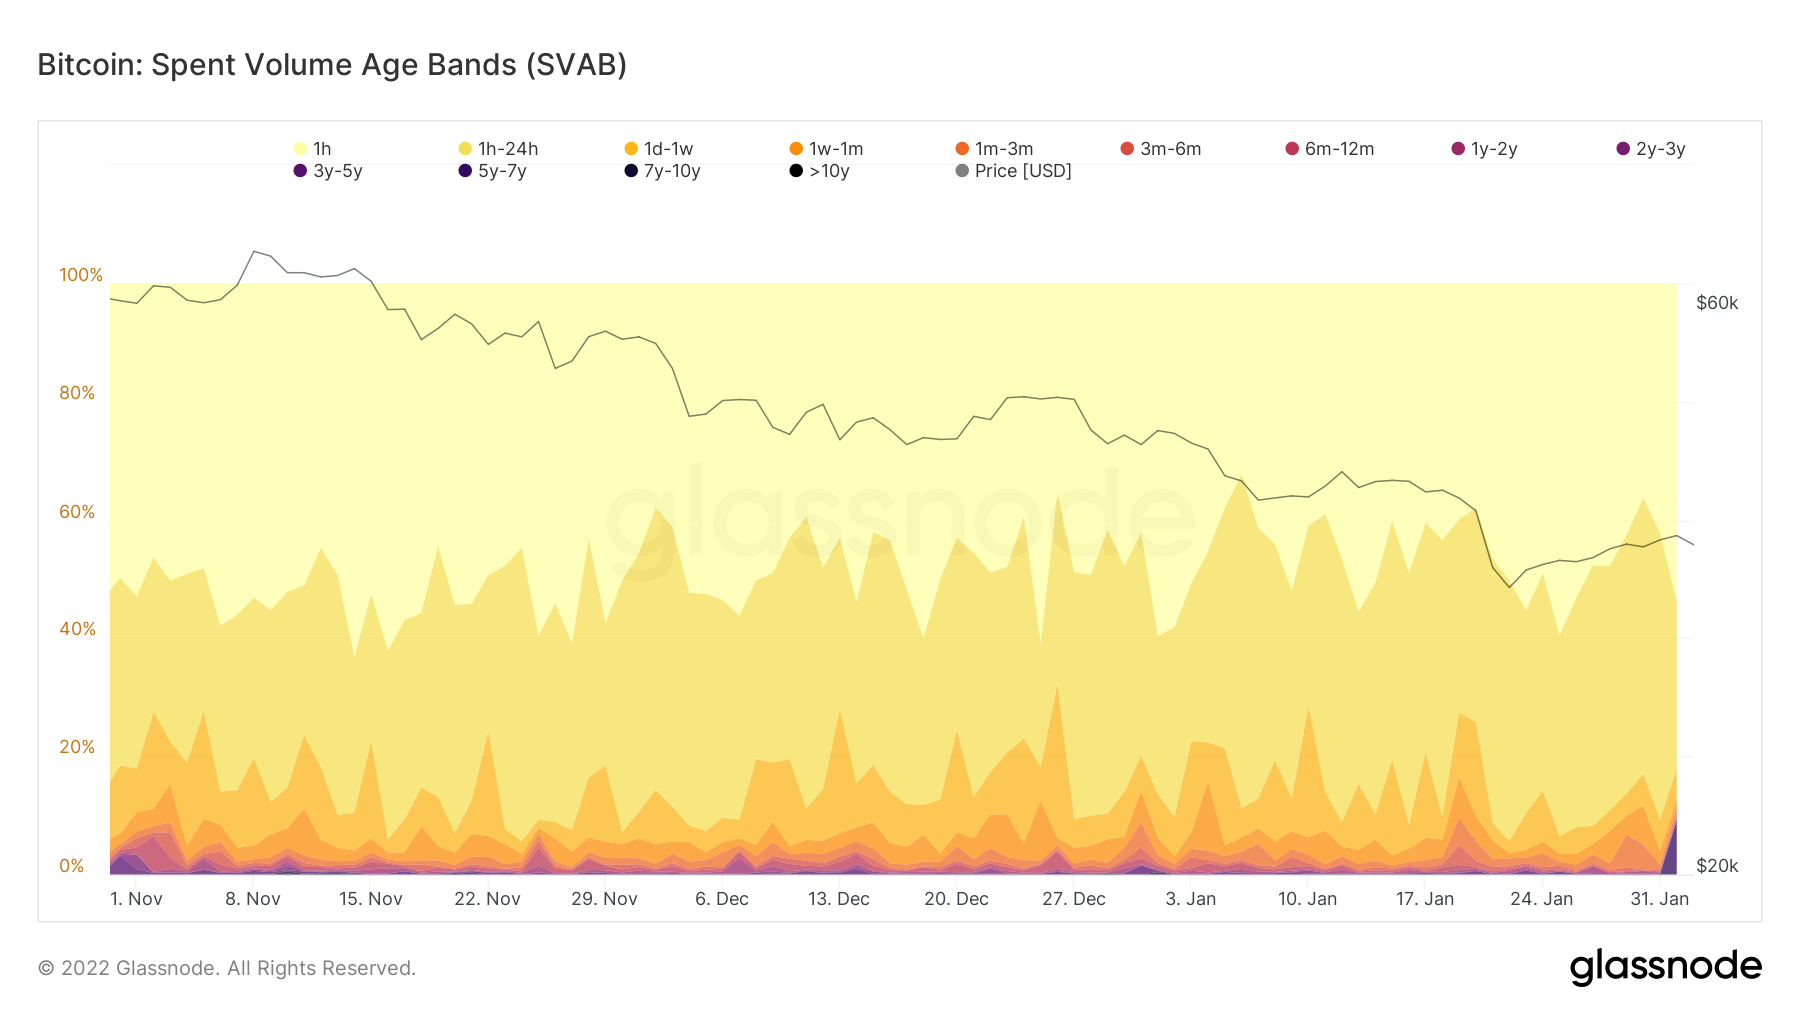
The spent volume age bands show the total BTC transfer volume as a function of coin age.
Currently, around 90% of the volume comes from coins that were last moved 24 hours ago.
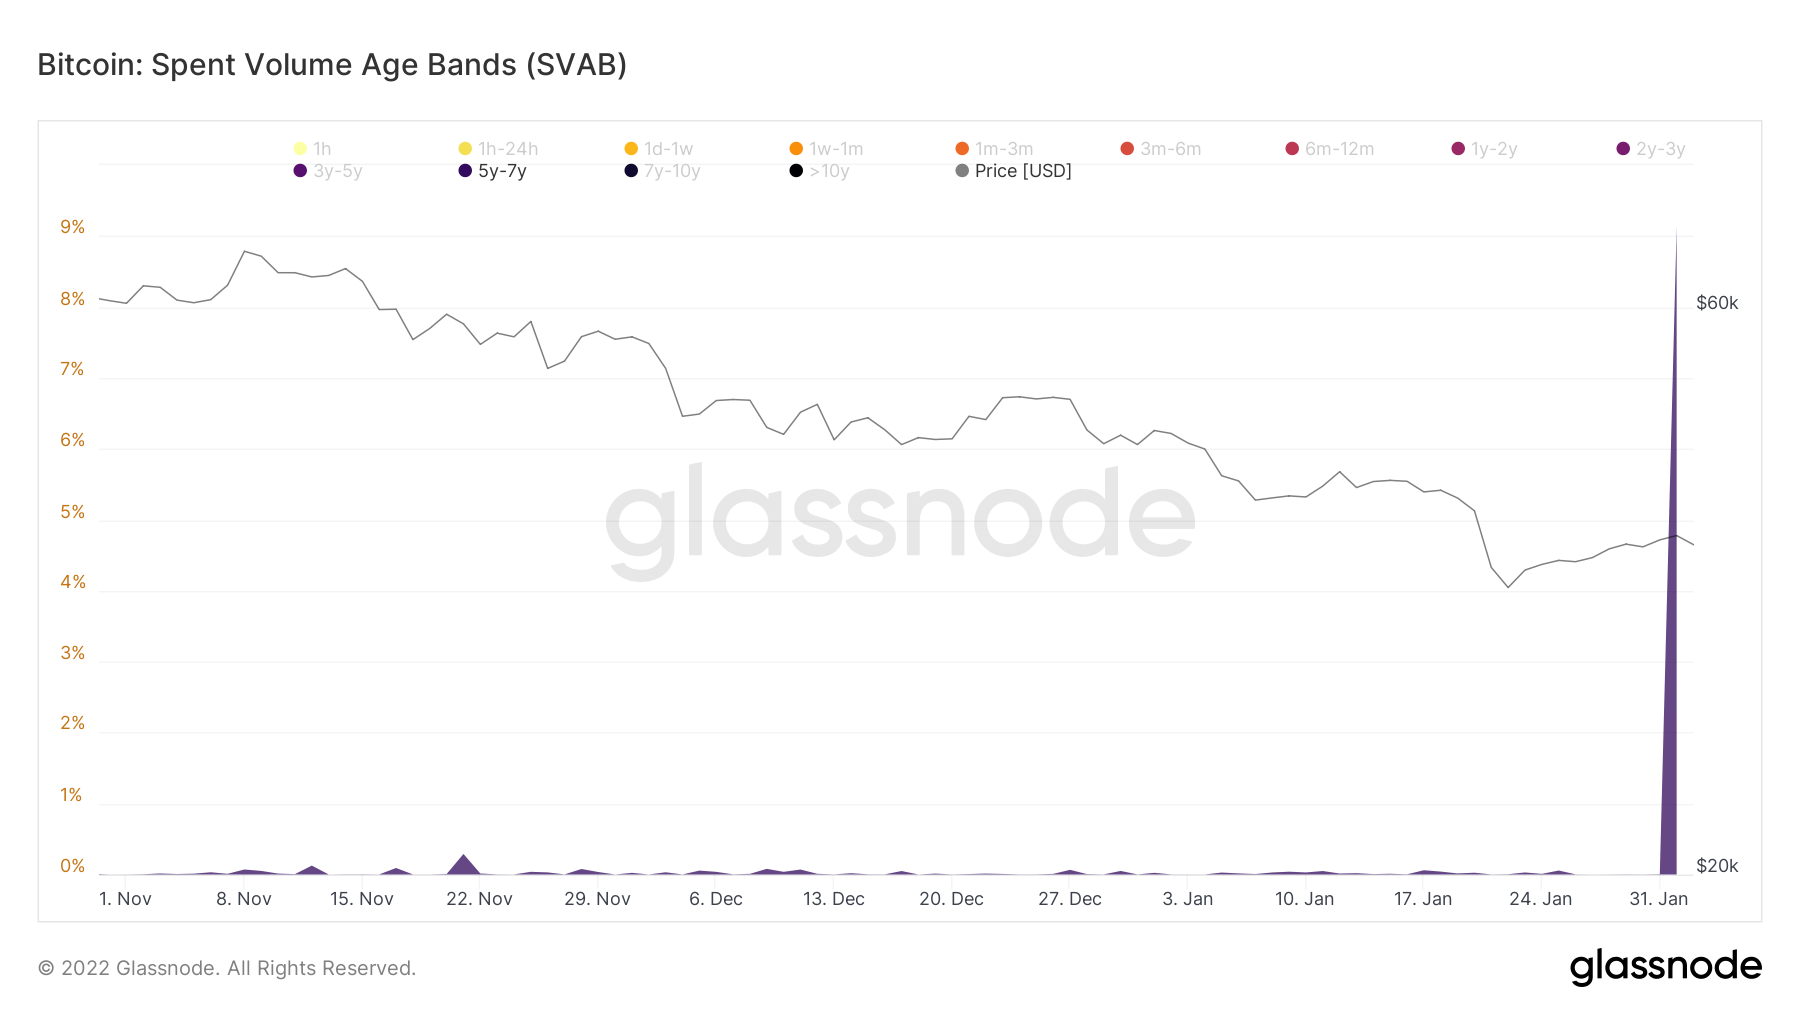
However, there is an interesting increase coming from the bands of 5 to 7 years.
With further analysis, it is seen that on February 2, the band peaked at 9% of the total volume. Considering that 2016 falls within this 5-7 year range, it was caused by the aforementioned 10,000 BTC movement.
The SOPR indicator
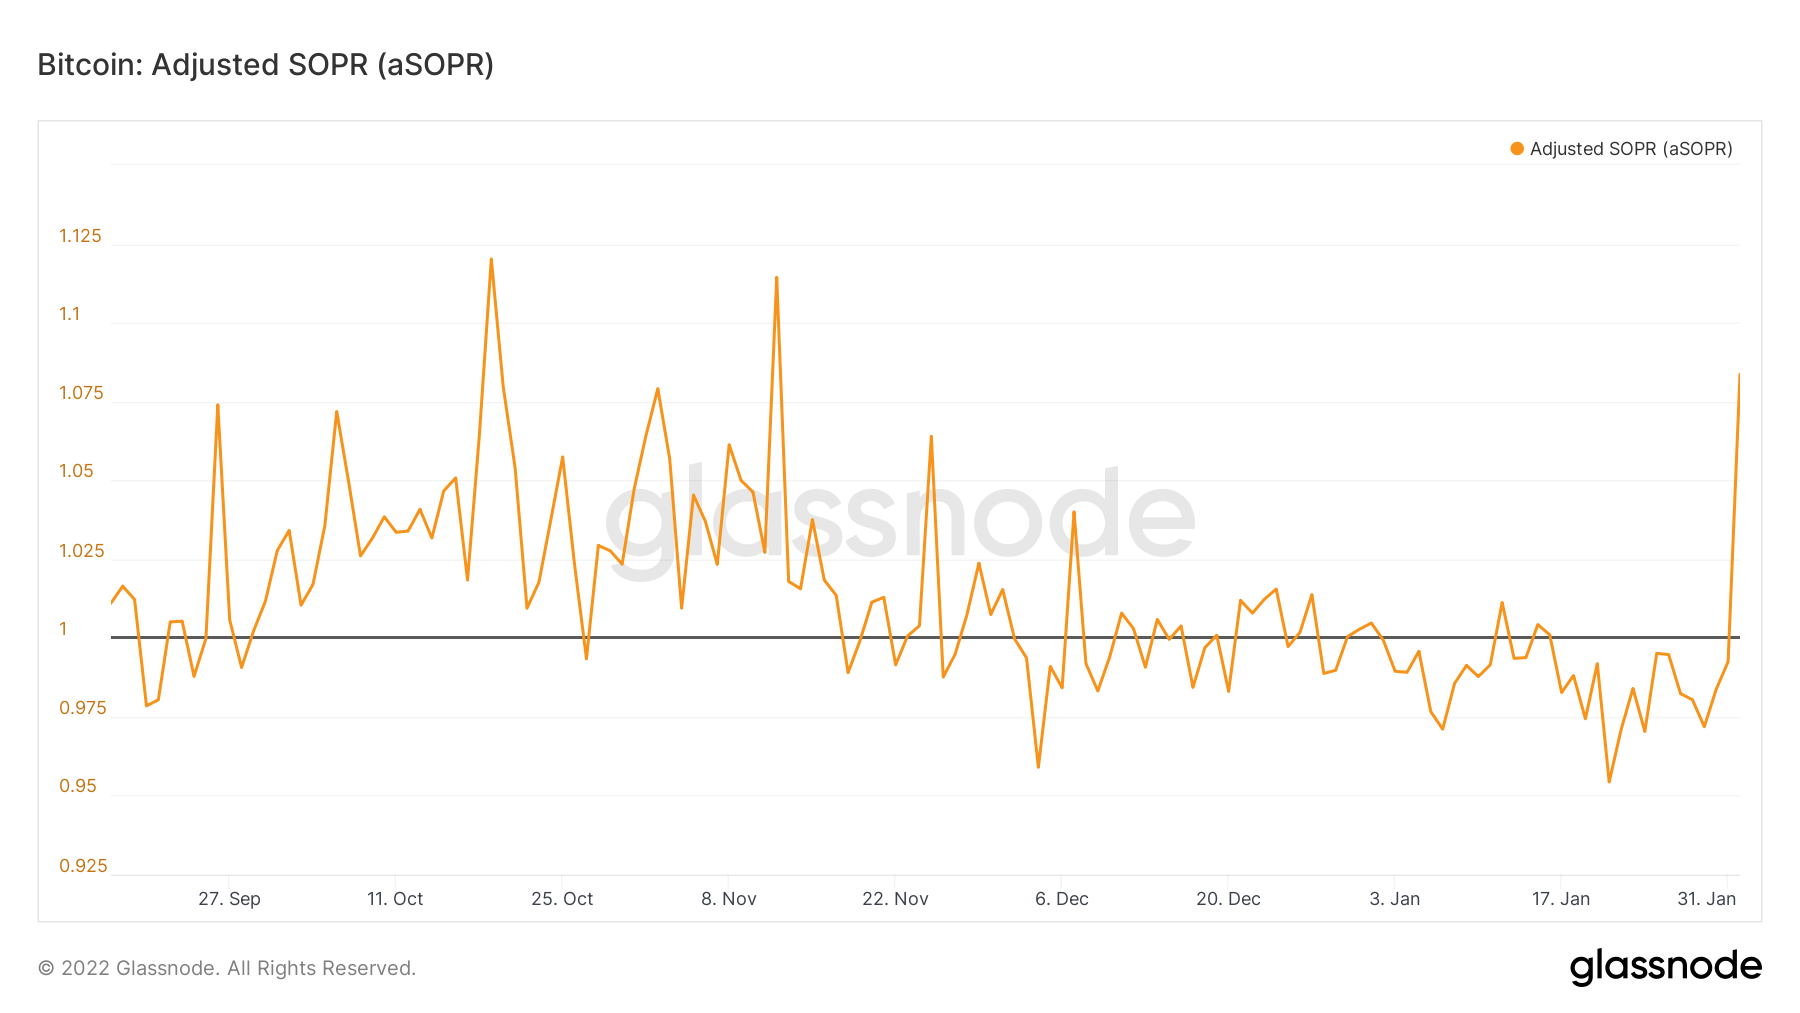
Finally, the indicator Spent Output Profit Ratio (SOPR) measures the overall profit or loss of the market on each day. Values greater than 1 indicate that the Bitcoin market is in overall profit.
On February 2, the indicator experienced a considerable spike, reaching a high of 1.075, the highest reading since early November.
As the BTC purchased in 2016 was worth much less than the current price of the asset, its sale is recorded as a large profit and is enough to offset the rest of the market losses.
Disclaimer
All information on our website is published in good faith and for general information purposes only. Any action taken by the reader based on information found on our website is entirely at their own risk.