Synthesis
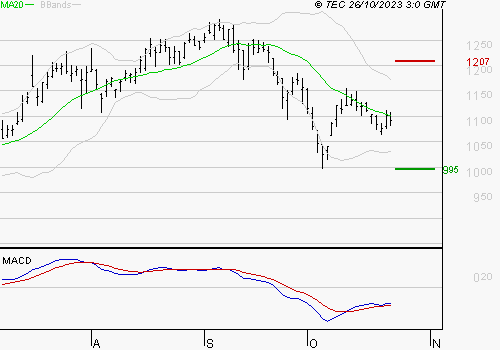
The MACD is negative, but it is above its signal line: the trend is changing. Now, the MACD must cross zero for the rise to continue in the coming days. The main Movement Strength Indicator (RSI) shows that the technical situation is quite healthy as there is no overbought. Stochastic indicators do not give clear signals for the days to come. The volumes traded are lower than the average volume over the last 10 days.
Moves and Levels
The stock is trending downward. It is below its 50-day moving average located at 11.76. The 20-day moving average is below the 50-day moving average. Our first support is at 9.95 EUR, then at 9.59 EUR and resistance is at 12.07 EUR, then at 12.42 EUR
| Tendency | Calculated data | ||
|---|---|---|---|
| Technical advice | Positive | Price on 26/10 | 10.93 |
| Basic trend | Bearish | MM20 | 11.01 |
| Bracket 1 | 9.95 | MM50 | 11.76 |
| Bracket 2 | 9.59 | ROI | 42.65 |
| Resistance 1 | 12.07 | MACD | – 0.21 |
| Resistance 2 | 12.42 | Stochastic | 57.65 |
Technical analysis provided by © TEC
Technical Analysis provided by TEC ©2023. All rights of reproduction and representation reserved. TEC is an analysis of the technical situation of an asset at a given time and which is subject to change at any time. The notions of support and resistance come from the elementary principles of technical analysis. This indicative information does not in any way constitute an inducement to sell or buy. The reader remains solely responsible for their interpretation and use of the information made available to them.