The crypto key currency Bitcoin (BTC) is striving towards the all-time high in the wake of news about the approval of the first Bitcoin ETFs in the USA. Only some of the altcoins can currently follow this bullish development. Investors are increasingly switching back to the largest crypto currency in order not to miss a possible run up to USD 87,000.
Driven by the high probability of the timely approval of a Bitcoin ETF, the crypto reserve currency can gain significantly in value. Bitcoin steals the majority of the show from the altcoins, which is also impressively underscored by the rise in Bitcoin dominance. Many investors are now tending to invest more in the most important and largest cryptocurrency. As has been observed several times in the past, the altcoin market will only catch up when Bitcoin itself takes a breather and tends sideways.
Best price development among the top 10 altcoins:
Polkadot (DOT):
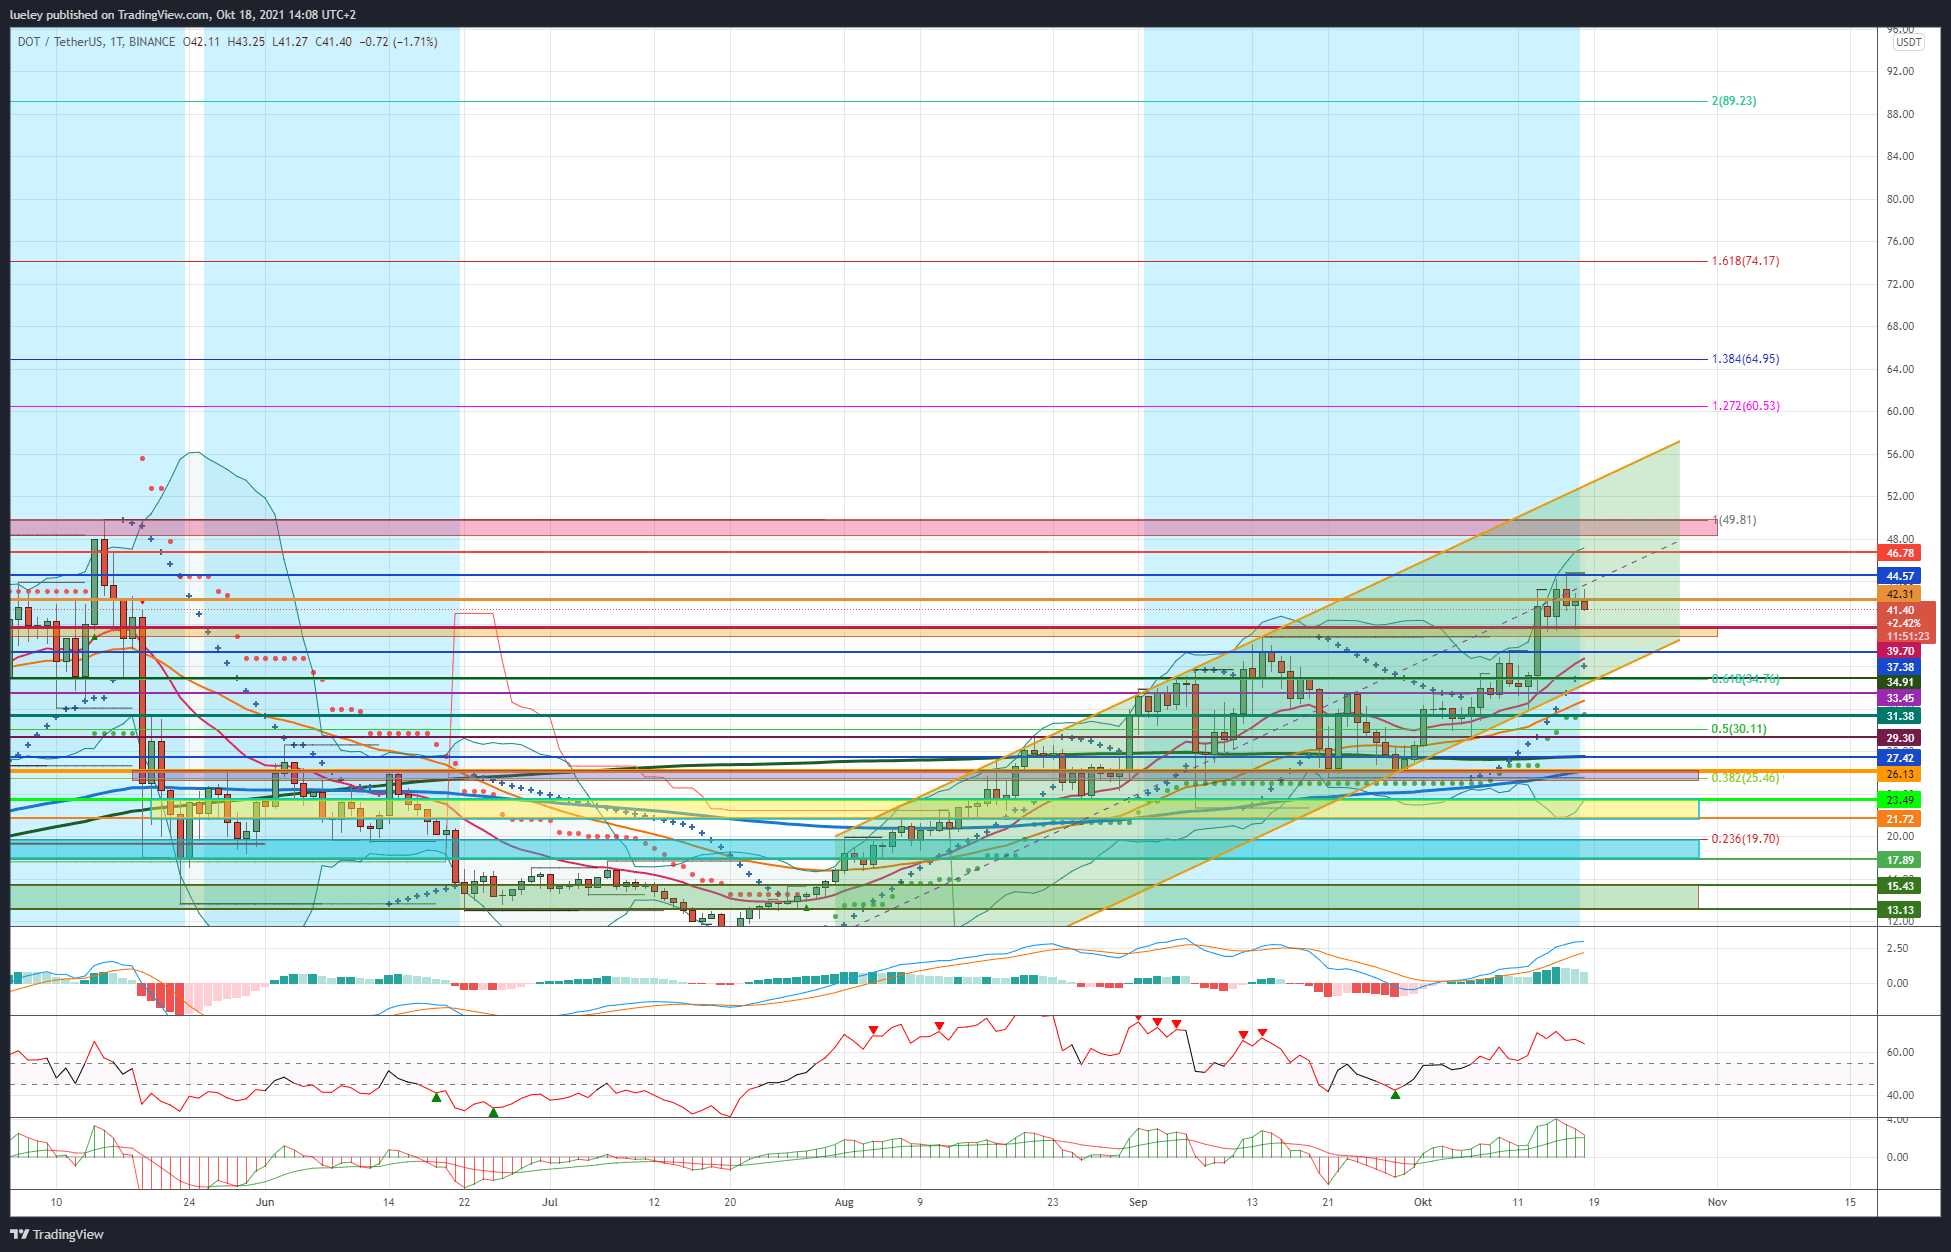
Polkadot’s bullish price increase brought the cryptocurrency, which specializes in cross-chain solutions, the week’s victory among the top 10 altcoins with a price increase of 24 percent. In the last few days of trading, however, the upward movement has stalled somewhat. Although the DOT price rose briefly above the resistance at USD 42.31, it has so far failed to stabilize sustainably above this resistance. Polkadot is currently trading at USD 41.40, around seven percentage points below its weekend high.
Bullish variant (polkadot)
Investors must now try to stabilize the price of Polkadot above USD 39.70. A short consolidation back to the EMA20 (red) in the area of USD 37.26 would be conceivable at most. At this mark at the latest, the bulls should allow the DOT price to rise back towards USD 42.31 in order not to jeopardize the current trend. If the resistance at USD 42.31 is climbed again and the resistance at 44.57 percent per day’s closing price is overcome, an attack in the direction of the resistance at USD 46.78 should be planned. A break above this level makes a break through to the all-time high at USD 49.81 likely.
Only when the all-time high is pulverized, however, can investors expect a rise to the 127 Fibonacci extension at USD 60.53. If the bulls manage to leave this resistance level behind in the coming trading weeks, a subsequent rise to the 138 Fibonacci extension at USD 64.95 is conceivable. If the overall market moves north together with the bullish Bitcoin price development, an increase up to the 161 Fibonacci extension at USD 74.17 must be taken into account in the medium term. A breakout above 74.17 USD activates further price fantasies in the direction of the 200 Fibonacci extension at 89.23 USD. Polkadot should then also aim for the maximum price target of USD 113.59 in the next six months. The 261 Fibonacci extension of the current price movement runs here.
Bearish variant (polkadot)
If, on the other hand, Polkadot slips dynamically back below USD 39.70, the correction initially expands towards USD 37.38. A relapse below this support, including the abandonment of the EMA20 (red), increases the probability of a correction to USD 34.91 noticeably. This is where the 61 Fibonacci retracement of the higher-level price movement runs. In addition, the lower edge of the green upward trend channel can be found here. Therefore, increased resistance from the cops can be expected. If, on the other hand, Polkadot gives up this support on a sustained basis, the correction expands to at least USD 33.45.
If there is no dynamic countermovement by the bulls here either, the support at USD 31.38 comes into focus. Here there is a strong cross support from the supertrend and the horizontal support line. A clear undercut activates USD 29.30 as a bearish price target. The Fibonacci 50s retracement runs here, among other things. If the bears manage to dynamically undercut this key support, the correction will expand towards USD 27.42 (MA200) (green) or even USD 26.13. The EMA200 (blue) is currently at USD 26.13. If these two sliding support lines were to break, that would be an important partial success for the seller side.
If the 38 Fibonacci retracement at USD 25.46 is subsequently abandoned, the correction extends into the yellow support zone between USD 23.49 and USD 21.72. The lower Bollinger Band is currently running at USD 23.49. In the short term, a relapse to the yellow support area is not to be planned. Only when the overall market corrects more clearly, Polkadot could target its maximum price targets on the downside between USD 19.70 and USD 17.89. Here the 23 Fibonacci retracement runs at 19.70 USD as well as the breakout level of the current price rally. In the short term, investors should use temporary price weaknesses at Polkadot for new entrants.
Indicators (polkadot)
Both the RSI and the MACD indicator are currently trending slightly sideways, but they still have buy signals. The same picture is shown in the weekly chart. The indicators continue to favor a continuation of the current upward rally.
Worst price development among the top 10 altcoins:
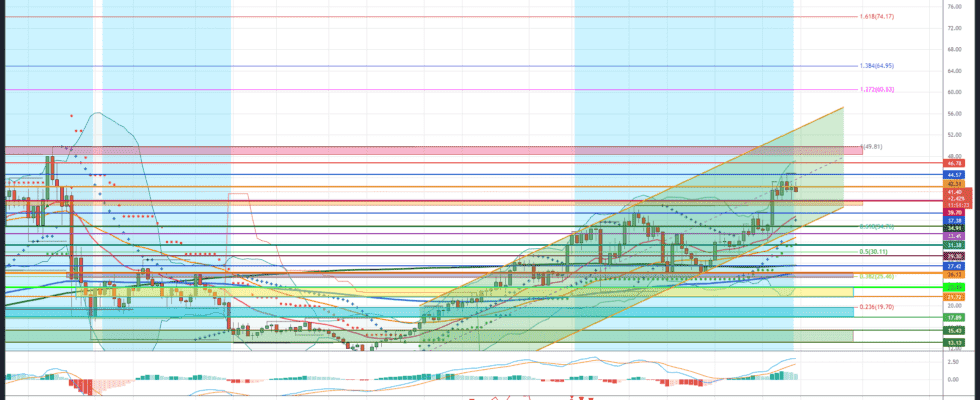
Terra (LUNA)
The price of Terra was unable to maintain its bullish tendency of the last few months and is currently consolidating more significantly southwards since reaching a new all-time high at USD 49.61. Starting from the all-time high, the LUNA price has lost more than 25 percentage points in value to currently USD 35.80 in the past few weeks. So Terra is now wedged between its moving average lines EMA20 (red) and EMA50 (orange) and is currently trending sideways.
Bullish variant (Terra)
The LUNA rate has recently had to pay tribute to the sharp rise in recent months. Terra has been in the area of the light blue support zone in the last few days of trading. In the short term, the bulls have to stabilize the LUNA rate above the EMA50 and heave the rate back above the EMA20. A recapture of USD 38.45 will initially open up opportunities towards the resistance area between USD 39.96 and USD 41.41. If it stabilizes above USD 41.41, a subsequent rise to the 88 Fibonacci retracement at USD 44.29 is likely. If this resist breaks, the all-time high will come back into focus for investors. This is also where the upper Bollinger Band is currently running, which should have a course-limiting effect on the first attempt.
Only when the bulls manage to break through the USD 49.61 daily closing price, there are good chances of a march through to the next target price of USD 56.03. This is derived from the Fibonacci extension of 127. Above this mark, the LUNA price takes target in the direction of the 138 Fibonacci extension at 60.57 USD. Here is to be planned with increased profit-taking. A price rally on the crypto market in the coming trading months should see Terra rise to the 161 Fibonacci extension at USD 70.05. If this resistance level is also pulverized, the next price target will be activated in the form of the 200 Fibonacci extension at USD 85.52. By the end of the year, a march through to the 261 Fibonacci extension at USD 110.55 cannot be ruled out. The long-term target price for Terra is unchanged at USD 151. This is where the 361 Fibonacci extension runs, an important overarching price target.
Bearish variant (Terra)
If, on the other hand, the LUNA rate sustains the important support at USD 34.79, the correction initially expands in the direction of the cross support at USD 32.38. In addition to the 61 Fibonacci retracement, there is also an important horizontal support line running here. A fall below this support level extends the correction noticeably towards the supertrend at USD 29.60. If there is no trend reversal to the north here either, further bearish targets at USD 27.06 and USD 25.17 will come into focus. Should the bears dynamically undercut the red support area, the correction will expand towards USD 23.09. Here you can find the low of September 7th of this year. Again the cops will try to counter it.
If the seller succeeds in breaking through this support via the daily closing price, the correction extends to the cross support from 38 Fibonacci retracement and EMA200 (blue). Thus, the area around USD 21.74 represents a strong support. If this support is abandoned, a correction expansion into the orange chart area is likely. In particular, the MA200 (green) at USD 18.50 deserves more attention. The maximum bearish price target remains unchanged at USD 17.49. Terra started its higher-level upward rally at this price mark. Only when the overall market falls back more significantly to the south and Bitcoin falls below USD 40,000, a fallback of the LUNA rate to the 23rd Fibonacci retracement at USD 14.15 would be conceivable. Although Terra has lost its price strength of the last few months, investors should still favor price setbacks for new long entries.
Indicators (Terra)
The RSI as well as the MACD indicator recently turned more clearly to the south and indicate a significant cooling of the bullish trend. The MACD indicator shows a sell signal in the daily chart. The RSI is also trading in its neutral zone between 45 and 55 with a value of 46. If the RSI falls below 45 at the daily closing price, a sell signal is activated here as well.
Top 10 stability
Bitcoin continues to be bullish and can gain a good 13 percentage points in value on a weekly basis. Only Polkadot (DOT) shows a higher weekly profit with a price increase of 24 percent. The Binance Coin (BNB) with 16 percent price increase and Ethereum (ETH) with 12 percent increase in value. The list of underperformers is led by the crypto currency Terra (LUNA), which also corrected this week by more than six percent. Cardano (ADA) and Ripple (XRP) are also weak, each with a price discount of around three percent. In the ranking of the top 10 altcoins, there are no changes to the ranking to report for the past trading week.
Winner and Loser of the Week
The outperformance of Bitcoin (BTC) this week led to increased shifts of investor funds from Altcoins back to the crypto reserve currency. Just under half of the top 100 altcoins show an increase in price on a weekly basis. The winners list is led by Polygon (MATIC) with a price increase of 26 percent, followed by one of the outperformers of the previous week, Stacks (STX), with 20 percent. Stellar (XLM) and Telcoin (TEL) are also convincing, each with a 17 percent increase in value.
On the losing side, Olympus (OHM) leads the field with a 26 percent price drop, followed by Flow (FLOW) with a 20 percent price drop. Decred (DCR) and Arweave (AR) also lose more of their value, each with a 13 percent course correction. The forecast that the increase in Bitcoin dominance should lead to an underperformance of the Altcoin market in the short term is currently confirmed.
Disclaimer: The price estimates presented on this page do not constitute buy or sell recommendations. They are only an assessment of the analyst.
The chart images were created using TradingView created.
USD / EUR exchange rate at the time of going to press: 0.86 euros.