Bitcoin (BTC): Course reversal is in the starting blocks
BTC course: 43,652 USD (previous week: 46,270 USD)
Resistance / goals: $ 43,800, $ 44,851, $ 45,474, $ 45,846, $ 47,070, $ 48,222, $ 49,487, $ 51,307, $ 52,125, $ 53,005, $ 54,077, $ 55,817, $ 56,979, $ 57,901, $ 59,778, $ 61,771, $ 63,189 $ 64,896, $ 66,299, $ 67,416, $ 69,000, $ 70,856, $ 76,472, $ 77,678, $ 85,563, $ 87,090, $ 89,982, $ 100,259, $ 114,961
Supports: $ 42,542, $ 41,438, $ 40,585, $ 39,559, $ 37,389, $ 36,643, $ 34,899, $ 30,000, $ 28,810, $ 26,170
The Bitcoin course is alive! After weeks of sales and a relapse to the repeatedly mentioned trailing edge at USD 39,559, the crypto reserve currency showed a clear backlash at the beginning of the week. As a result, a reversal formation formed, which was confirmed yesterday, Tuesday, January 11th. The US inflation figures of 7 percentage points presented in the early afternoon coincided with analyst expectations. For the time being, all the negative effects of a failed monetary policy on the part of the central banks now seem to have been priced in.
A renewed consistency test of the key support area between 42,542 USD and 40,585 USD is conceivable at any time, as long as Bitcoin stabilizes at the daily closing price but above 40,000 USD, a bullish countermovement of at least 45,846 USD is to be planned for the time being. Here it should be decided whether another bearish downward movement will start or whether the bulls can take over the helm again for the long term. The fact that the technology index Nasdaq (NDX) was also able to initiate a strong bullish reversal and thus averted a major correction for the time being also plays into the cards for the crypto sector.
Bullish scenario (Bitcoin price)
The Bitcoin bulls turned things around at the last second, preventing a relapse below the psychologically important USD 40,000. The clear sell-off has certainly left its mark and caused some significant price drops in the Altcoins, but the reversal at the beginning of the week also gives hope for a sustained price recovery in the coming trading weeks. It is not uncommon for the financial market to do exactly the opposite of what market participants anticipated.
The fact that the RSI indicator also turned up at an important low at 28.25 and that the divergence indicator also formed a higher low despite lower price lows further reinforces the initially bullish view of the BTC chart. However, the oversold condition is likely to be retested again soon. Investors must now do everything in their power to stabilize the BTC rate above USD 43,800 at the end of the day in order to start a rise in the direction of the EMA20 (red) at USD 44,851 and prevent a new sell-off. If this mark is broken immediately, a preliminary decision for the next trading days will be made between USD 45,474 and USD 45,846.
Recapturing this strong resistance zone should lead Bitcoin directly back to USD 47,070. From this area on, however, a clear resistance from the bears is to be planned. The green resistance area combines several strong resistance levels. The supertrend can be found at USD 47,600. A cross resist of MA200 (green), EMA50 (orange) and horizontal resistance also runs just above it at USD 48,222. A direct break in this zone is not to be expected, at least in the first attempt. Rather, the bulls have to bite into it and gradually develop higher lows in order to soften the resistance. If Bitcoin can then settle above USD 48,222 and also regain the EMA200 (blue) at USD 49,134, the chart will brighten up further. A rise into the blue zone with a price target of USD 50,790 and USD 51,307 should follow.
The way to $ 60,000
If there is no sustained reversal back below USD 48,222, investors will do everything in their power to attack the interim high of December 27, 2021 at USD 52,124. A successful recapture of this resistance level will then focus on the zone between USD 53,005 and USD 54,077 as the target area. This is also where the upper Bollinger Band can be found, which should initially have a price-limiting effect. If the bulls develop enough purchasing power to overcome this zone as well, Bitcoin will immediately jump to USD 55,817. First investors will want to reap profits here. If Bitcoin can break out above this price mark in the medium term, it will be decided in the USD 57,901 area at the latest whether this upward movement is merely of a technical nature or whether the chances of a rise in the direction of a new all-time high continue to increase. In addition to the horizontal resistance, the 61’s Fibonacci retracement of the complete downward movement from the all-time high runs here.
The chart image brightens
The breakout of this resistance would have an important technical chart character. Bitcoin should then target USD 59,778. If Bitcoin does not bounce back to the south on a sustainable basis and subsequently also overcomes the 61,771 USD, the chance of an attack towards the all-time high increases significantly. If it is overcome, Bitcoin should penetrate directly into the zone between USD 63,189 and USD 64,896. If the high of November 15 at USD 66,299 can then be broken, a march above USD 67,416 in the direction of the high at USD 69,000 is likely. Investors should keep the zone between $ 57,901 and $ 59,778 in mind as a possible target price.
Bearish scenario (Bitcoin rate)
The bears have achieved their first overall price target. After the seller’s side sent the BTC rate down significantly last weekend and at the beginning of the week also missed the trailing edge at USD 39,559 by just a few USD, the bulls came back on the floor with all their might. For the time being, the buyer side prevented a relapse into the crypto winter prophesied by many market players. Even if the buyer side has now seized the scepter again in the short term and was able to start a recovery rally as long as Bitcoin is capped below USD 48,222, a new sell-off on the part of the bears can be expected at any time. The bears should try to initiate a new sell-off in the $ 45,474- $ 45,846 range in the short term. If there is a reversal towards USD 42,406 in this zone and this is broken again, the bulls between USD 41,438 and USD 40,585 must be on the spot.
The risk of a widening of the correction continues to increase
A relapse below this support zone makes a retest of the weekly low at USD 39,960 likely. However, if the buyer cannot defend this support, and Bitcoin trades below this support at the weekly closing rate, there is a risk of the trend dynamic accelerating towards the south. The crypto winter scenario would then be up-to-date again immediately. Bitcoin should correct immediately to the 23rd Fibonacci retracement at USD 37,389. If there is no reversal, the sell-off will instantly expand towards USD 36,643 and USD 34,899.
This makes a correction to the psychologically important USD 30,000 mark or below much more likely. A break of 34,899 USD leads Bitcoin straight up to 30,000 USD. If the bulls cannot defend this price level either and the 2021 low of USD 28,795 is abandoned, the correction will at least extend into the light green zone between USD 26,170 and USD 27,562. The retest of the breakout level at USD 20,000, which is expected by many investors, would also be within their grasp.
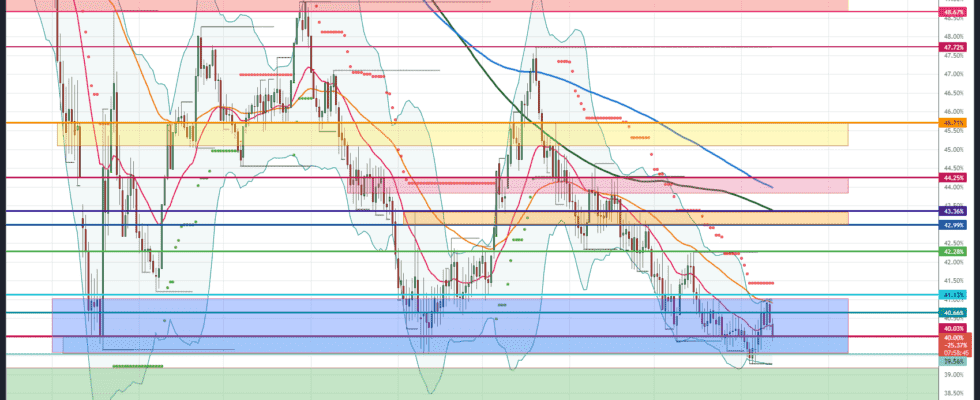
Bitcoin dominance: 40 percent and no end
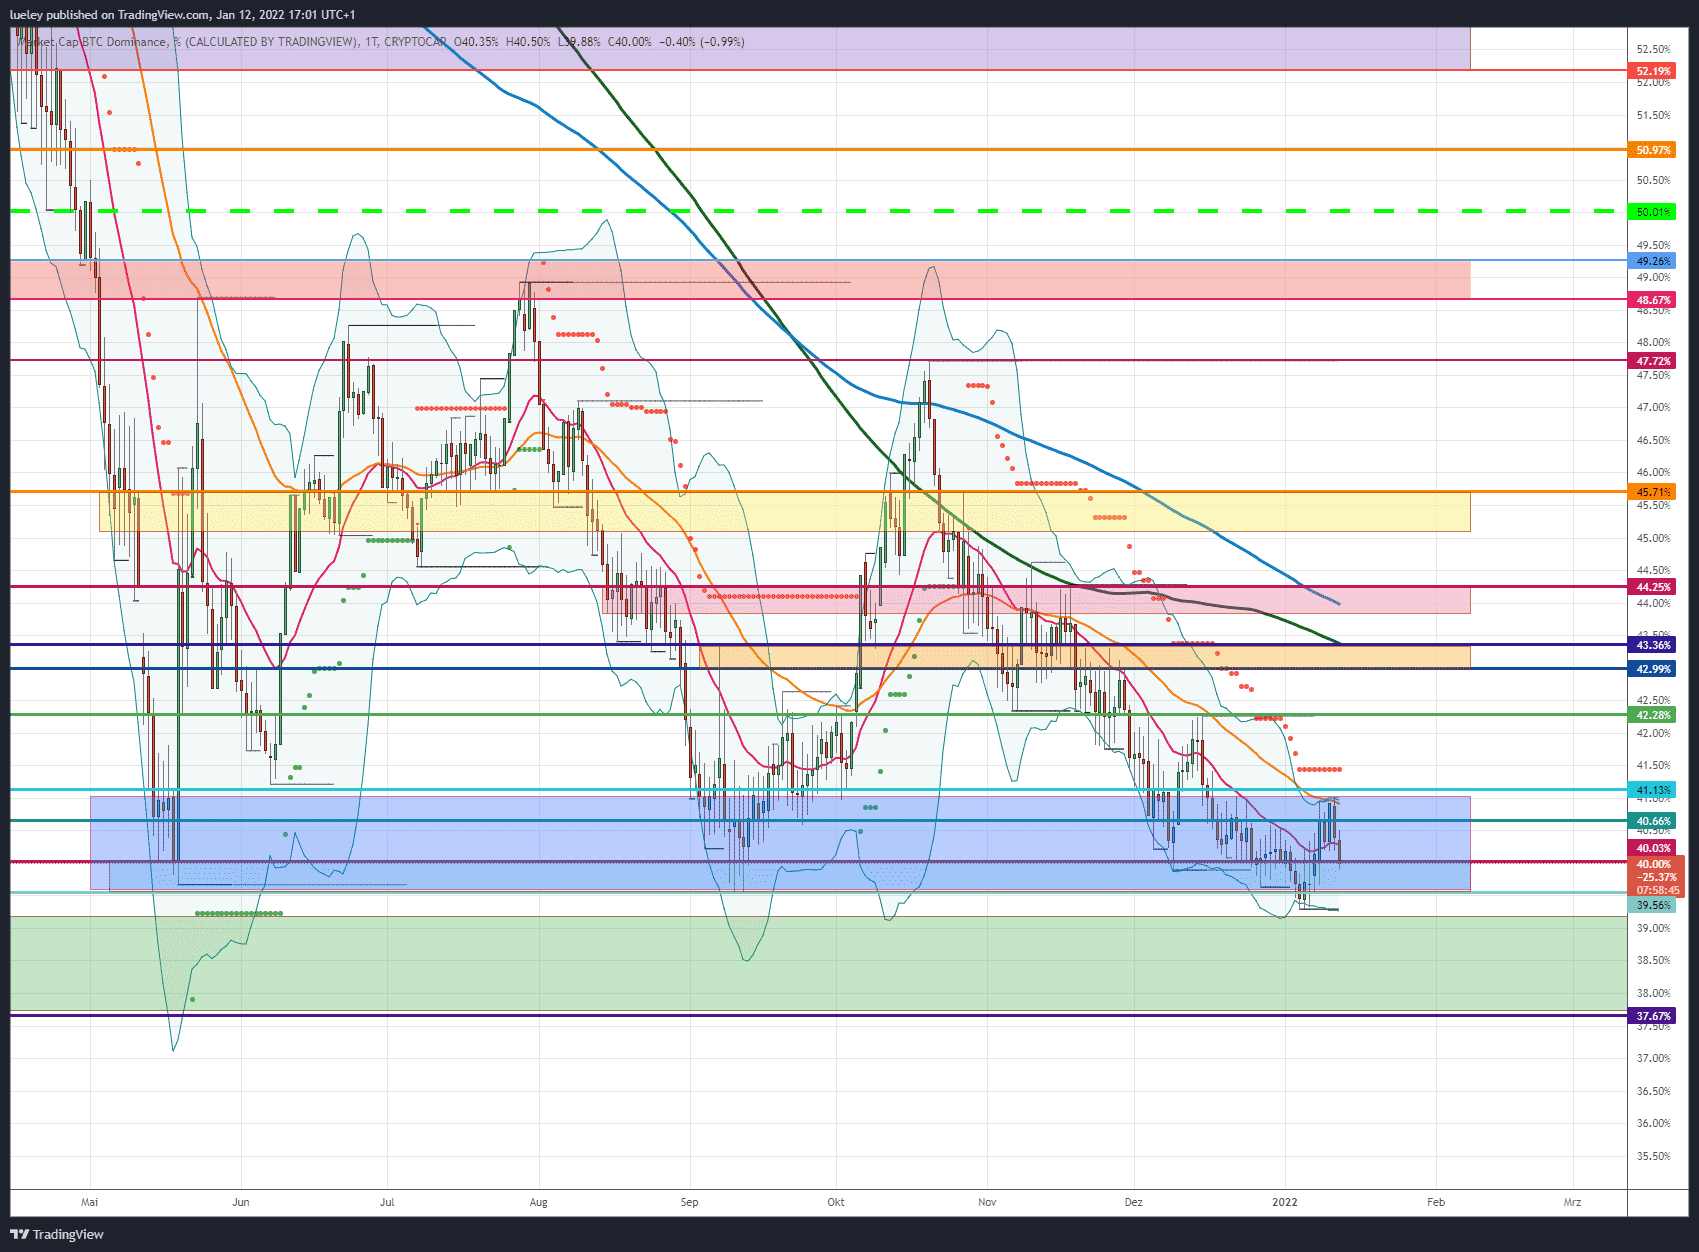
Bitcoin dominance was able to pull its neck out of the loop again in the last few days of trading. For the time being, a break of 39.56 percent could be averted again. The clear setback in the overall market prompted investors to switch from Altcoins back to the crypto reserve currency. Investors reacted more and more risk averse to the sometimes significant price drops. Again a preliminary decision seems to have been postponed. As long as BTC dominance can stabilize above 40.03 percent at the end of the week, investors must watch carefully whether Bitcoin can use the area around the year low as a starting point for a renewed liberation of its market power. As the key brand on the upside, the 41.13 percent mark must be kept in view.
BTC Dominance: Bullish Scenario
The BTC dominance is still not defeated. The patience continues. Bitcoin dominance once again defended the area by 40 percent. However, it subsequently failed to overcome the cross resistance from EMA50 (orange) and the upper Bollinger band at 41.13 percent. The market power of the crypto key currency is currently slipping back to the lower edge of the range, leaving all options open again. If it is possible to break out of the blue support zone upwards in the coming days and also break through the supertrend at 41.44 percent, there would initially be room in the direction of 42.28 percent. Here market dominance failed as early as December.
If this resistance is also regained without a lasting setback, the orange resistance zone between 42.99 percent and 43.36 percent comes into focus again. In particular at the 43.36 percent a ricochet should be planned, since the MA200 (green) also runs here. An outbreak above this, however, should lead the BTC dominance directly in the direction of the red resist zone. In addition to the horizontal resistance area, the EMA200 (blue) can also be found here. If Bitcoin can expand its outperformance compared to the Altcoins and also leave the 44.25 percent behind, the bottoming out should be completed in the short term. A further increase into the yellow zone between 45.08 percent and 45.70 percent is then to be planned. A renewed strength of the Bitcoin dominance would also enable an increase up to the October high of 47.72 percent. This resistance level is to be seen as the maximum increase target for the coming period.
BTC Dominance: Bearish Scenario
Once again, the breakthrough below 39.56 percent has been averted and a preliminary decision has been postponed again. Only when the BTC dominance falls back below 40.03 percent at the end of the day does this mark come into focus again. If the result is a dynamic relapse below this support level, a retest of the previous week’s low at 39.30 percent is likely. Against resistance is to be expected here. If the BTC dominance at this brand cannot stabilize and rebound decisively to the north, a further decline in dominance must be planned. The trend movement then threatens to expand immediately to 37.67 percent.
A last attempt should be made here to avert the final fall in BTC dominance towards 30 percent. If there is no dynamic upward movement back above 40 percent in this area, the psychologically important 30 percent mark could be targeted in the coming months. Accordingly, the altcoin season hoped for by many market players could also start in the coming weeks.
Disclaimer: The price estimates presented on this page do not constitute buy or sell recommendations. They are only an assessment of the analyst.
The chart images were created using TradingView created.
USD / EUR exchange rate at the time of going to press: 0.88 euros.
Tax returns for cryptocurrencies made easy
In the BTC-EHO guide we show you the best tools for the automatic and easy creation of crypto tax reports.
To the advisor