The bullish rally in many top 100 altcoins appears to have continued unabated after a short break in the previous week. Many altcoins like Polkadot (DOT) can come up with new all-time highs in addition to the number two Ethereum (ETH).
The majority of the top 100 altcoins are bullish this trading week as well. In particular, the exchange’s own crypto currency WazirX (WRX) overshadows everything and rises northwards by more than 1,000 percent on a weekly basis. With the crypto currency Wink (WIN), which specializes in online gambling, another newcomer can also show an exceptionally strong price increase of around 490 percentage points. With the Harmony Token (ONE) and the Theta Token (THETA), on the other hand, two outperformers in March are currently suffering from profit-taking. Both crypto currencies give double-digit value, which is not surprising in view of the significant price jumps in the previous weeks.
Best price development among the top 10 altcoins:
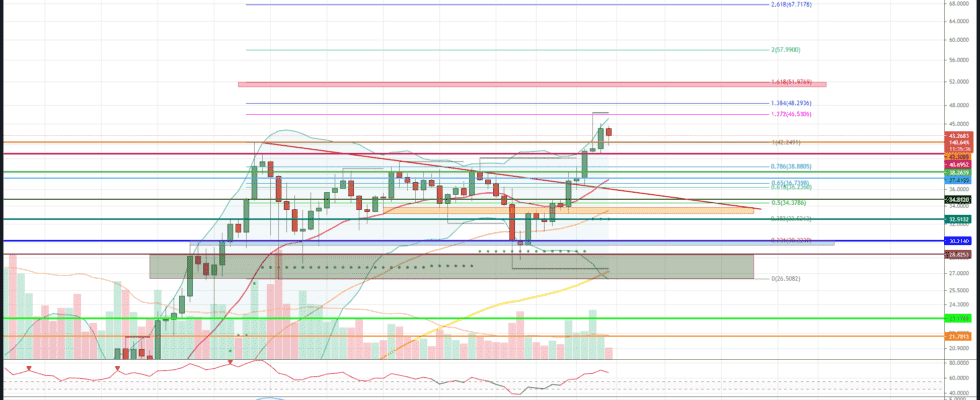
Polkadot (DOT)
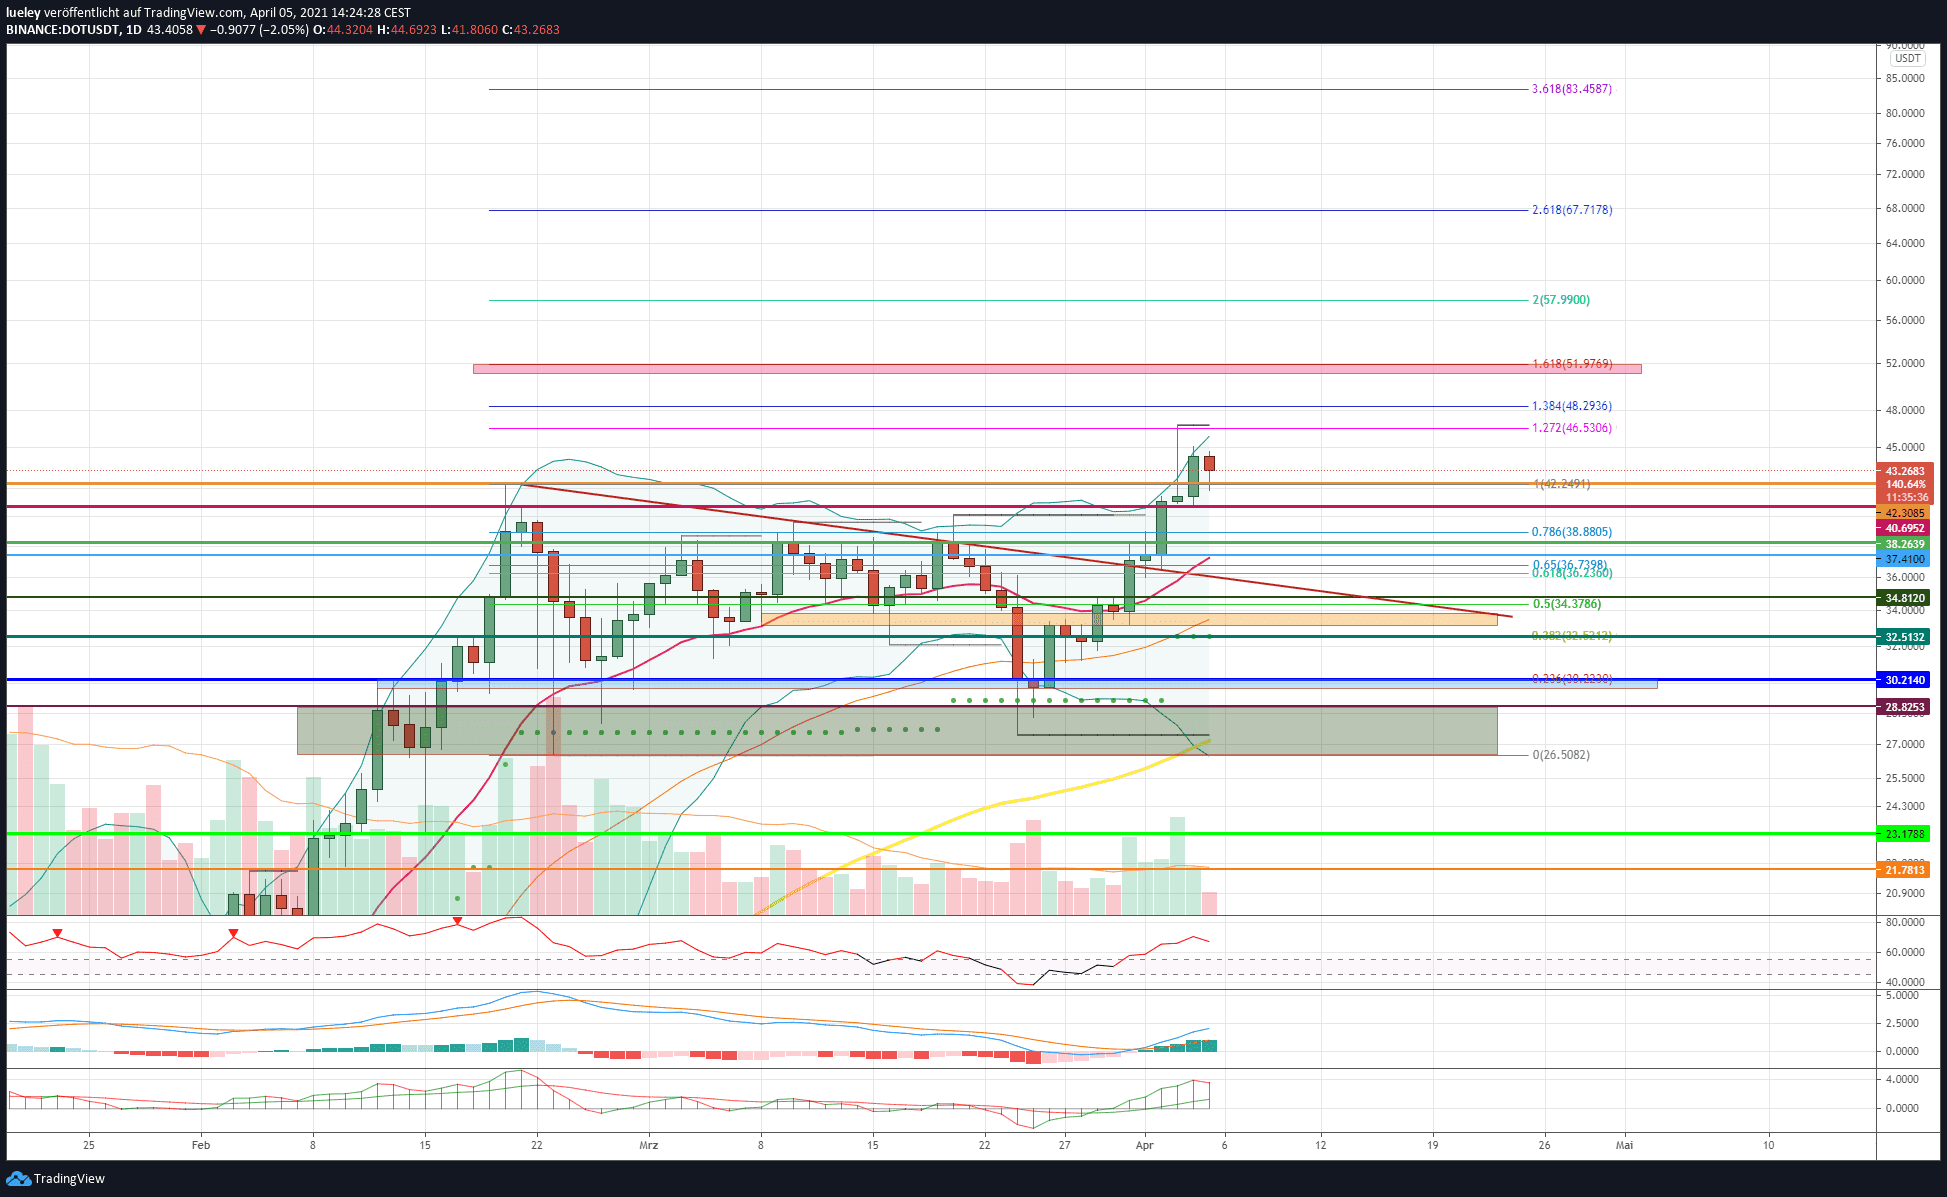
Price analysis based on the value pair DOT / USD on Binance
After a consolidation phase in March, the DeFi-Crosschain Project Polkadot (DOT) can build on its old strength again this week. The DOT price rose this week to a new all-time high at USD 46.80 and at the time of this analysis is still trading above its February high at currently USD 43.72.
Bullish variant (polkadot)
If the Polkadot price stabilizes above USD 42.30, a sustained price rally is likely. The DOT price should rise again in the coming trading days in the direction of the 127 Fibonacci extension at USD 46.53. If DOT subsequently also overcomes the weekly high at USD 46.80 and also breaks dynamically upwards via the 138 Fibonacci extension at USD 48.29, the 161 Fibonacci extension at USD 51.97 comes into focus. This chart mark represents the first important price target of the current bullish price movement.
display
Trade Bitcoin, stocks, gold and ETFs in one app!
Reliable, simple, innovative – trade Germany’s most popular financial instruments easily and securely.
The advantages:
☑ Free 40.0000 EUR demo account
☑ Registration in just a few minutes
☑ PayPal deposit / withdrawal possible
☑ Available 24/7 + mobile trading
To the provider
76.4% of retail investor accounts lose money when trading CFDs with this provider [Anzeige].
If this resistance is also broken sustainably upwards, a subsequent increase up to USD 57.99 should be planned. The 200 Fibonacci extension of the current price rally runs here. In the medium term, a march through to the 261 Fibonacci extension at USD 67.71 is also conceivable. If the interest of investors does not wane, an increase in the direction of the 361 Fibonacci extension at USD 83.45 cannot be ruled out for the second half of the year. The maximum price target for Polkadot in 2021 is the 461 Fibonacci extension at USD 99.19. There is thus a price potential of more than 120 percentage points.
Bearish variant (polkadot)
If the DOT rate slips back below the support at USD 42.30 in the course of an overall market correction and USD 40.69 does not give a hold either, the consolidation should expand into the range between USD 38.26 and USD 38.80. There is strong horizontal support here as well as the 78th Fibonacci retracement of the current upward movement. If this support area does not hold, a relapse to the EMA20 (red) at USD 37.41 should be planned. If the bears manage to push the DOT price below this sliding support, investors will focus on the area between USD 36.73 and USD 36.23. In the short term, a retest of the red downtrend line at USD 34.81 cannot be ruled out.
At the latest at this support, increased resistance from the bull camp can be expected. On the other hand, if the correction expands, a relapse into the orange support zone is conceivable. The EMA50 (orange) also runs here. If this support area is also given up at the daily closing rate, a correction expansion up to the 38th Fibonacci retracement at USD 32.52 should be planned. The supertrend in the daily chart is currently also running here. If the entire crypto market corrects more significantly in the coming weeks, Polkadot could also give way and break away to the blue support zone made up of the lows and the 23rd Fibonacci retracement. The area around USD 30.21 represents the maximum bearish price target in the short term.
Indicators (Polkadot): RSI and MACD with active buy signals
The RSI is currently trending slightly south in the daily chart, but still has an active buy signal. The MACD indicator also generated a new buy signal this week, which underpins the bullish thesis that the DOT price will continue to rise.
Worst price development among the top 10 altcoins:
Theta Token (THETA)
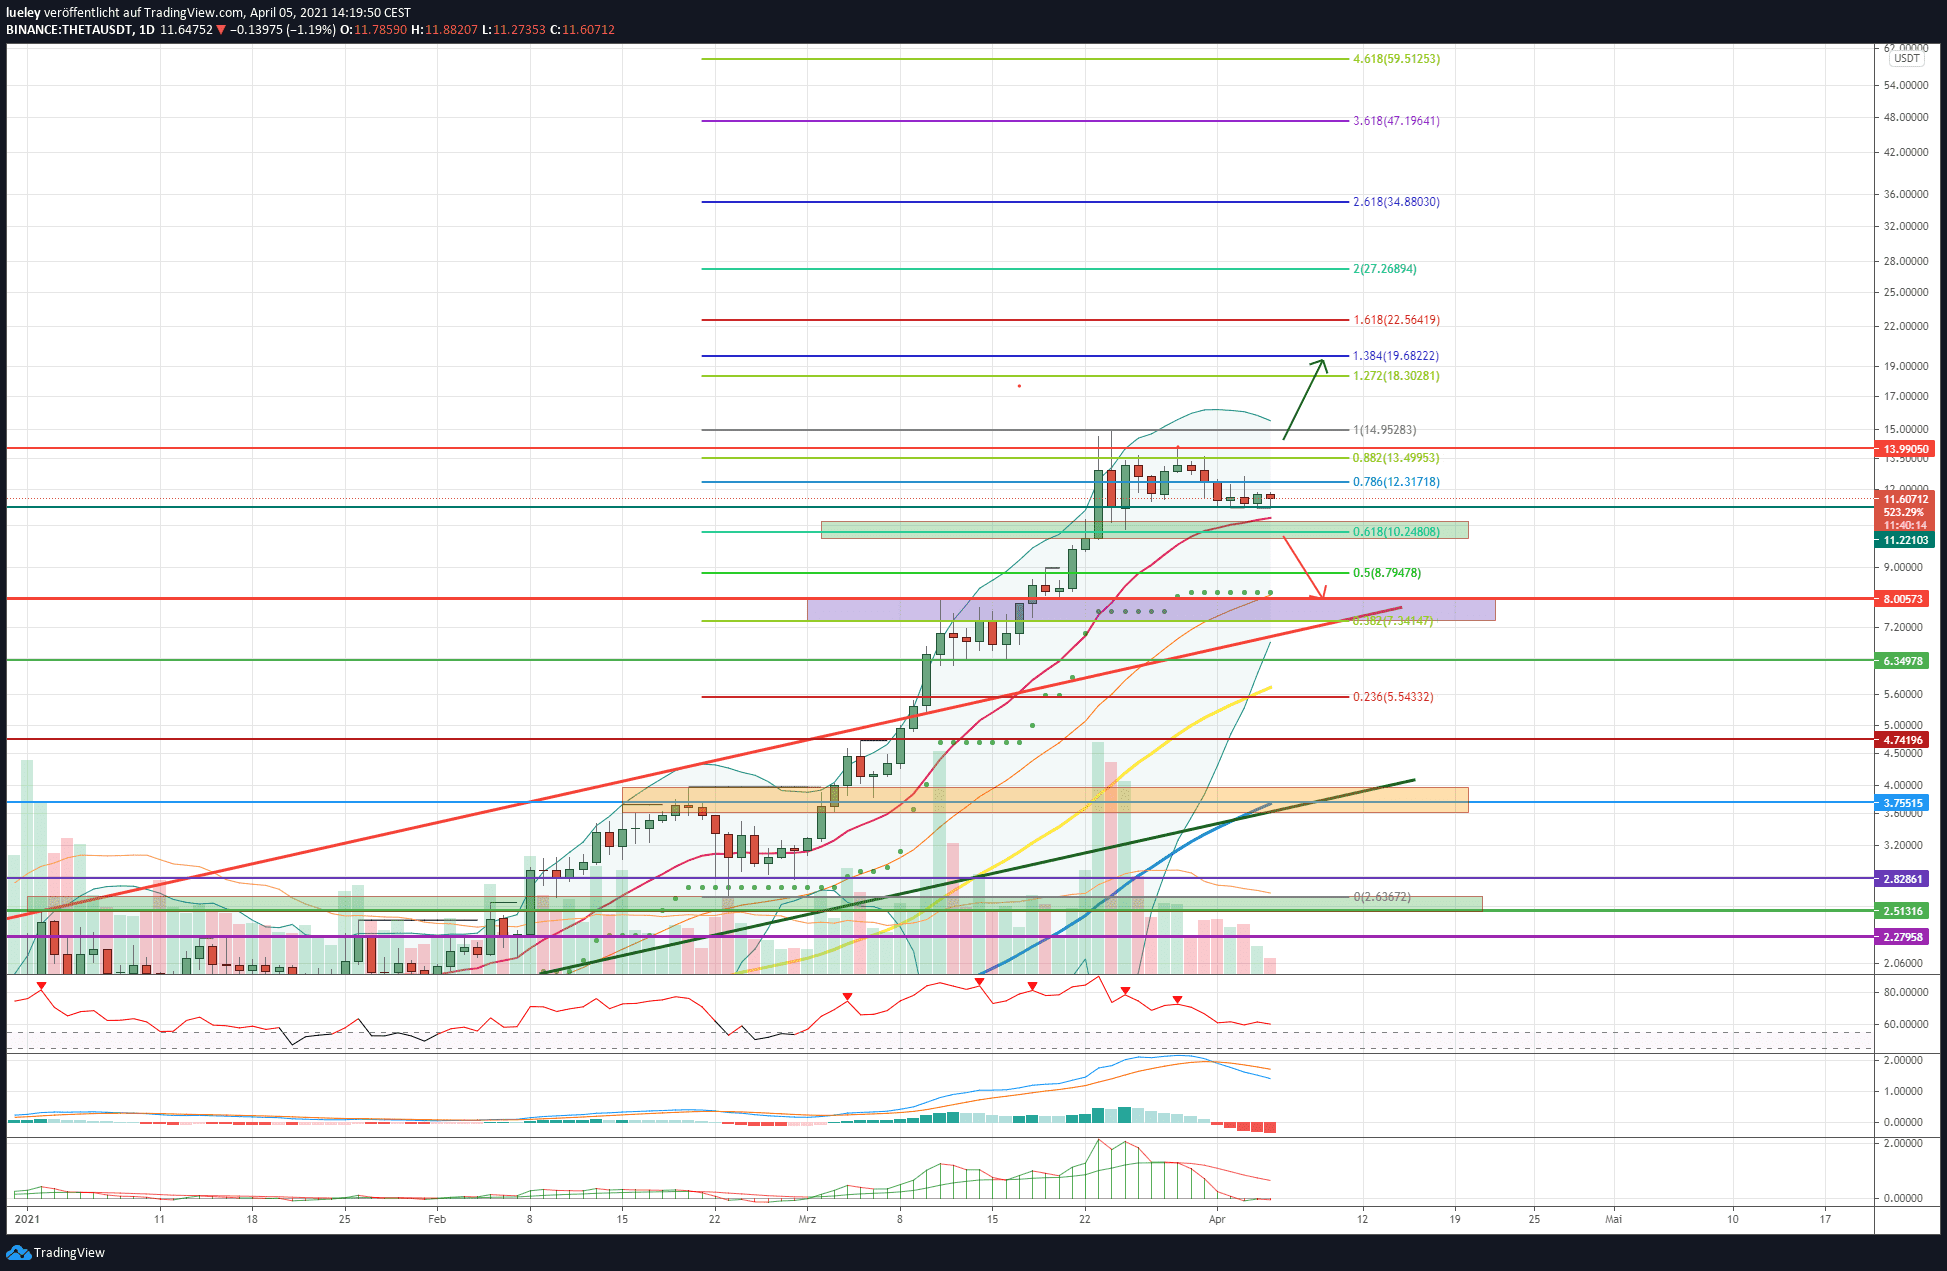
Price analysis based on the value pair Theta / USD on Binance
The THETA price failed to hit its all-time high of $ 14.95 again in the last few days of trading. The theta token failed several times on the 88th Fibonacci retracement at USD 13.49 and has since fallen back to a new weekly low at USD 11.22. THETA is currently trading just above this support level at USD 11.62. The positive news seems to be priced in for the time being.
Bullish variant (THETA)
If the THETA price can assert itself above the EMA20 (red) and also regain the 78 Fibonacci retracement at USD 12.31, another attack on the weekly high at USD 13.99 is conceivable. Only when the bulls manage to overcome this resistance level at the daily closing price, however, will the all-time high of USD 14.95 come back into focus. If THETA breaks through this resistance over the long term, the next target price will be activated at USD 18.30. This is where the 127 Fibonacci extension of the overall upward trend runs. If the bulls manage to overcome this resistance level in the coming weeks, a march through to the 138 Fibonacci extension at USD 19.68 should be planned.
In the medium term, reaching the 161 Fibonacci extension at USD 22.56 is also conceivable. In this area, however, increased profit-taking is to be expected. If the THETA rate can continue to develop positively in the coming months, an increase of up to USD 27.26 cannot be ruled out. For the second half of the year, if the price stabilizes above USD 27.26, the focus will initially be on USD 34.88 as the price target. Here you can find the 261 Fibonacci extension of the current price movement. The maximum price target for 2021 is still USD 47.19. The 361 Fibonacci extension can be found at this price mark.
Bearish variant (THETA)
If the THETA course cannot attack its all-time high again in the coming weeks, a relapse to the EMA20 (red) must be planned. This is currently just above the green support zone at USD 10.80. A price setback to the previous week’s low of USD 10.24 would also be considered. The 61 Fibonacci retracement also runs here. Should the bears manage to dynamically push the THETA rate below this mark and undercut USD 10.01, a setback of up to USD 8.18 should be planned. The supertrend and the EMA50 (orange) run at this support. If this strong support does not hold up either, the cross support consisting of the 38 Fibonacci retracement and the horizontal resistance line at USD 7.34 will move into the focus of investors.
In addition, the red upward trend line should also act as a support in this area. Only when the area around USD 7.34 is sustained will the low of USD 6.34 move into the focus of investors. A directional decision can be expected at this support mark. If the bears manage to break through this support dynamically, a fallback to USD 5.52 is conceivable. A significant fall below this support level increases the expansion of a correction up to 4.74 USD. The maximum bearish price target of between USD 3.96 and USD 3.60 will only come into focus when this price mark is also consistently undercut. In addition to the breakout level, the EMA200 (blue) and the green lower upward trend line are currently also running here.
Indicators (THETA): MACD with new sell signal
The RSI has been trending significantly south in the last few days and threatens to slide into the neutral zone between 45 and 55 in the near future. This would mean that the RSI would follow the MACD indicator, which has already generated a sell signal. On a weekly basis, both indicators continue to show buy signals, but are currently trending south, reducing their overbought status.
Top 10 stability
When looking at the top 10 altcoins, the picture is largely positive. After several bearish weeks, Polkadot (DOT) is rising by a respectable 32 percent northwards and is becoming the weekly winner. Ripple (XRP) with a 27 percent price premium and Ethereum (ETH) with a 21 percent price increase are also convincing. Only two top 10 Altcoins are losing value this week. The newcomer among the top 10 altcoins, the Theta Token (THETA), has lost around 10 percent of its value after a strong trading month in March and is thus the bottom of the ten largest cryptocurrencies. Cardano (ADA) is also tending to remain directionless and is losing out Weekly view almost 2 percentage points. The ranking of the top 10 altcoins shows two changes: Polkadot can move up to fourth place thanks to its strong weekly development and swaps places with Cardano. The newcomer THETA, on the other hand, loses two places in the ranking and has to let Litecoin (LTC) and Chainlink (LINK) pass again.
Winner and Loser of the Week
The market as a whole was largely positive in the past trading week. Around 60 percent of the top 100 altoins recorded a price increase on a weekly basis. As in the last few weeks, some cryptocurrencies were able to gain particularly strong in value. The in-house crypto currency WazirX (WRX) of the Indian crypto exchange of the same name rose by a breathtaking 1,080 percent northwards. The tendency that cryptocurrencies are currently very much in demand from trading exchanges is impressively confirmed. WINk (WIN) with a price increase of 490 percent and BitTorrent (BTT) with a price increase of 240 percent were also bullish. Holo (HOT) with 175 percent price gain and Tron (TRX) with 115 percent price increase are also convincing.
Overall, almost 50 percent of the top 100 altcoins show a double-digit increase in value. The list of weekly losers is headed by the outperformer of the last trading weeks Harmony (ONE) with a 25 percent price decline. After the meteoric rise of the past few weeks, investors are increasingly taking profits. ECOMI (OMI) with a 23 percent price discount and Decentraland (MANA) with a 16 percent price loss are also weak. Kusama (KSM) and Chiliz (CHZ) also show a price decline of 14 percent each.
Disclaimer: The price estimates presented on this page do not constitute buy or sell recommendations. They are only an assessment of the analyst.
The chart images were created using TradingView created.
USD / EUR exchange rate at the time of going to press: 0.85 euros.
BTC-ECHO Magazin (4/2021): Is it worth investing in NFTs?
The industry magazine for Bitcoin and blockchain investors.
Exclusive top topics for a successful investment:
• NFT: between hype and substance
• FLOW: The new NFT king?
• Taxing mining properly
• 2021 is so bullish
• An interview with the Bundestag
Order free copy >>