
According to the data analysis company CryptoQuant, an on-chain metric emits a buy signal for Bitcoin. This indicator had not signaled a similar buying opportunity since 2019. The index Profit and Loss (PnL) from CryptoQuant, constructed from three on-chain indicators relating to the profitability of the Bitcoin market, recently crossed back above its 365-day simple moving average (SMA) after a long period below.
The PnL index moved to the other side of its 365-day SMA in 2020 and 2021. It crossed its 365-day SMA after an extended period below, in 2019, a few months after the market bottomed. . CryptoQuant notes that in previous cycles, this crossover usually implied the start of a bullish cycle.
“There is always a chance that the index will fall back below,” CryptoQuant warned. But the bitcoin bulls will add this indicator to a growing list of technical indicators that herald the start of a reversal in the market.
Many on-chain indicators indicate that Bitcoin has bottomed out
A growing confluence of metrics (based on eight pricing models, network usage, market profitability and wealth distribution metrics) tracked by Glassnode suggest that Bitcoin could be in the early stages of a recovery.
And these are not the only indicators that signal the start of a bull market. According to analysis posted on Twitter by @GameofTrade_, 6 metrics including Accumulation Trend Score, Entity Adjusted Dormancy Flow, Reserve Risk, Realized Price, Z MVRV Score and Multiple de Puell demonstrate “a long-term generational buying opportunity”.
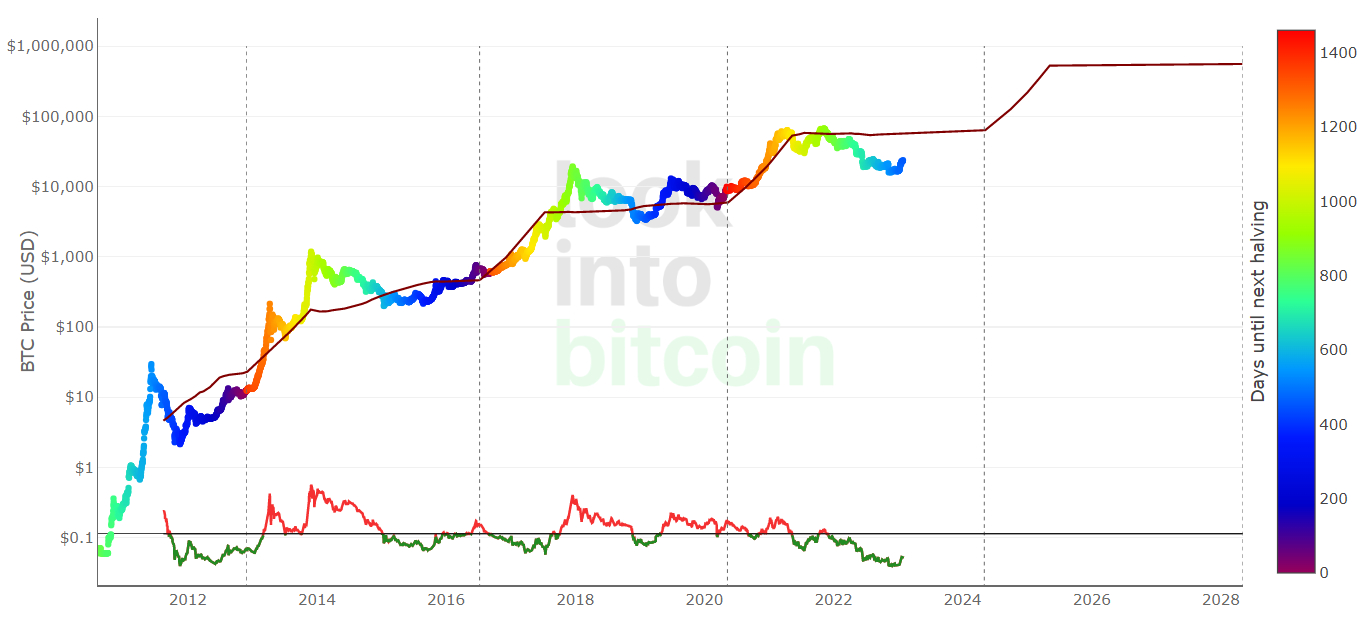
Separately, analysis of longer-term market cycles also suggests that the market’s top cryptocurrency by market capitalization could be in the early stages of a nearly three-year bull market. According to the analysis of the Twitter account @CryptoHornHairs, Bitcoin’s progress follows exactly the path of a market cycle of approximately four years, which has been perfectly respected for more than eight years.
A widely followed Bitcoin price prediction model derives similar assumptions. Depending on model Stock-to-Flowthe Bitcoin market cycle is approximately four years, with prices typically bottoming out near the middle of the four-year gap between “ halving (halvings)” – a four-year phenomenon that halves the reward for mining, thereby slowing the inflation rate of Bitcoin. Past price history suggests that Bitcoin’s next bull will come after the next halving in 2024.
Macro headwinds could push prices lower this week
All of the aforementioned indicators suggest that Bitcoin is currently an excellent long-term buy. It is important to emphasize the “long term” here. Indeed, macro headwinds continue to loom over the market.
Several macro strategists have noted that as the FED’s crucial policy announcement approaches this week, there is a significant risk that markets will underestimate the FED’s determination to 1) keep raising interest rates. interest and 2) keep them high for a while.
Money markets estimate that the FED will only apply a rate hike of around 50 basis points, the first to take place on Wednesday (taking rates to 4.50-4.75%) and the second in March (where rates will then peak at 4.75-5.0%).
Market forecasts appear realistic, inflation in the United States is falling rapidly and should soon fall back to the 2.0% target set by the FED, while several leading economic indicators signal the likelihood that the economy will enter a recession. later this year. The market view seems to be that the Fed will want to ease policy to support growth.
And if market expectations are right, then the FED could easing later in the year. But recent comments from Fed officials indicate otherwise. The “transitional” inflation debacle of 2021 has severely damaged central bank credibility, and the Fed wants to continue to signal its intention to take a tough stance on inflation.
Jerome Powell could well signal that the bank intends to go ahead with a rate hike of more than another 50 basis points, which would rattle markets, especially risky assets, in the short term. The January momentum gained by Bitcoin could run out of steam on the first day of February in this case.
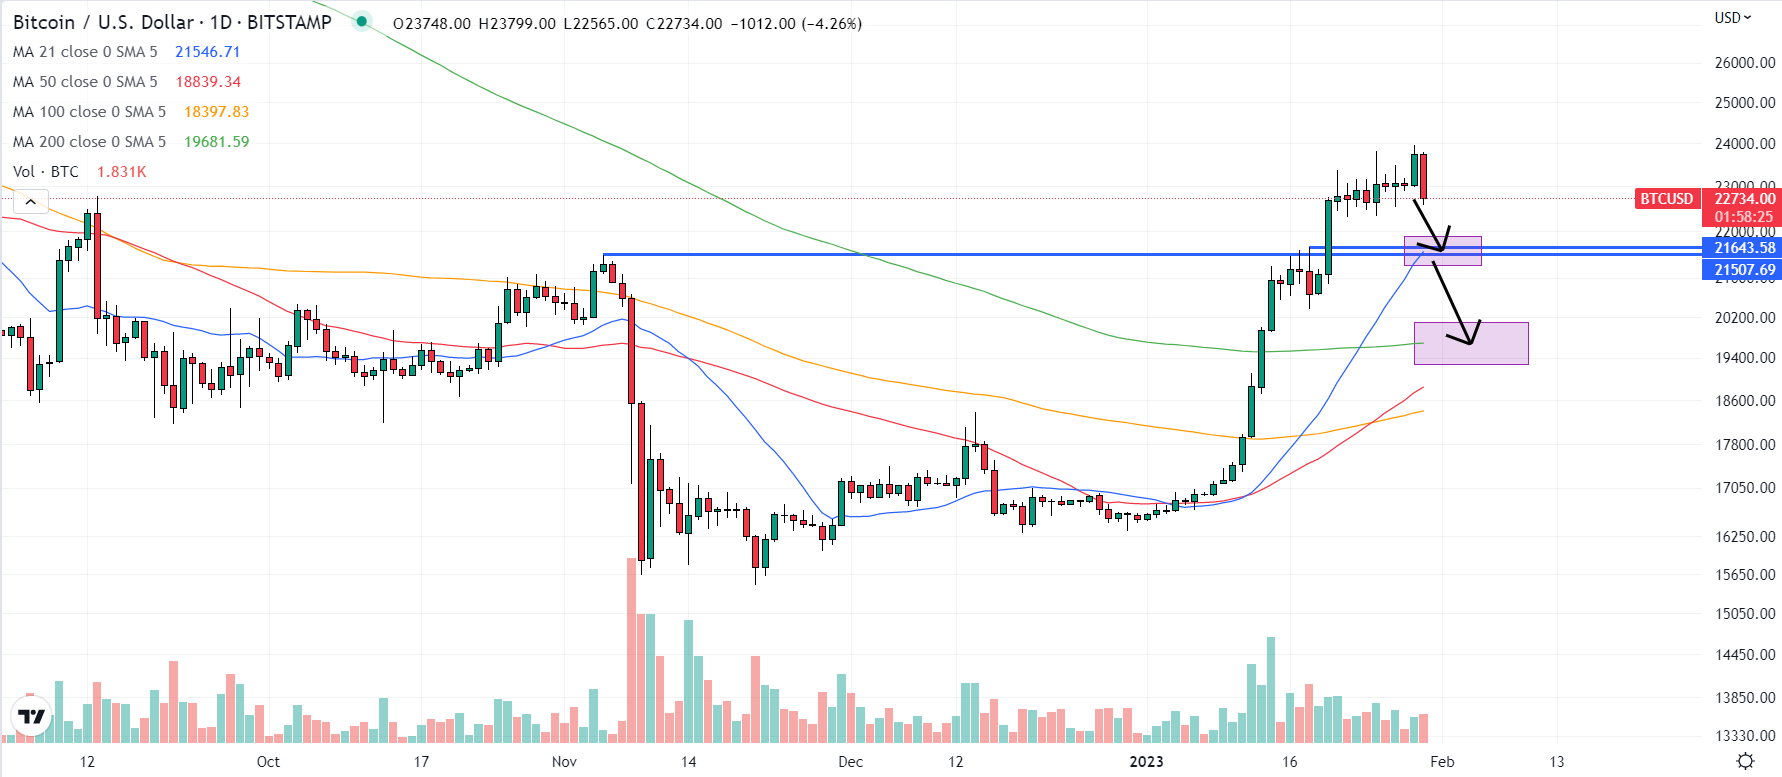
Technical analysts have signaled a lack of major support levels ahead of the $21,500 area, which could easily be retested in such a scenario. A retest of $20,000, the 200-day moving average and the realized price just below should also not be ruled out. What would be most interesting would be how Bitcoin will react at such a high. Given all of the above indicators signaling that the bear market is over, many buyers might once again be eager to get their hands on Bitcoin at $20,000.
Follow our affiliate links:
- To buy cryptocurrencies in the SEPA Zone, Europe and French citizensvisit Coinhouse
- To buy cryptocurrency in Canada visit bitbuy
- To secure or store your cryptocurrenciesget a Ledger wallet
- To trade your cryptos anonymouslyinstall the NordVPN app
To accumulate coins while playing:
- In poker on the CoinPoker gaming platform
- To a global fantasy football on the Sorare platform
Stay informed through our social networks: