
Bitcoin (BTC) is giving the lie to its critics this week. Not only a new high can be formed in the last hours of trading, the dominance of the crypto key currency is also making an impressive return. Is that the starting signal for the expected autumn rally?
Bitcoin (BTC): The buyer camp prevails
BTC course: 54,449 USD (previous week: 42,108 USD)
Resistance / goals: $ 53,005, $ 54,077, $ 55,817, $ 57,998, $ 59,470, $ 61,771, $ 64,896, $ 67,416, $ 69,660, $ 70,856, $ 76,472, $ 77,678, $ 85,563, $ 87,090, $ 89,982
Supports: $ 51,307, $ 50,325, $ 49,555, $ 48,222, $ 47,070, $ 46,040, $ 44,147, $ 42,855, $ 40,585, $ 39,240, $ 38,537, $ 37,458, $ 36,643, $ 34,899, $ 33,335, $ 32,718, $ 31,603 , $ 31,010, $ 30,000, $ 29,300, $ 28,795
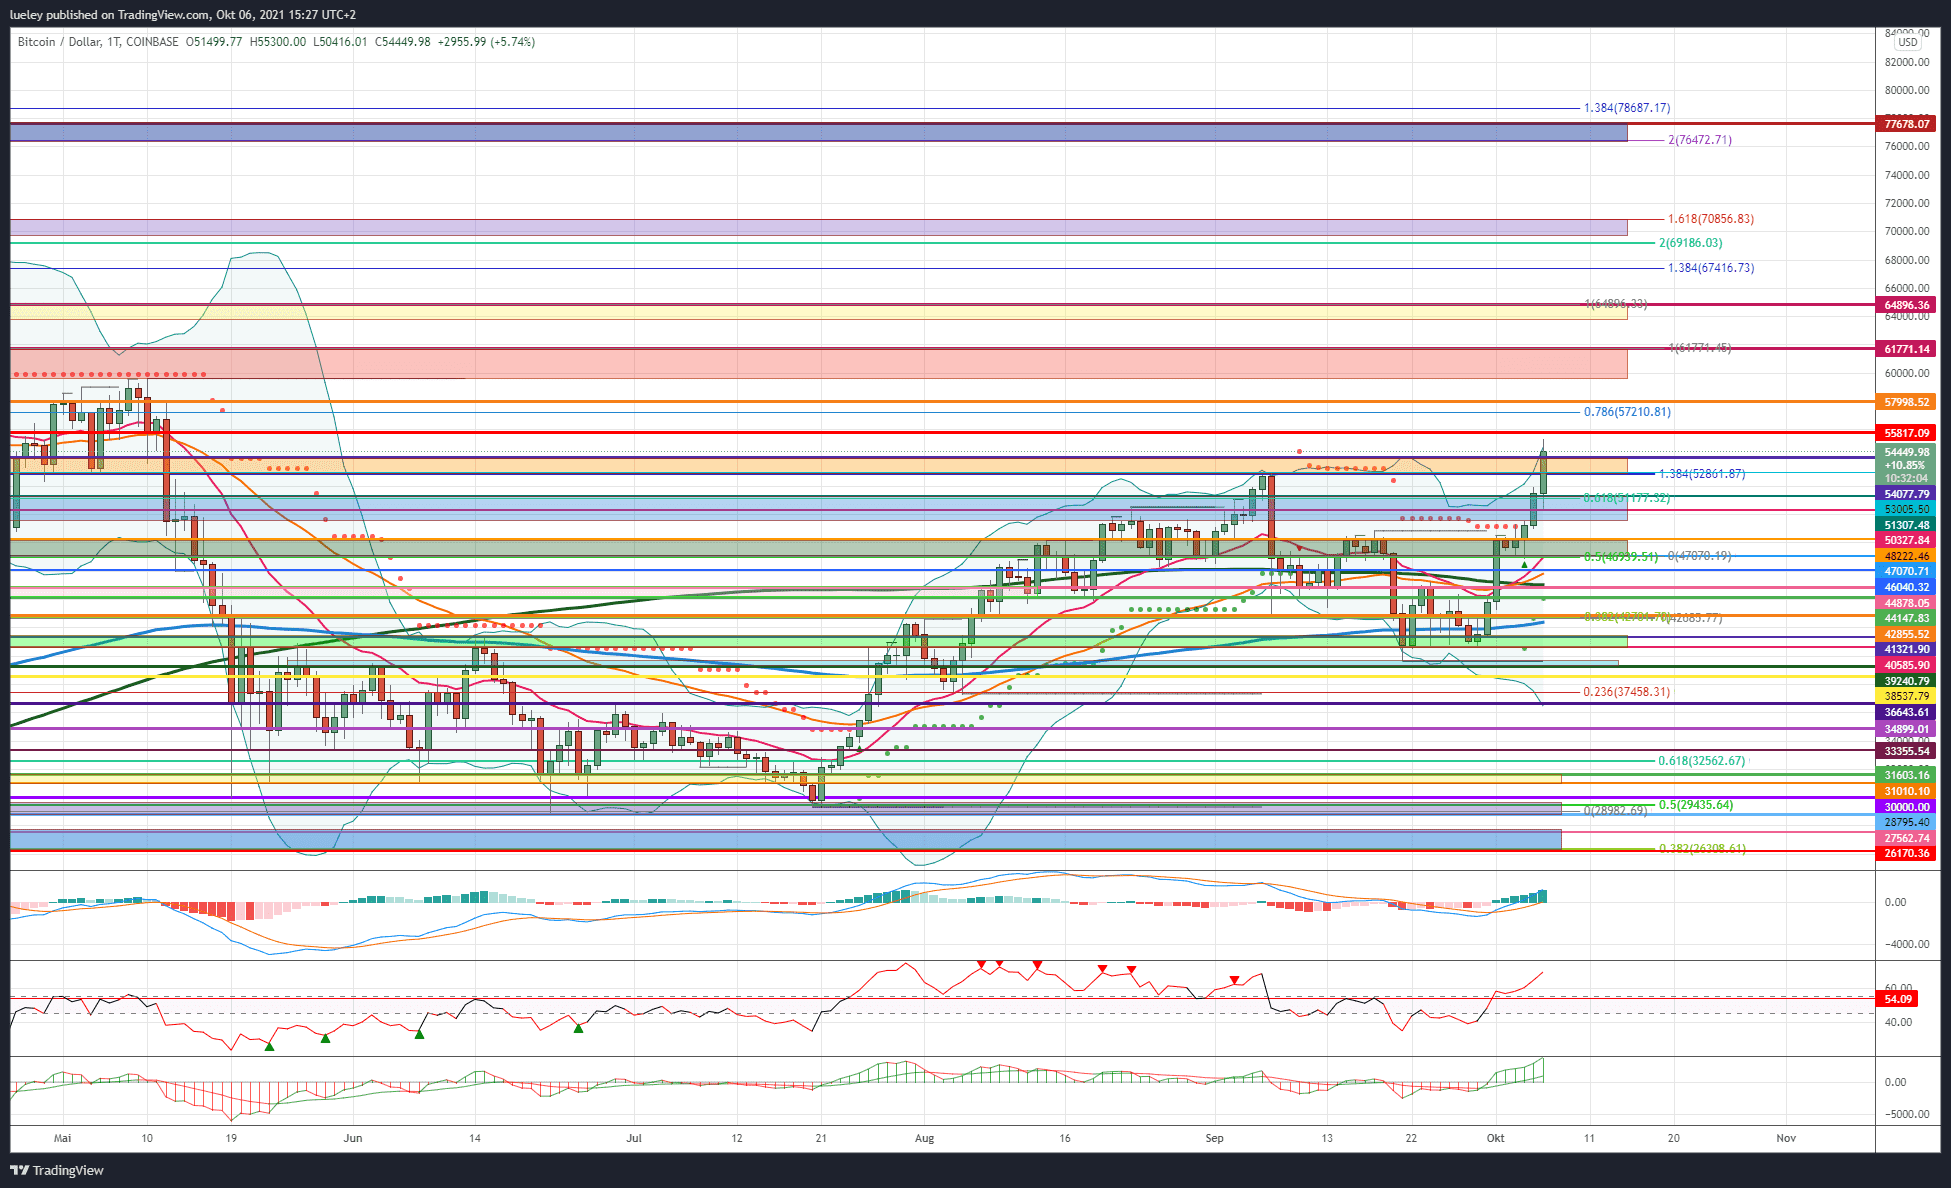
Bitcoin is back with a bang and has overcome several relevant levels of resistance in the last seven days of trading. In particular, the dynamic breakout back above USD 48,222 can, as described last, attract further buyers into the market. As a result, the bulls managed to lift Bitcoin back above the psychological mark of USD 50,000 to currently USD 54,449. The high of September 7th is now within reach. Here the further course direction of Bitcoin for the coming trading weeks is decided.
Bullish scenario (Bitcoin price)
Bitcoin’s price movement is currently very bullish. The aim of the buyers’ camp must now be to stabilize the BTC rate above USD 48,222, or even better above USD 49,555. In the short term, the bulls will do whatever it takes to break past history high at USD 52,861 and break resistance at 53,005. If there is no significant setback below USD 50,325, there is initially an increase potential up to USD 54,077. If Bitcoin subsequently breaks through the orange resistance area, the next relevant price target is activated at USD 55,817. The bears will want to counter this again, because an outbreak should give the crypto reserve currency a further boost towards USD 57,998. This is the last strong resistance level on the way towards USD 60,000.
If the rally continues to gain momentum and Bitcoin subsequently also overcomes the resistance at USD 61,771, a break through to the all-time high is very likely. Only stabilization above USD 64,896, the current all-time high, activates the next relevant price target in the form of the 138 Fibonacci extension at USD 67,416. Investors should pay particular attention to the zone between $ 69,660 and $ 70,856. At USD 70,856, the 161 Fibonacci extension is the overriding upward movement from the first half of this year. The relevant maximum price targets for the coming months have not changed at the moment. The target range for this upward move is found between $ 76,472 and $ 77,678. However, should the market continue to move dynamically northwards, as many players have hoped, an increase in the range between USD 87,090 and USD 89,982 cannot be ruled out.
The strong price movements could also be due to a Bitcoin whale, among other things. According to Cryptoquant, an unknown wholesaler bought 31,200 BTC for the equivalent of 1.6 billion USD.
Baerishes scenario (Bitcoin price)
The bears missed their chance to cap the Bitcoin price below USD 48,222. As a result, Bitcoin was able to gain significantly in value and is currently on the verge of breaking the high of September 7th. The last chance for the seller’s warehouse now lies in a false breakout on the upper side. For this, the BTC rate has to fall dynamically below today’s low of USD 50,327. And also go below the 49,555 USD. If this endeavor succeeds, the key brand of USD 48,222 will come into focus again. Here the bulls will do everything in their power to stabilize the Bitcoin rate. However, if Bitcoin falls permanently below this support, the first price target is USD 47,070. The EMA20 (red) is currently also running here. Below this price mark there is a whole bundle of support in the range between USD 46,040 and USD 44,247.
A setback below that seems very unlikely at the moment. However, if BTC dynamically slips below this range, it could target USD 42,855 and even USD 40,585. A drop below USD 40,585 would have a signaling effect and activate further downside potential to at least USD 39,240. A target of USD 38,537 is then also conceivable. If there is no countermovement and BTC slips back below USD 38,537, a correction expansion up to the 23rd Fibonacci retracement at 37,321 should be planned. The maximum bearish price target is now USD 36,643. There is no more downside potential, at least in the short term.
Bitcoin dominance: new 30-day high reached
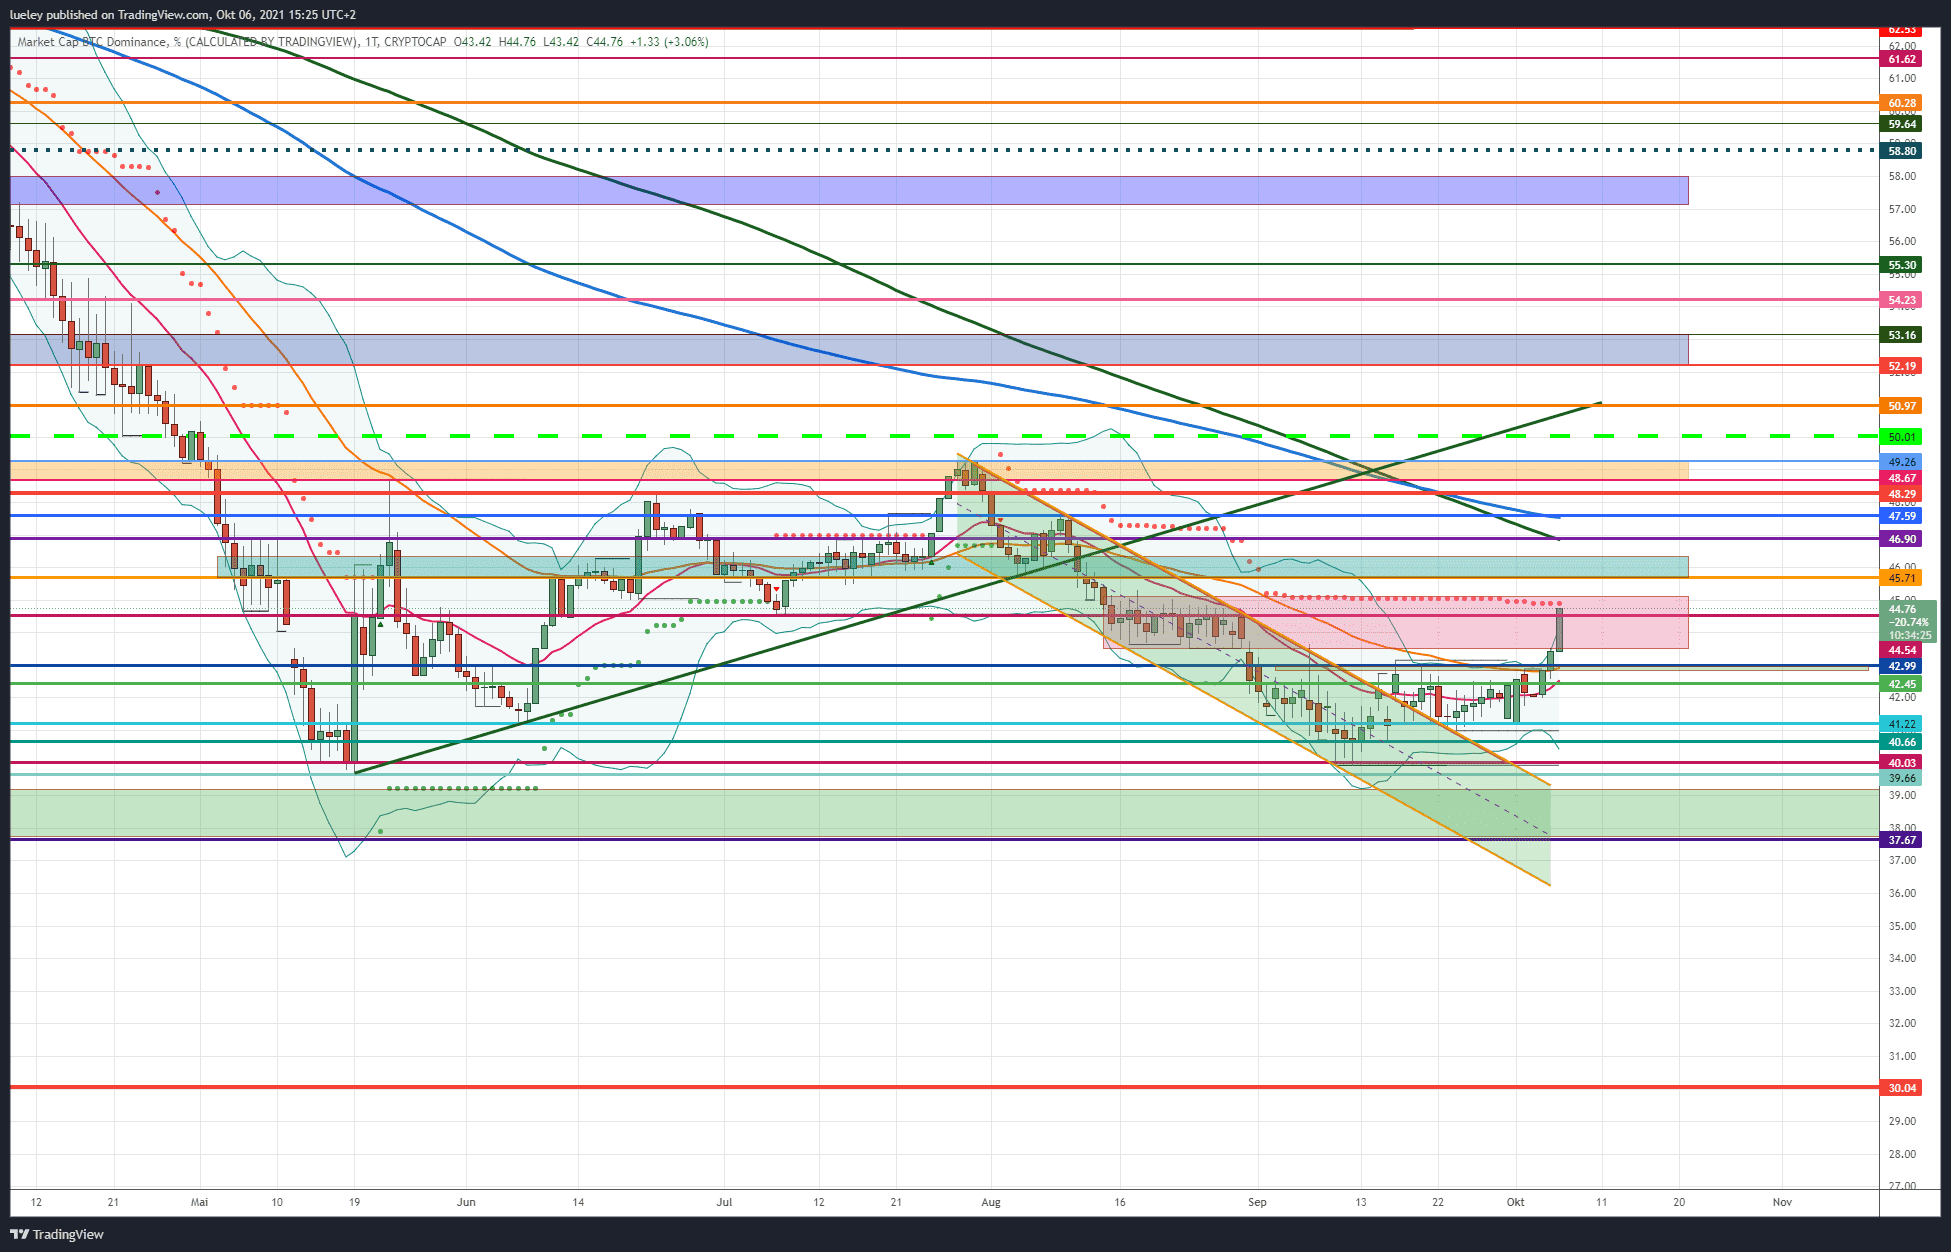
Bitcoin dominance is still on the rise. The important support at 41.22 percent could again be defended and represented the low of the last seven days. On Tuesday, September 5th, the dominance was able to overcome the resistance from the old high and EMA50 (orange) and also the resist Leave 43.05 percent behind. Bitcoin dominance is currently trading at 44.76 percent, already above the important resistance level at 44.54 percentage points.
BTC Dominance: Bullish Scenario
As already suspected in the previous week’s analysis, the Bitcoin dominance seems to have developed its bottom for the time being. The increase of more than seven percentage points, starting from the weekly low, is currently also reflected in an outperformance of the crypto reserve currency against many altcoins. If the BTC dominance can now stabilize above the 42.99 percent, a breakout above the 44.54 percentage points would be desirable as a result. Only when this resistance level is broken by the end of the day should a subsequent increase up to the top of the red box be planned. In the area between 45.00 percentage points (supertrend) and 45.10 percent it is decided whether the market power of Bitcoin can finally complete a turnaround towards MA200 (green) at 46.90 percent. On the way to this strong sliding resistance, however, the BTC dominance must first break through resistances at 45.71 percent and 46.33 percent.
In particular, the recapture of 46.33 percent brightens the chart image further. If it is also possible to break through the MA200, the price should continue to gain momentum and target the EMA200 (blue) at 47.59 percent. In this area at the latest, a setback towards 46.90 percent should be planned. If the BTC dominance breaks out above this sliding resistance in the coming trading weeks, the zone moves into focus by 48.29 percent. If there is no sustainable trend reversal here either, a march through to the orange resistance zone is conceivable. As mentioned several times, the zone between 48.67 percent and 49.26 percent represents a strong resistance area. If this is overcome, Bitcoin dominance could target the psychological mark of 50 percent and even towards 50.97 percent in the coming months increase. This course level is currently to be seen as the maximum target.
BTC Dominance: Baerish Scenario
As long as the zone is not recaptured by 45 percent, it is still possible to retest the area by 42.99 percent. If the BTC dominance falls below this support, contrary to expectations, follow-up charges up to the EMA20 (red) can be expected. This sliding support line is currently at 42.45 percent. If this chart mark is also abandoned, the correction extends again to last week’s low at 41.22 percent. Here it is decided whether the BTC dominance will correct again towards 40.66 percent. If both supports are consistently undershot, the psychological 40 percent mark and the annual low of 39.66 percent come into focus as target marks.
A fall back below the annual low would have far-reaching consequences. The altcoins should continue to gain strength and make life increasingly difficult for the crypto reserve currency. As a result, the BTC dominance should correct into the green support zone between 39.21 percent and 37.67 percent. If the 37.67 percent per day’s closing price is then given up, a steady decline in the market dominance of Bitcoin is likely in the long term. Even a relapse to the psychological mark of 30 percent can then no longer be ruled out.
Disclaimer: The price estimates presented on this page do not constitute buy or sell recommendations. They are only an assessment of the analyst.
The chart images were created using TradingView created.
USD / EUR exchange rate at the time of going to press: 0.85 euros.