After a great bullish week for the cryptocurrency market, Bitcoin (BTC) and Ether (ETH) are regaining interesting levels and are preparing to retest significant resistance. Will cryptocurrencies finally validate a short-term market reversal, or are we close to another rejection?
Bitcoin is trying to break through its midrange
This week the bitcoin price (BTC) finally started to rise again with the price now moving above $20,000.
If this rebound is encouraging, it is still necessary to remain vigilant on these levels which do not yet validate a trend reversal. Clearly, BTC price remains flat inside a multi-month consolidation and amid crises.
If we want to review cryptocurrencies in a real bullish momentum, we will already have to see a return of substantial buying and selling volumes which would allow the price to go up to the upper part of the range.
Figure 1 – Bitcoin Daily price chart
As we have already pointed out in previous analyses, the market maintains a bearish structure with lower and lower tops, inside a long-standing downtrend. To get a change in structure and be able to look for nice bullish setups, we would have to see the price of Bitcoin go back above $22,500.. This zone corresponds to the last local high point and would coincide with a return to the upper part of the range with the cloud which would become support.
In the meantime, the objectives remain at $16,130 (Ascending Wedge), then $14,400 (Bearing Flag). In this context, a retest of 21,600/$22,000 remains likely, but a major rejection could be generated due to the top of the cloud which is providing resistance to the price.

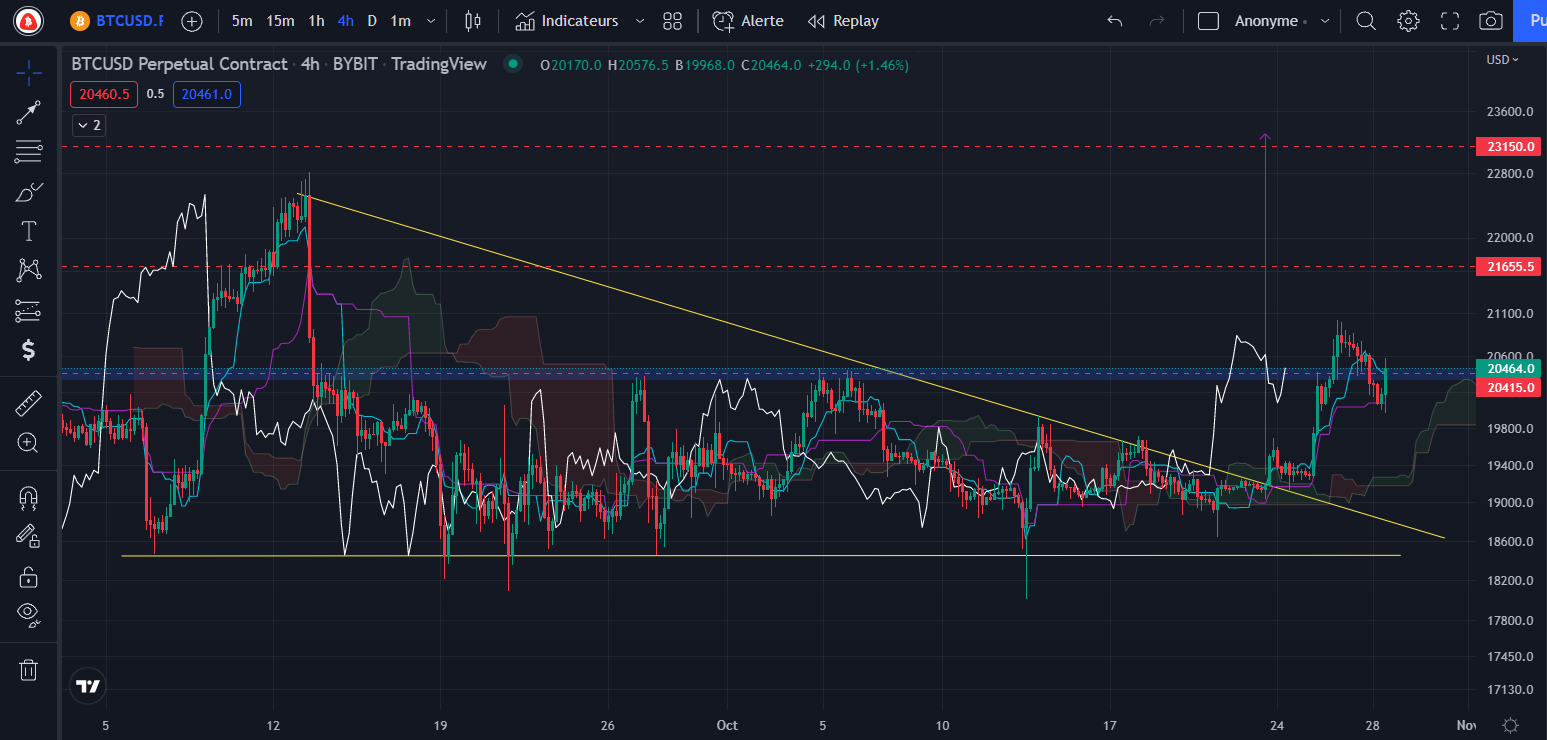
Figure 2 – Bitcoin h4 price chart
On the H4 timeframe, a short-term target was activated at the $23,150 level following the breakout of the triangle from above. The problem remains the presence of two notable resistances on the way : the Tenkan Weekly at $20,415 then another flat Tenkan Weekly at $21,655 (both in red on this graph).
This Ichimoku curve, like the Kijun, represents important resistances that should not be overlooked, and therefore a risk here for the price to be rejected. Despite this bullish breakout, it is therefore advisable to be vigilant and to consider a very probable rejection of the price around $21,655 if he manages to break the first resistance Weekly.
? Find our selection of the best sites to buy Bitcoin
Access our group made up of Vincent Gane and our fundamental and on-chain analysis experts on the Toaster. Our experts provide you daily with exclusive information and analyzes on the crypto market to optimize your knowledge!
Join Experts and a Premium Community
PRO
Invest in your crypto knowledge for the next bullrun

Ether (ETH) ready to head back towards $2,000?
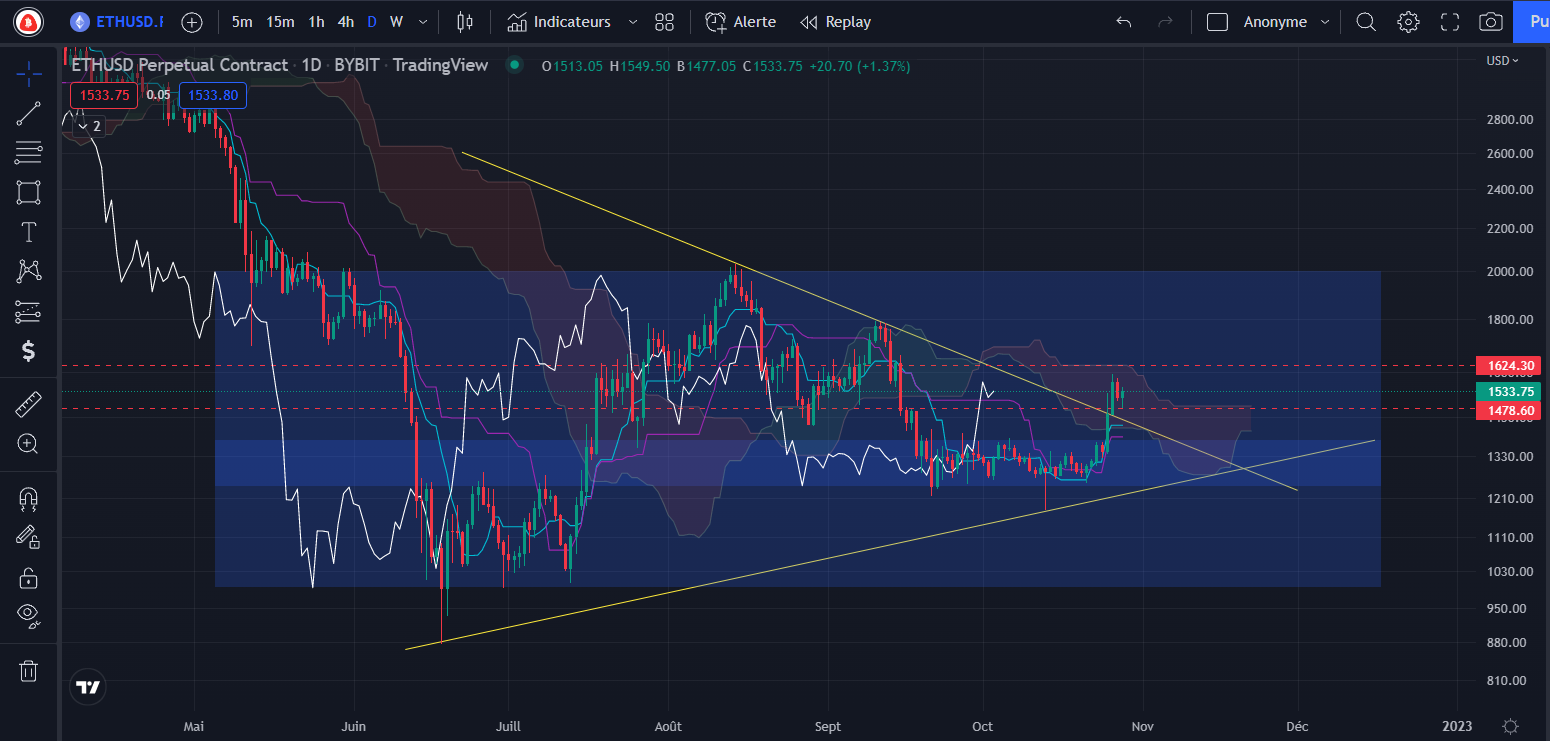
the course of ether (ETH) managed to touch our determined bullish target last week and is now showing another triangle breakout this time in Daily.
This triangle sits right in the range and could help ETH reach the top of its range at $2,000. But before that, it will obviously also be necessary to break the Tenkan Weekly resistance from above at $1,625 (also corresponding to the top of the cloud, which is currently acting as resistance).

Figure 3 – Ether price chart (Daily)
If the price breaks this resistance, then ETH should rally back to the top of the range at $2,000 as the Tenkan Weekly will provide support. On the other hand, in the event that the crypto were to face a rejection, there would be a good chance of finally going for the bottom of the range this time around at $1,000.
The No. 1 exchange in the world – Regulated in France
Binance
-10% off fees with code SVULQ98B ?

Conclusion of this technical analysis
Bitcoin and Ether show first signs of a return to bullish momentumbut remain under significant weekly resistance.
The breakout of the latter would validate structural reversals and would therefore offer good prospects for the future. As long as prices remain under resistance with ever lower tops, then the risk of falling will remain high.
? Find our explanatory guide to buy Ethereum
Chart sources: Trading View
Newsletter ?
Receive a summary of crypto news every Monday by email ?
What you need to know about affiliate links. This page presents assets, products or services relating to investments. Some links in this article are affiliated. This means that if you buy a product or register on a site from this article, our partner pays us a commission. This allows us to continue to offer you original and useful content. There is no impact on you and you can even get a bonus by using our links.
Investments in cryptocurrencies are risky. Cryptoast is not responsible for the quality of the products or services presented on this page and could not be held responsible, directly or indirectly, for any damage or loss caused following the use of a good or service highlighted in this article. Investments related to crypto-assets are risky by nature, readers should do their own research before taking any action and only invest within the limits of their financial capabilities. This article does not constitute investment advice.

