
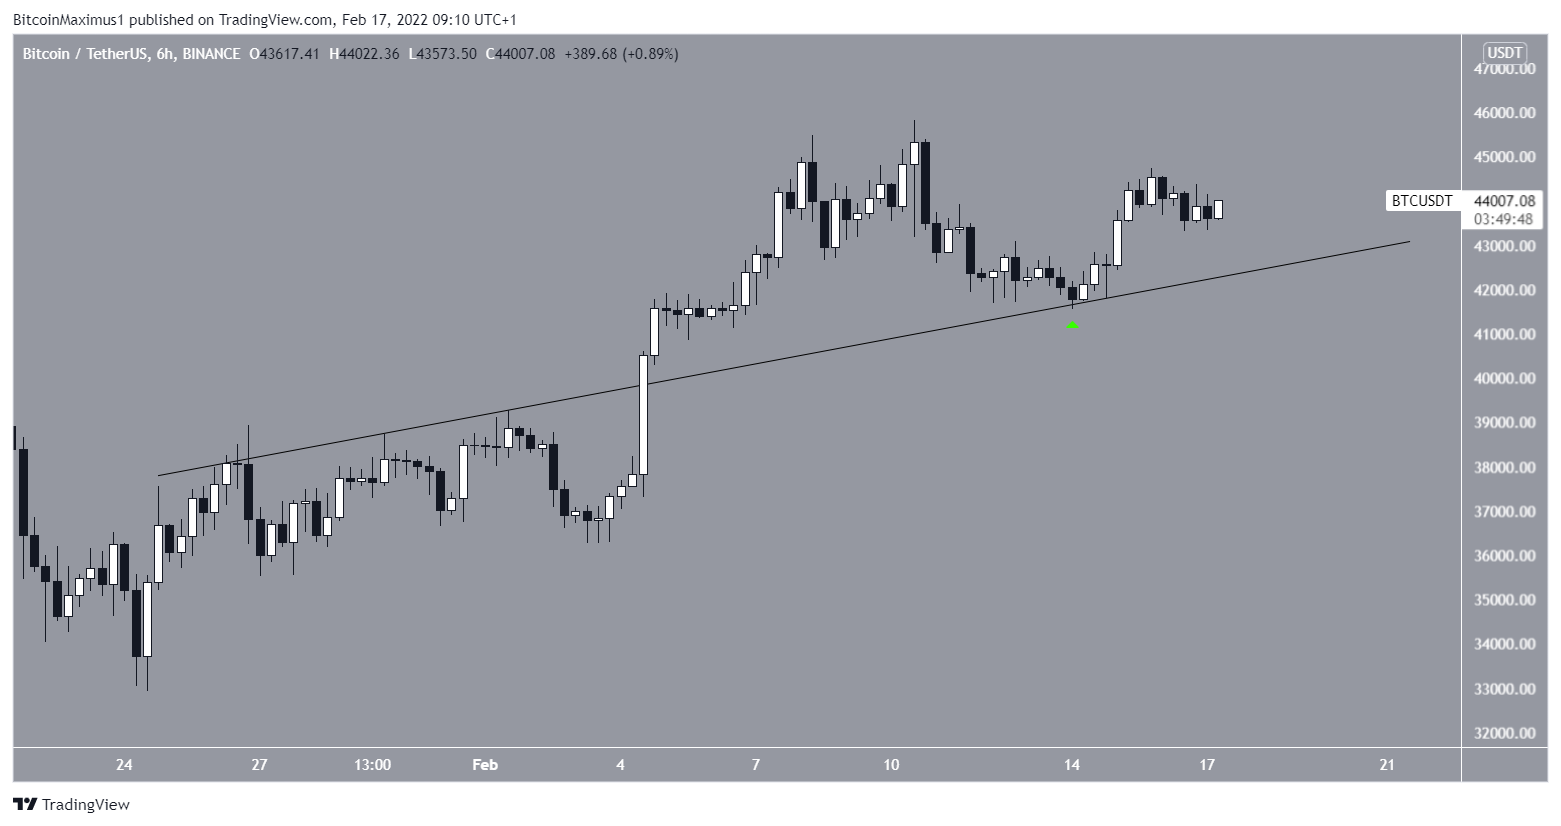
Bitcoin (BTC) might be on the verge of making another attempt to break above the resistance located at $44,300.
On February 16, BTC closed the day at $44,583, just above the $44,300 horizontal resistance zone, before falling slightly the following day. Despite this decline, the technical indicators remain bullish, as the RSI and MACD are both up. The MACD has created several successive upper bars while the RSI is above 50. Both of these are signs of an uptrend.
In the event of a breakout in Bitcoin price, the next resistance will be at $51,140.
A breakthrough attempt
The six-hour chart shows that BTC broke above an ascending resistance line on February 4. It then returned to validate this line as support on February 14 (green arrow) and the price has since mainly increased.
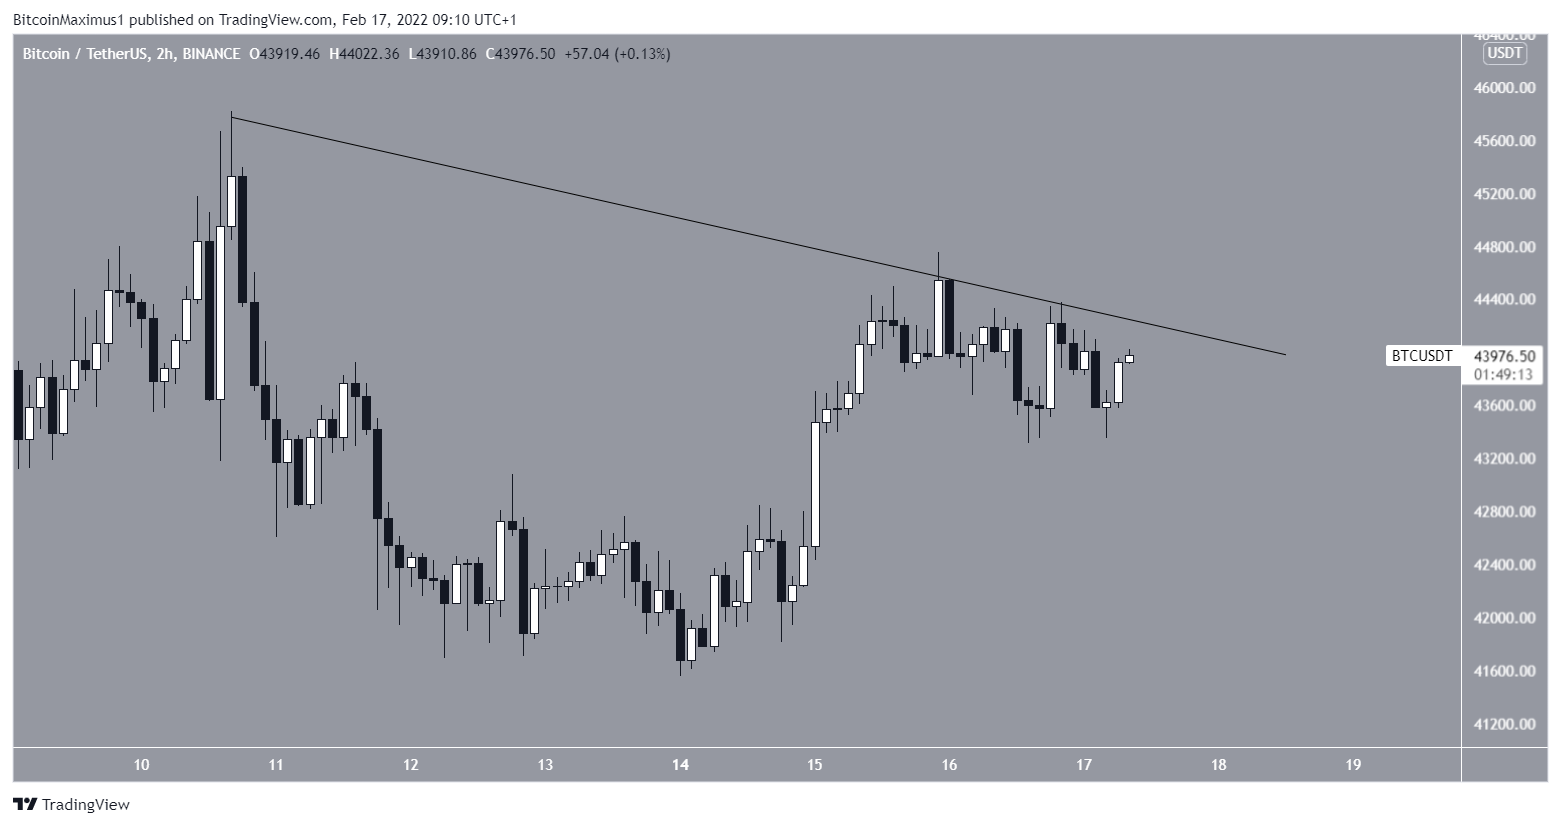
The two-hour chart shows that BTC is still trending below a short-term descending resistance line, and one that has been validated on several occasions so far. A price move above this resistance would also result in a move above the aforementioned horizontal resistance.
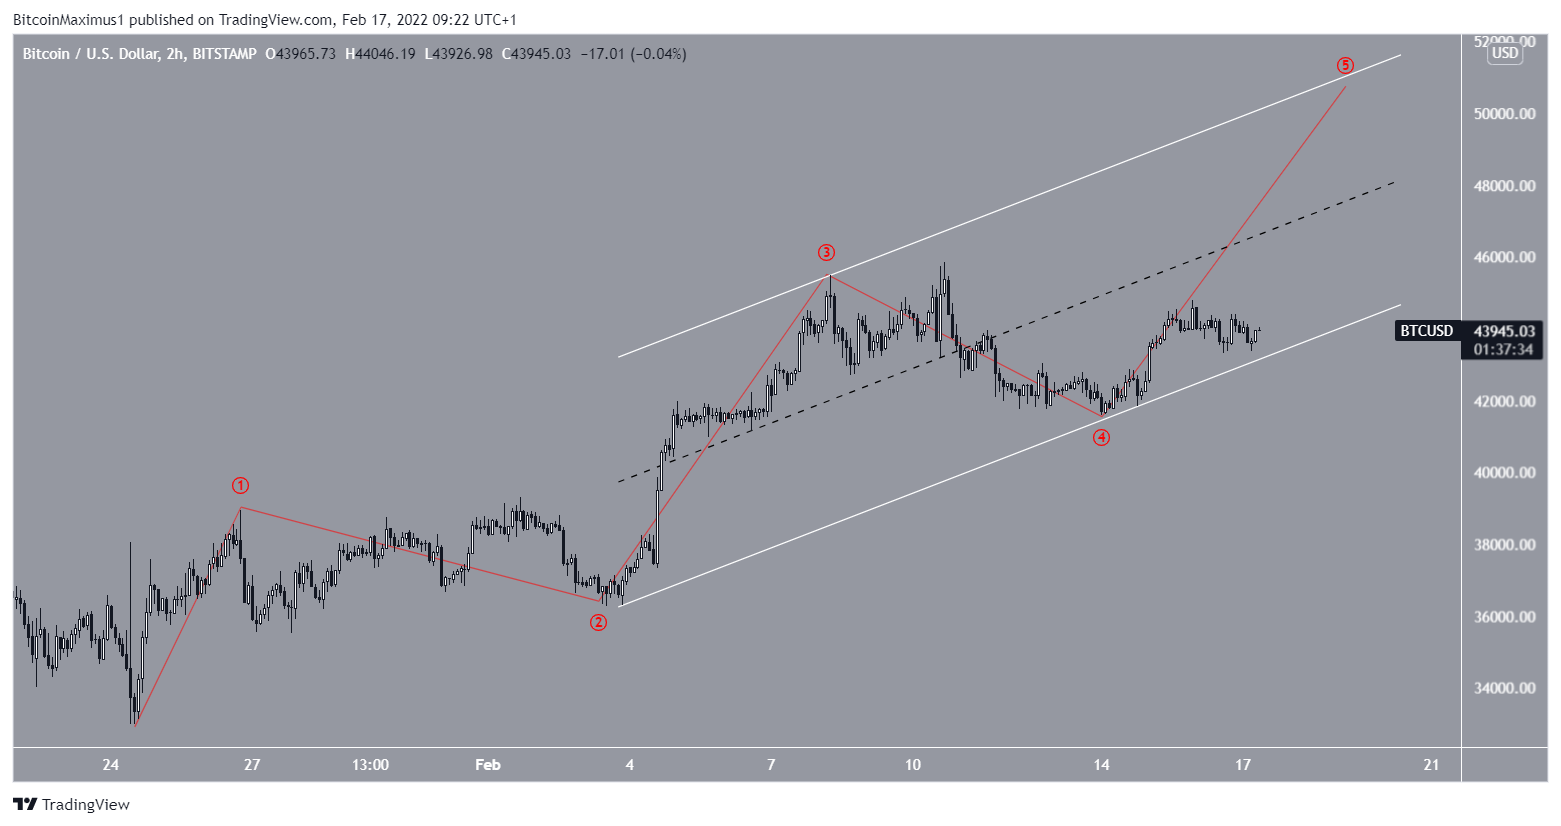
Bitcoin Wave Count Analysis
The wave count suggests that BTC is in the fifth wave of a five-wave ascending pattern (in red), which began on January 24. Knowing that neither the first nor the third wave extended, it would make sense for the fifth wave to extend.
A drop in Bitcoin below $43,000 would challenge this wave count, as it would cause it to break below the wave 2-4 trendline (in white). The resistance line for this trending channel is currently found at $51,000, which coincides with the aforementioned horizontal resistance zone.
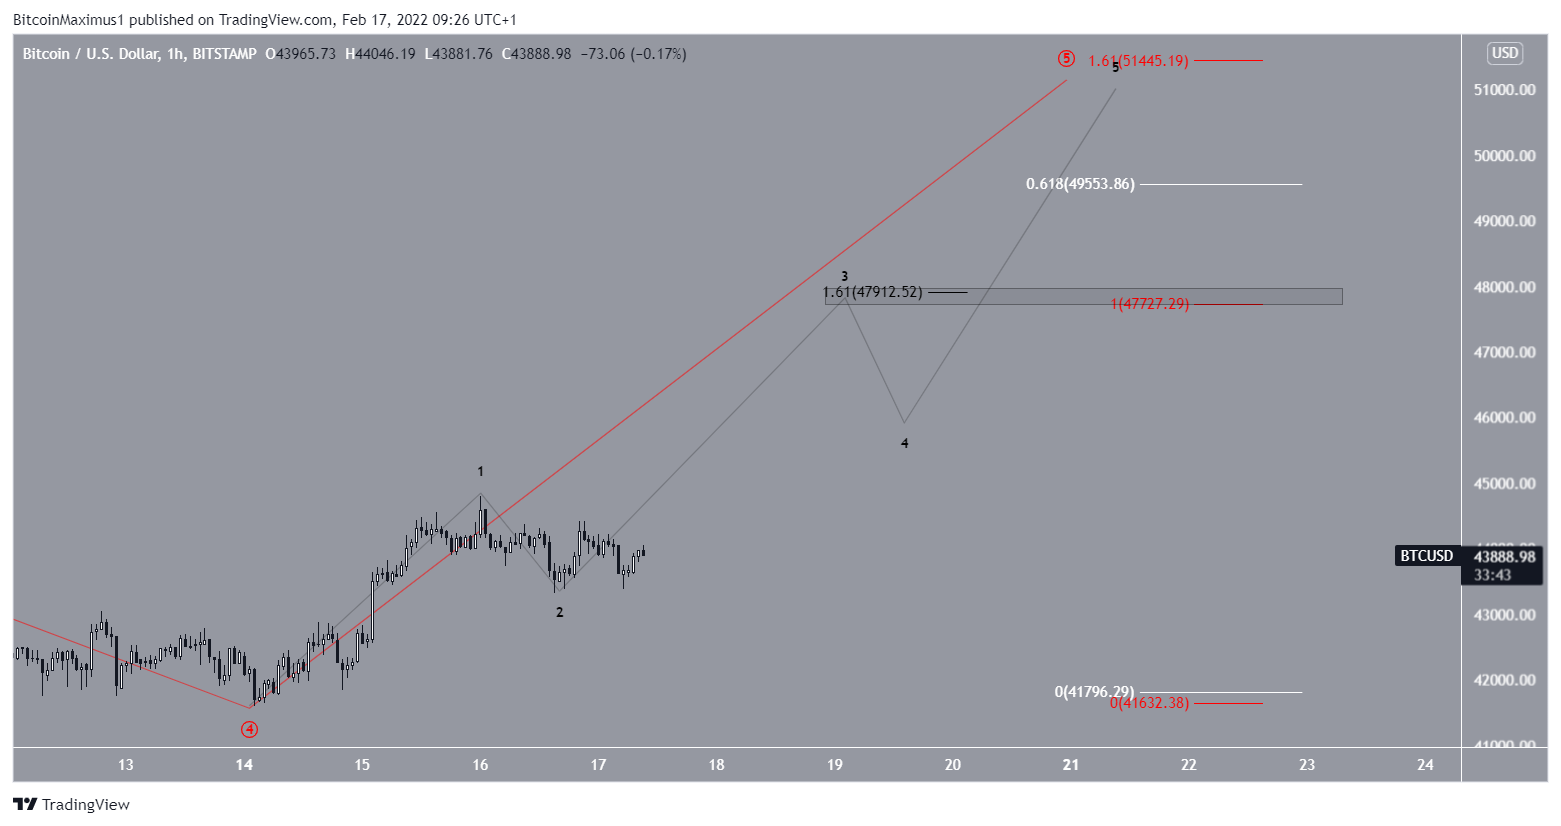
The 1-hour chart shows that BTC has completed sub-waves 1 and 2 of this same bullish move (in black).
There are several objectives for the possible final level of this structure.
The first target is between $47,700 and $47,900. This range is created by an outer retracement on the fourth wave (in black), which would give waves one and five a ratio of 1:1.
However, since wave five is most likely to extend, targets located at $49,553 and $51,445 would make more sense.
This last target, which would give waves one and five a ratio of 1:1.61, would also present a confluence with horizontal and diagonal resistance levels.
Disclaimer
All information on our website is published in good faith and for general information purposes only. Any action taken by the reader based on information found on our website is entirely at their own risk.