
Bitcoin (BTC) has been rising since its local low of $33,000 hit on January 24. It is now approaching its first significant Fibonacci resistance as well as horizontal.
Bitcoin has been trading inside an ascending parallel channel since April 2021. On January 24, 2022, it hit a low of $32,917 and then rebounded. This helped validate the channel’s support line and BTC has since gained 13%.
The main resistance zone is found at $40,800. This is an area that previously acted as support until BTC broke below it on January 21. Thus, this area is now expected to put up resistance.
Bitcoin’s Current Bounce
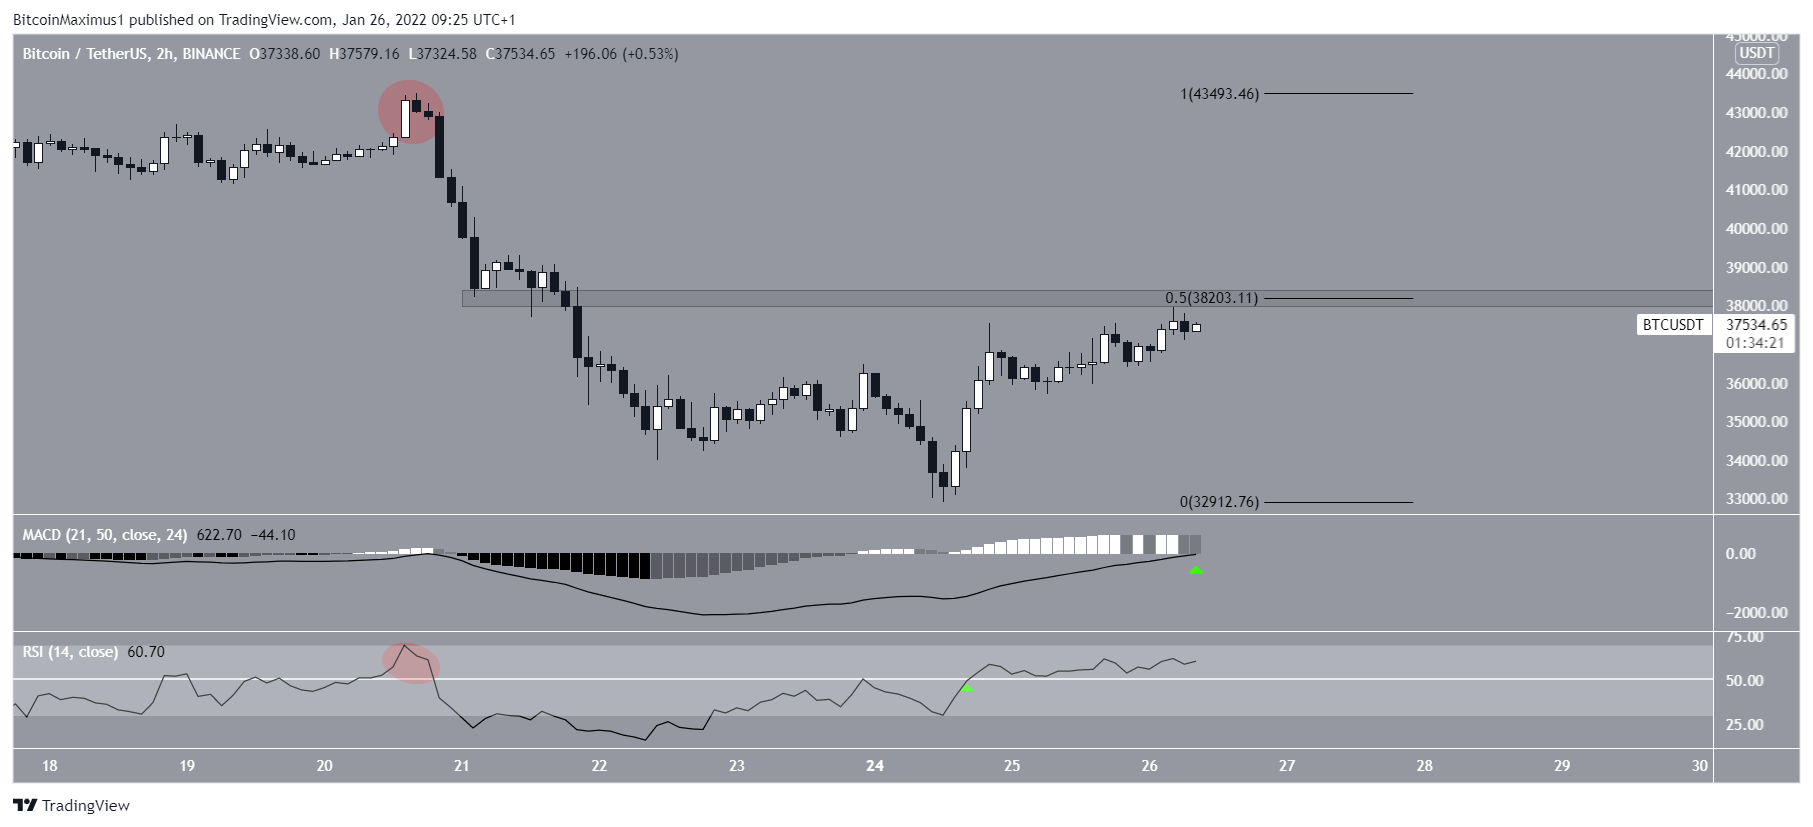
The two-hour chart shows BTC approaching resistance at $38,200. This is both the resistance level of the 0.5 Fib retracement and a horizontal resistance zone. A break in price above this level would be a crucial development to create a bullish structure.
Technical indicators are also showing bullish signals. The RSI, a momentum indicator, has already crossed above 50 (green arrow), suggesting that the short-term trend is bullish. Similarly, the MACD is almost positive
However, it remains to be seen whether this move above 50 (red circle) by the RSI will only be a short-term deviation, similar to the January 20 move.
A move and then a close of Bitcoin above $38,200 would go a long way to confirming that this rise is not simply a support rally.
Short-term price movement
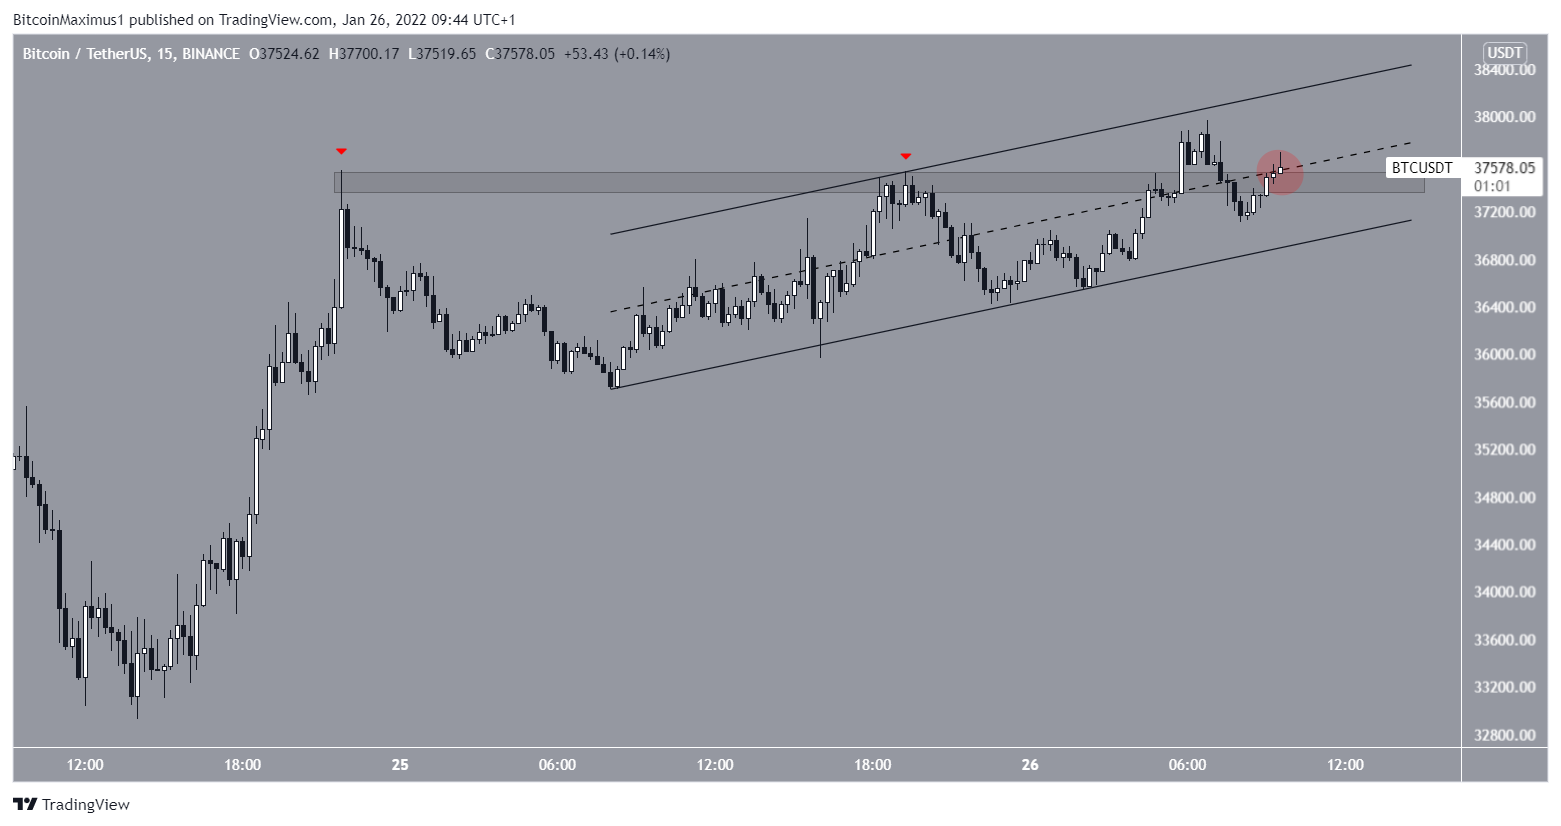
The 15-minute chart shows that BTC is looking to break above the $37,400 zone, which has previously rejected it twice (red arrows).
However, the asset is trading inside an ascending parallel channel, which is usually a corrective pattern. The movement inside this channel also exhibits very frequent overlaps, which reinforces the possibility that it is a corrective movement.
Due to these signals, a break of Bitcoin above the channel seems like the most likely scenario, before it resumes its downward movement.
That said, despite this potential short-term dip, the most plausible long-term wave count still suggests that Bitcoin has bottomed out.
Disclaimer
All information on our website is published in good faith and for general information purposes only. Any action taken by the reader based on information found on our website is entirely at their own risk.