
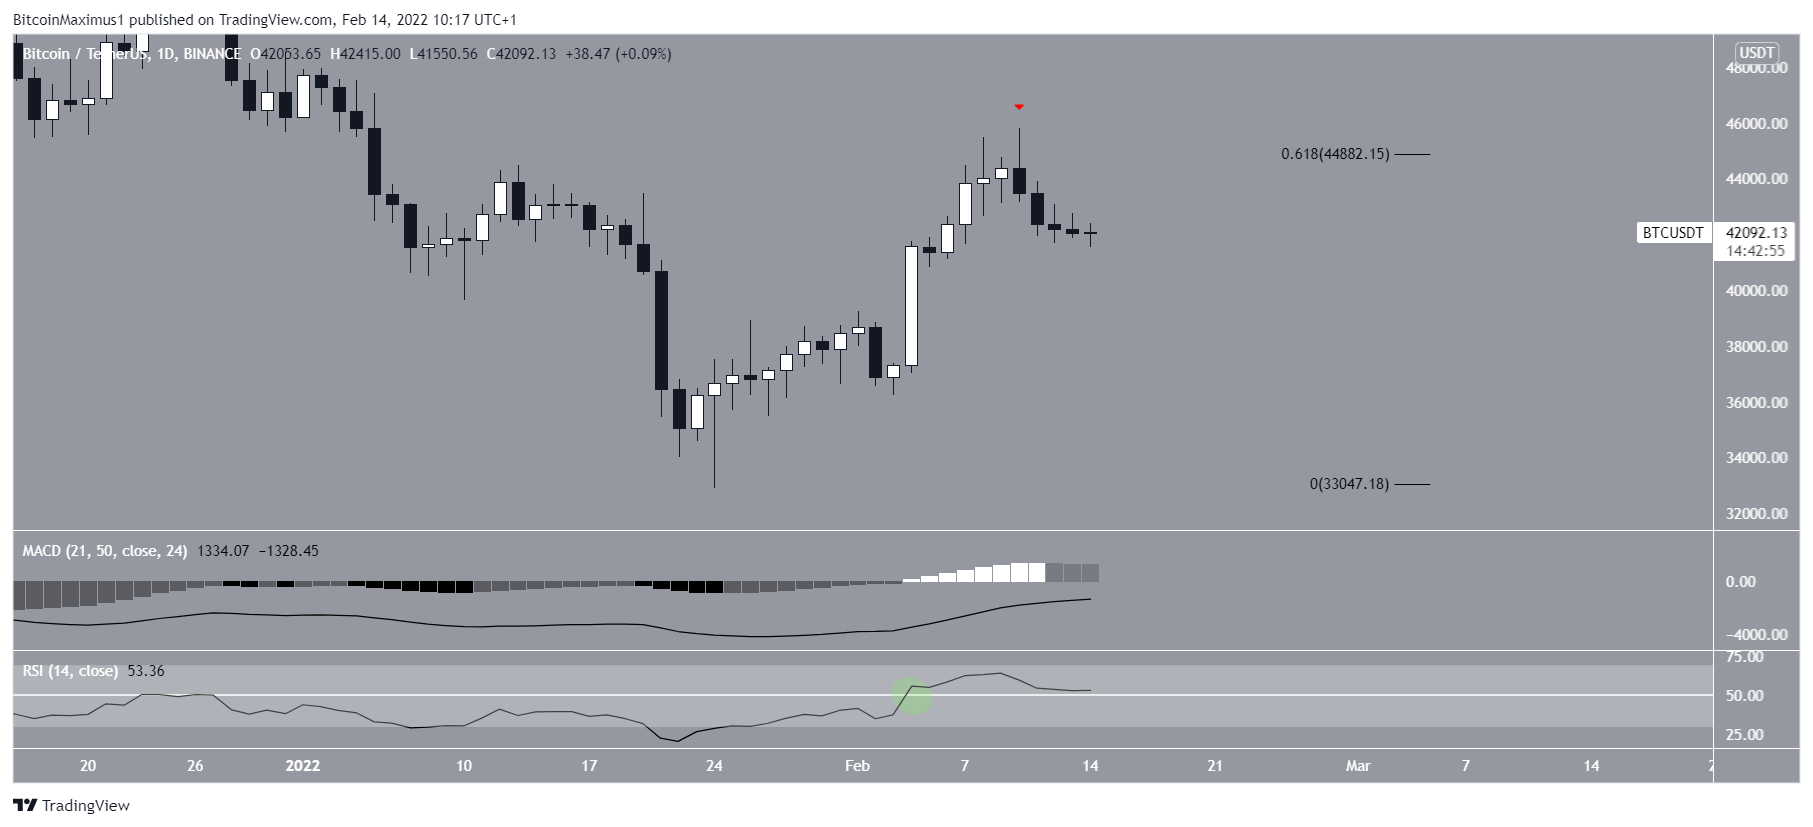
Bitcoin’s price failed to end the week of February 7-14 on a positive note, instead generating a long upper wick candlestick. However, the short-term readings suggest a possible imminent reversal.
After creating a bullish candlestick during the week of January 31 to February 6, BTC declined slightly the following week, creating a bearish candlestick with the very long upper wick.
Measuring the entire downside move, the local high of $45,821 BTC sits very close to the 0.382 Fibonacci retracement resistance level at $46,700, which is also a horizontal resistance zone.
Thus, it is likely now to be the main resistance level.
Bitcoin Technical Indicators
The daily chart shows that BTC price was rejected by the resistance level of the 0.618 Fibonacci retracement (red arrow), obtained by measuring the most recent part of the downward movement. This resistance is found at $44,900.
However, Bitcoin’s technical indicators are showing bullish signs. We see it in particular in the RSI, which crossed above the line of 50. This line is considered as a threshold allowing to determine if the trend is bullish or bearish.
Similarly, the MACD is rising but is not yet positive. This would be another sign of an uptrend.
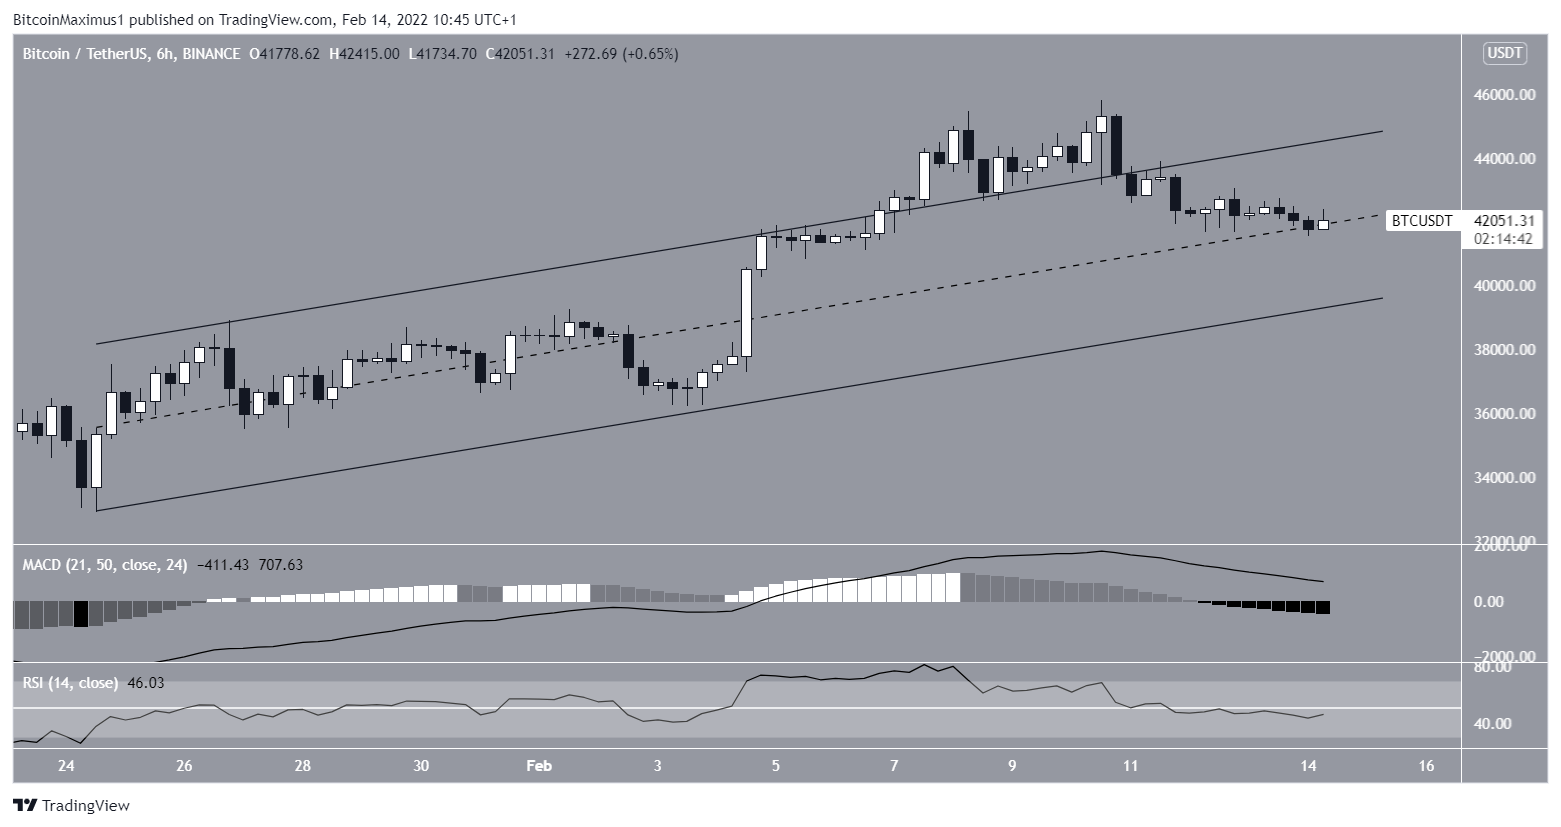
The six-hour chart shows that Bitcoin price has fallen back inside an ascending parallel channel. This channel previously contained the January 24th move until price action broke through on February 8th.
Currently, BTC is trading just at the midline of this channel, which should provide support.
Unlike the daily chart, the MACD and RSI provide neutral readings.
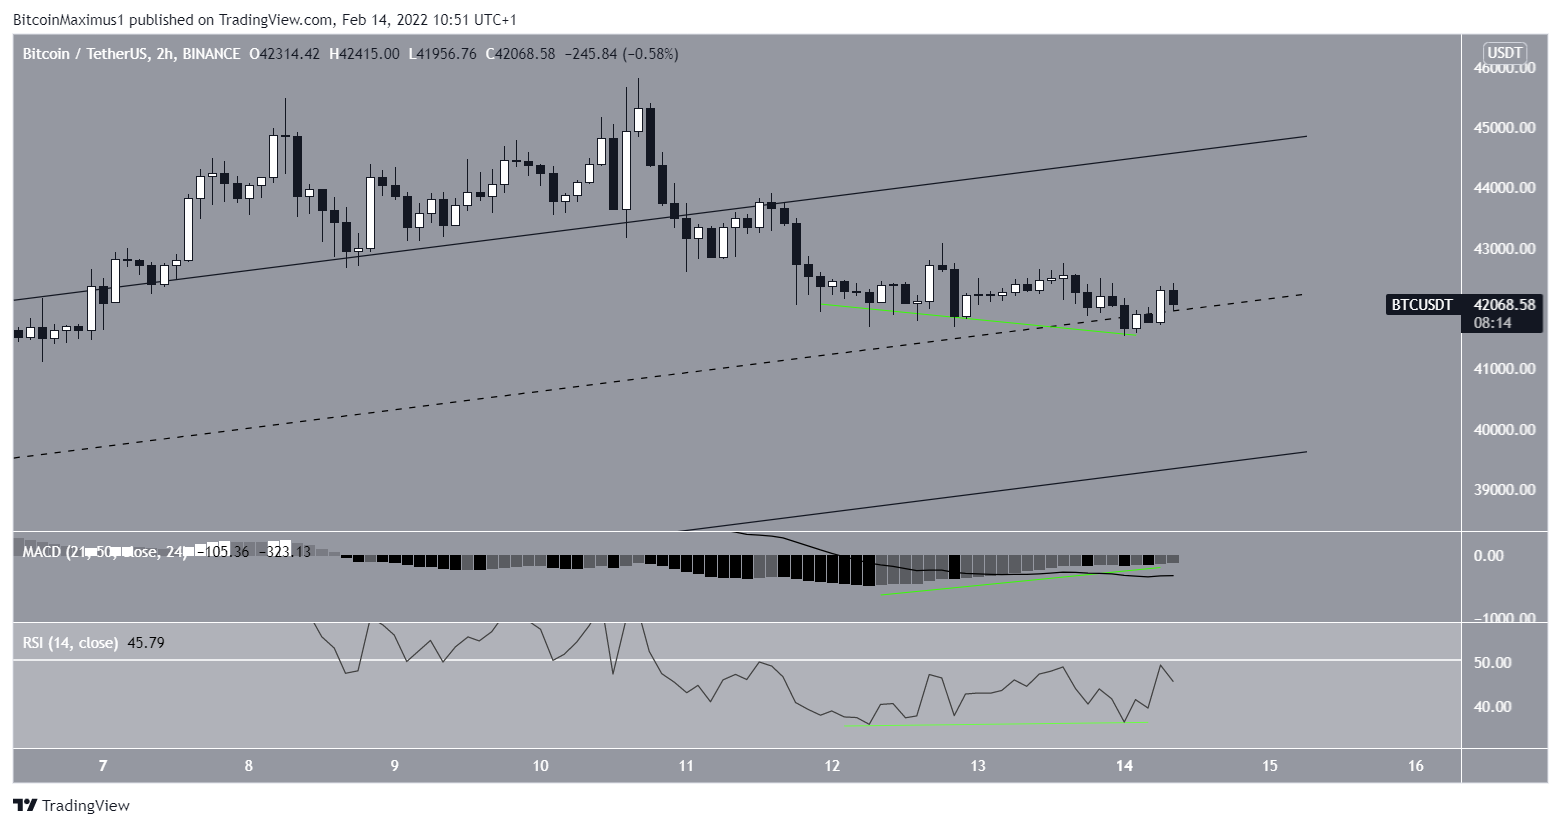
The two-hour chart of BTC is a bit more bullish.
In addition to moving in the middle of the channel, the RSI and the MACD have generated considerable bullish divergences (green line). This is a phenomenon that often precedes strong upward movements in the price.
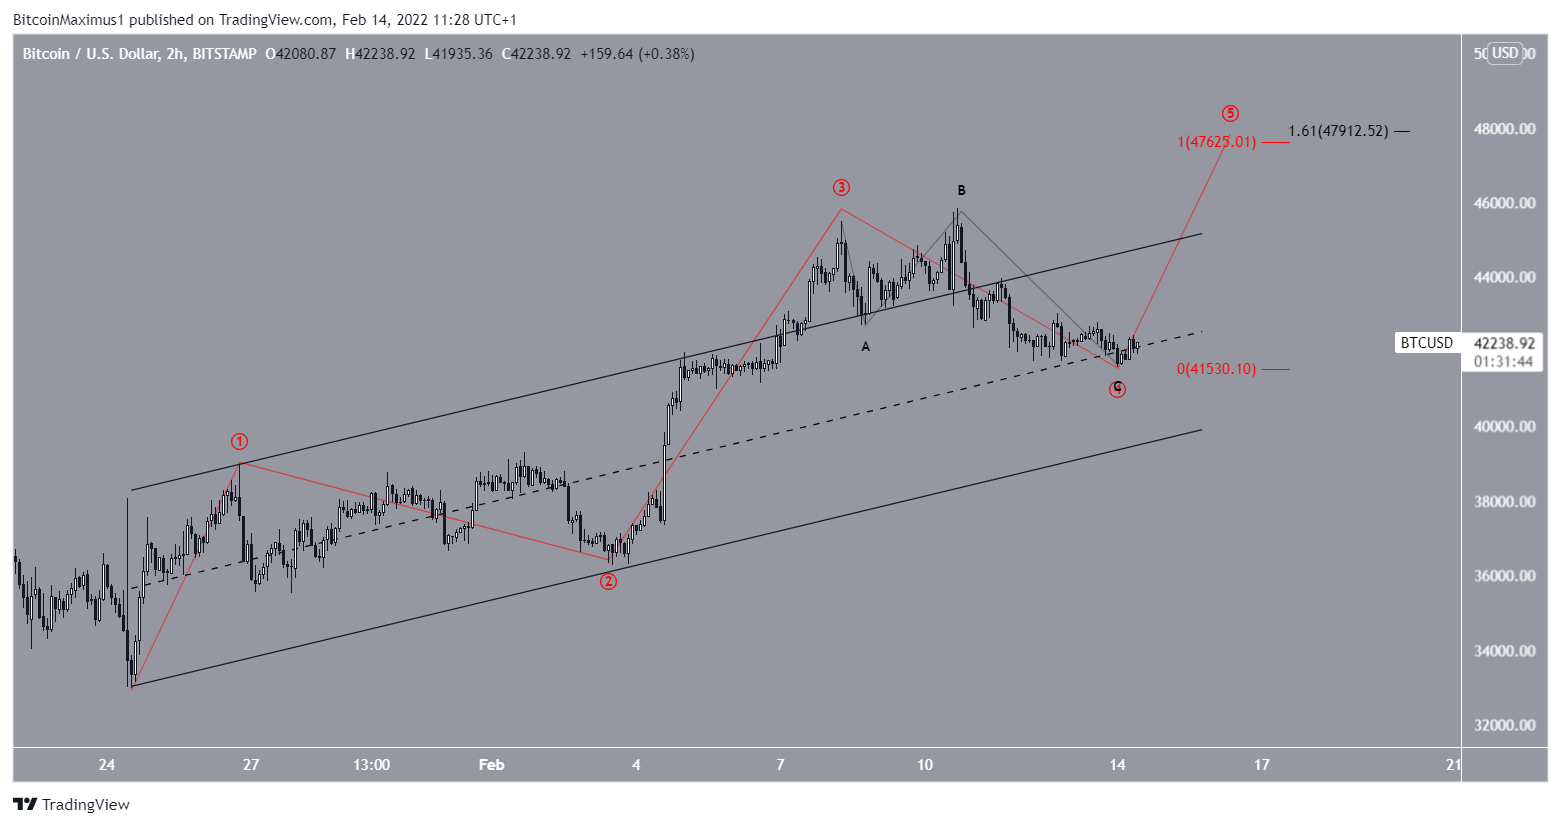
An analysis of the course’s wave count
The most plausible long-term wave count indicates that BTC price has already bottomed out. The short-term count (in red) on the other hand suggests that BTC has completed the fourth wave of a five-wave uptrend. The subwave count is shown in black.
The trough of this February 14 was located just at the level of the Fibonacci retracement 0.5, obtained by measuring the entire third wave (white). This gave subwaves A and C a ratio of 1:1.61, which is an appropriate level for a price bottom.
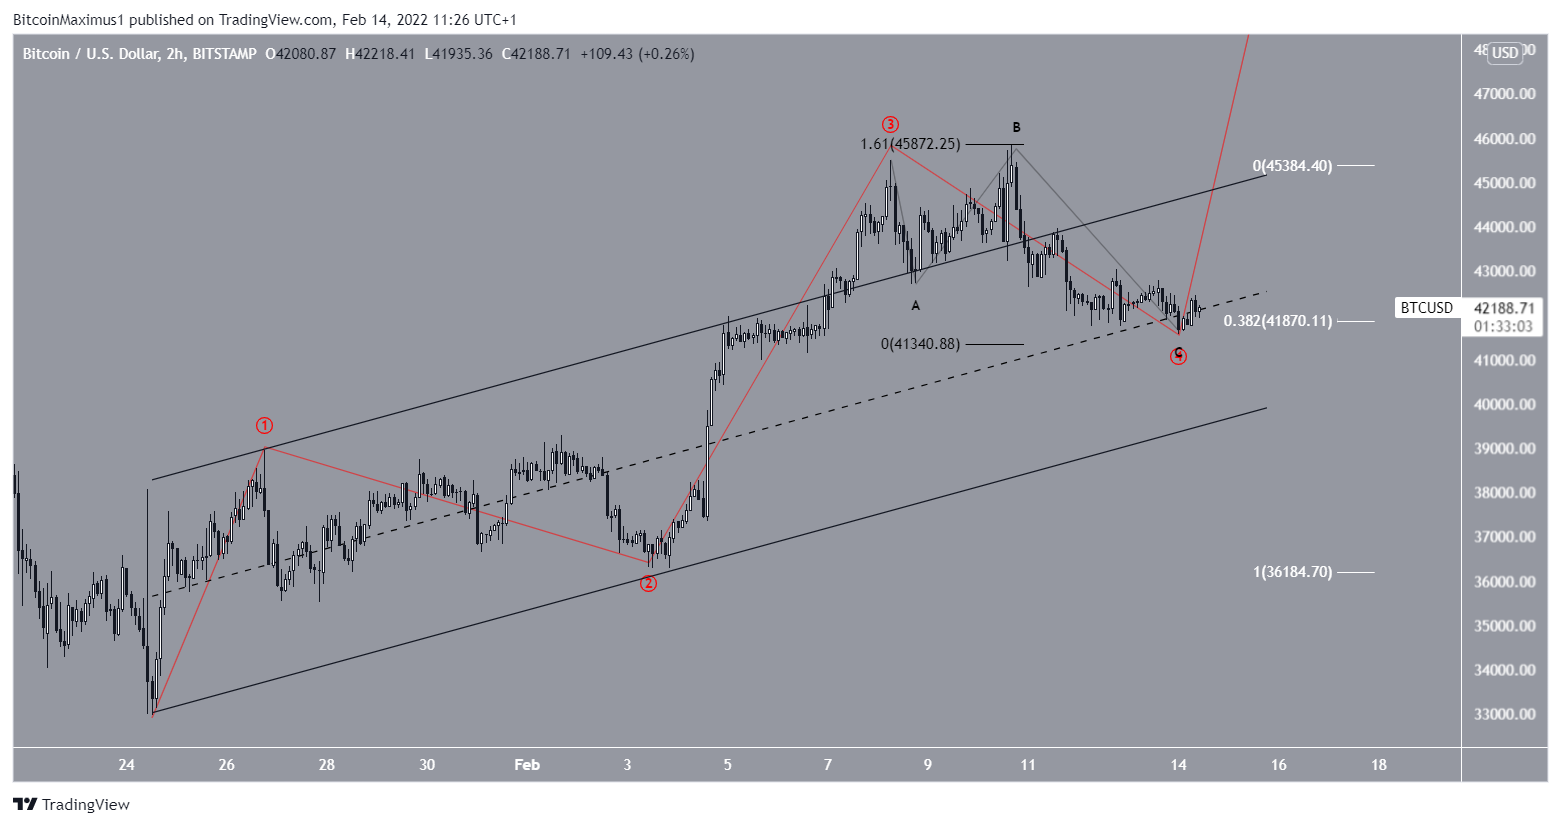
If the fifth wave has indeed started, the most plausible target for the price top is estimated between $47,625 and $47,912. This range is obtained by projecting the length of the first wave and using an external retracement on the fourth wave.
After that, the price of Bitcoin could correct in the short/medium term.
Disclaimer
All information on our website is published in good faith and for general information purposes only. Any action taken by the reader based on information found on our website is entirely at their own risk.