
Bitcoin (BTC) has been rising since January 24, and made its 4th attempt to break above a descending resistance line on February 4. It is expected that the price will eventually exceed it.
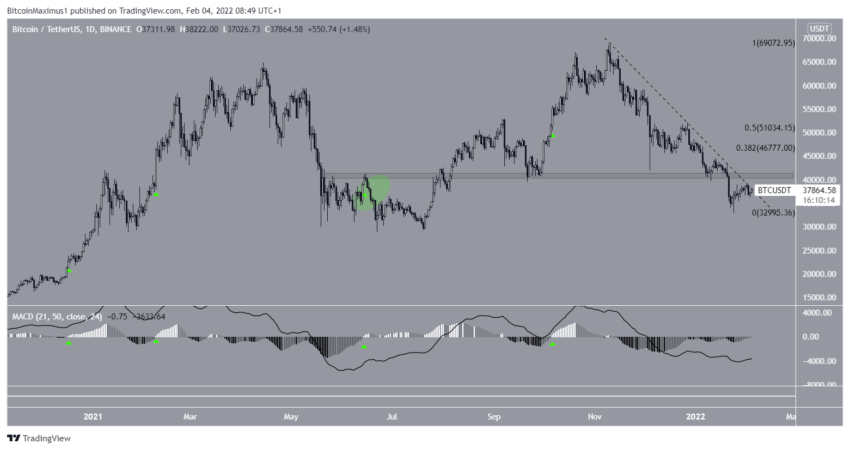
Bitcoin’s price has been declining below a descending resistance line since its all-time high on November 10, 2021. This line has rejected BTC four times (red arrows), the most recent being on February 4. However, knowing that the resistances weaken each time the price reaches them, it would be likely that the BTC will eventually exceed it.
The nearest resistance zone is found at $40,800. If Bitcoin manages to break above it, the next resistances will be at $46,800 and $51,000, which correspond to the 0.382 and 0.5 Fibonacci retracements respectively.
A strong bullish signal could soon appear within the MACD, an indicator created by short- and long-term moving averages (MAs). Indeed, after being negative for 82 days, the MACD is very close to moving into positive territory. This would mean that the short-term MA is faster than the long-term MA, which is a staple of uptrends.
An analysis of historical data
An analysis of Bitcoin’s MACD history shows that when this indicator moved into positive territory, large upside moves usually followed (green arrows). This has happened four times since December 2020.
In June 2021, this signal led to a short-term decline, but BTC rose significantly soon after.
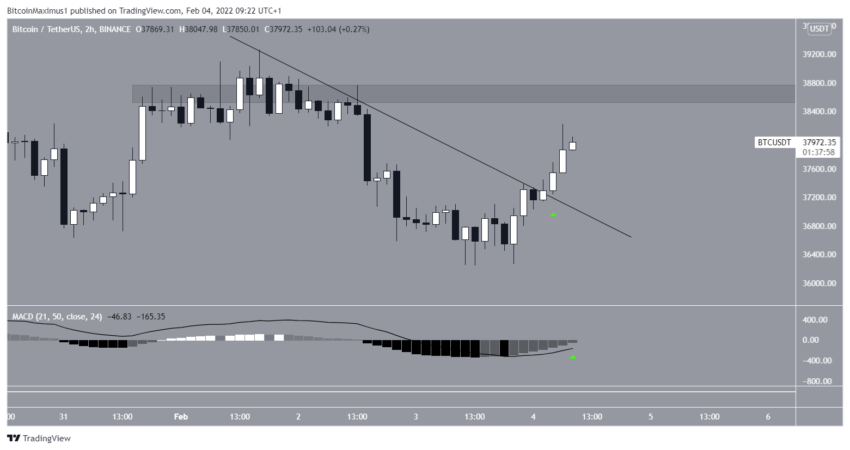
The two-hour chart shows that BTC has already broken above a short-term descending resistance line. Moreover, the MACD has practically moved into positive territory.
The nearest resistance is found at $38,650. A move above this zone could also allow it to break above the long-term descending resistance line and accelerate its rise.
Bitcoin Wave Count Analysis
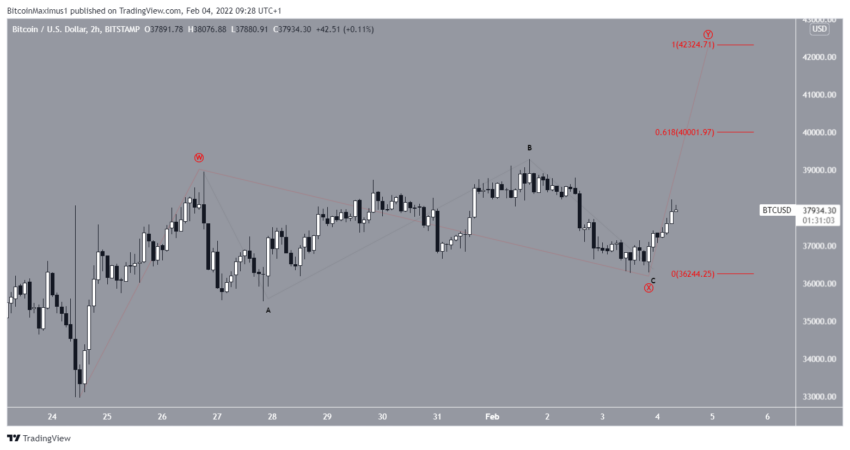
There are two possible options for the short-term count, both pointing to a likely significant upside move in the short-term.
In the first possible count, Bitcoin would be in wave Y of a corrective structure in WXY. The first potential target for this move would be at $40,000, which would give the W and Y waves a ratio of 1:0.618. The next target would be at $42,300, which would give the waves a 1:1 ratio.
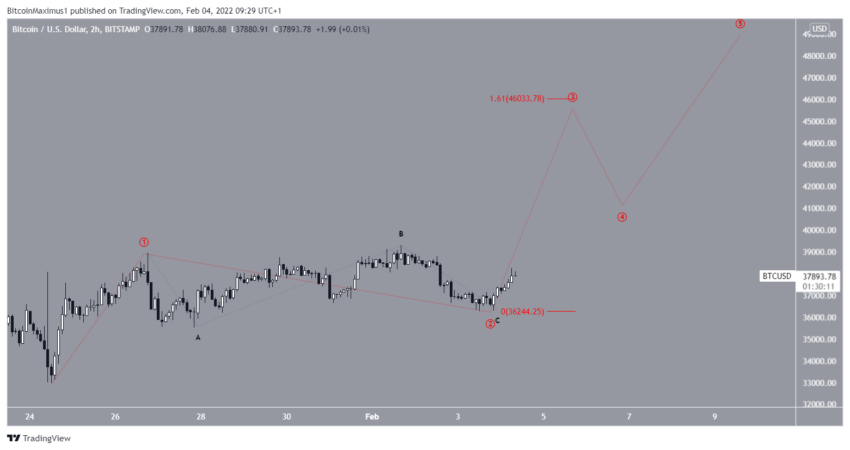
The most plausible long-term wave count suggests that Bitcoin has bottomed out. This would then mean that the current upward move is part of a bullish impulse rather than a corrective phase.
The closer BTC gets to the 1.61 level located at $46,000, the more plausible this count will be.
Disclaimer
All information on our website is published in good faith and for general information purposes only. Any action taken by the reader based on information found on our website is entirely at their own risk.