
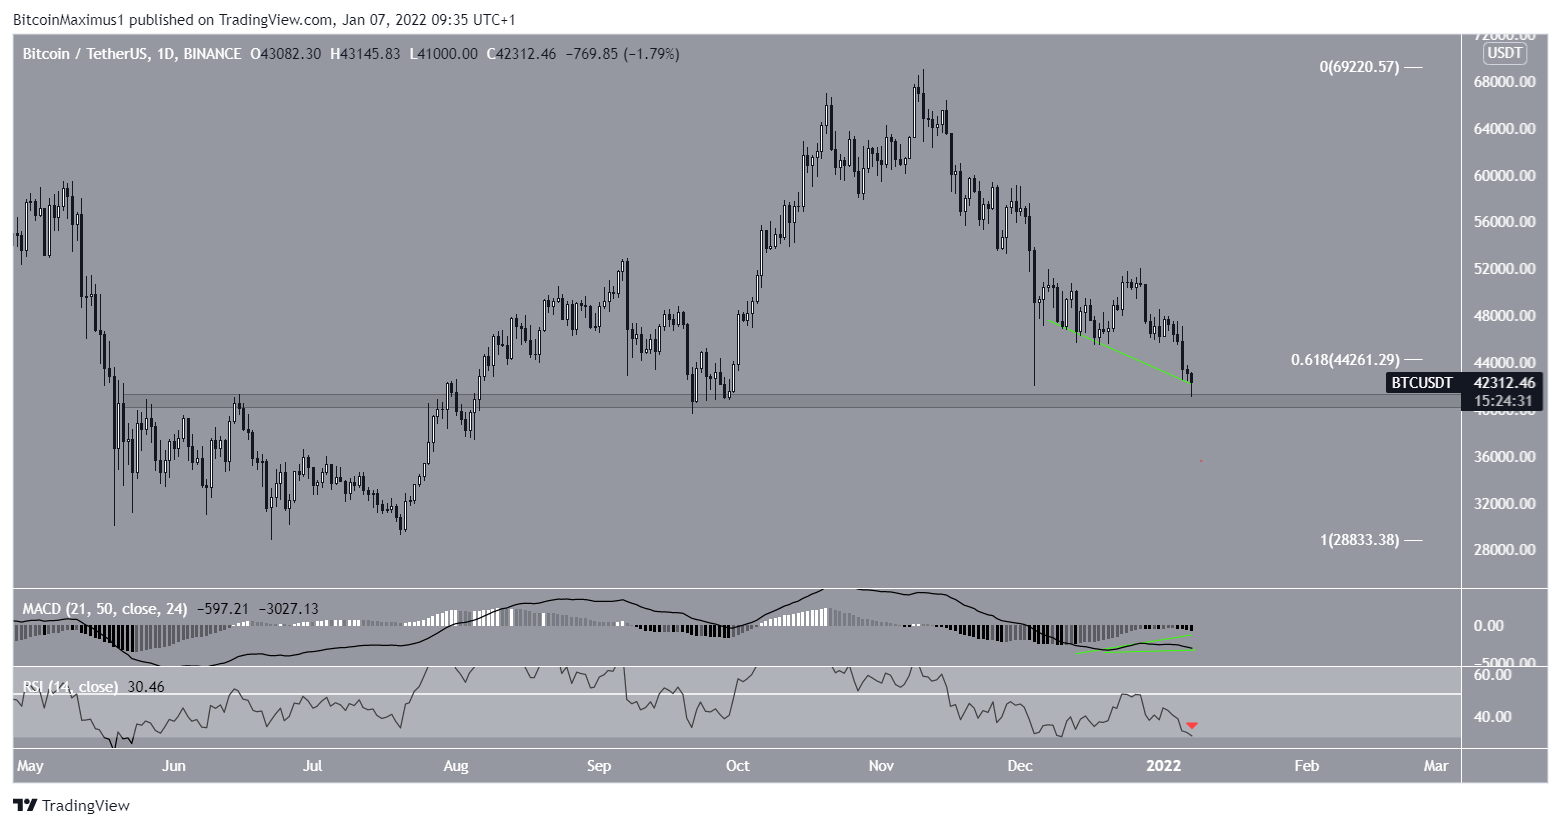
After falling below a 32-day support zone, Bitcoin (BTC) price hit a low of $ 41,000 on January 7 and is now testing a horizontal support zone.
BTC has been declining since December 27, 2021. This decline took it to a local low of $ 41,000 on January 7, just below the support level of the Fibonacci retracement (in white). It also took BTC to its December 2021 low (red line).
After hitting that support, Bitcoin has retraced slightly and is currently trading at $ 42,200.
A possible turnaround in the course?
The technical indicators of the daily chart are showing mixed signals.
The MACD, which is created by short and long term moving averages (MA), has generated bullish divergences. This means that the decline in price was not accompanied by a decline in trend momentum. This is a sign that often precedes bullish trend reversals.
That said, the RSI, a momentum indicator, is on track to drop below 30 (red arrow). This is a bearish sign suggesting that momentum, or momentum, is weakening.
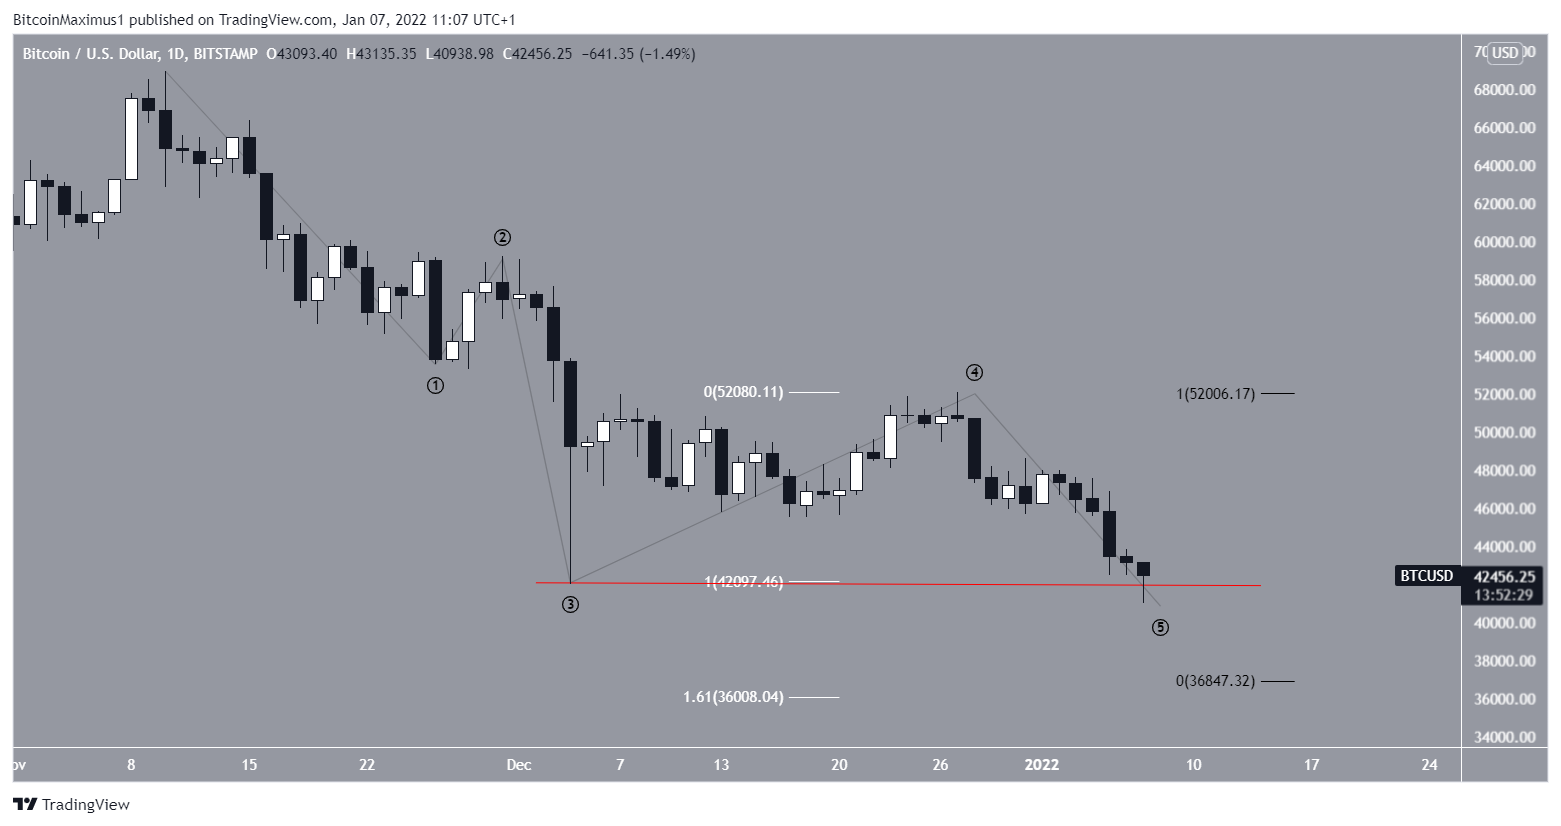
Bitcoin wave count
It would appear that the price of Bitcoin is advancing in a bearish momentum rather than a corrective formation. Due to the aforementioned move to the December 4th floor (red line), this formation is valid as a full bearish impulse (red line).
It is possible that wave five will continue. In this case, the main Fibonacci support area would be between $ 36,000 and $ 36,800. This range corresponds to the external FIbonacci retracement 1.61 (in white) of wave four, and gives waves 1: 5 a ratio of 1: 1.
Disclaimer
All information on our website is published in good faith and for general information purposes only. Any action taken by the reader based on the information found on our website is entirely at their own risk.