
To the Moon – the Bitcoin has started to rise again since February 24, printing an increase of more than 30%. Then it got rejected several times on the resistance at $45,000. The beginning of the year is complicated for Bitcoin, but it could try to establish a low in a complicated geopolitical context. The moment would be perfect to change dynamics as the players imagine that the king of cryptocurrencies is out of breath. Is it really over for Bitcoin in 2022? Would we be in the bearmarket like in 2018? Not so sure !
This Bitcoin price analysis is brought to you in collaboration with the Coin Trading and its algorithmic trading solution finally accessible to individuals.
Bitcoin Technical Analysis
Bitcoin weekly:
Let’s talk about the RSI first. The RSI is an indicator of momentum i.e., it measures the strength of BTC buyers against the strength of sellers. If the RSI closes the week above 45this would indicate a bullish momentum weekly.
For the moment, nothing is confirmed, it will be necessary to follow this with interest. For comparison, the momentum this summer was not bullish on the RSI. The momentum draws a “V bottom” rather than a “W”. That didn’t stop Bitcoin from hitting a new all-time high, but the rise was short-lived.
A bullish “W” momentum on a weekly basis is quite rare, here is an example in September 2020:
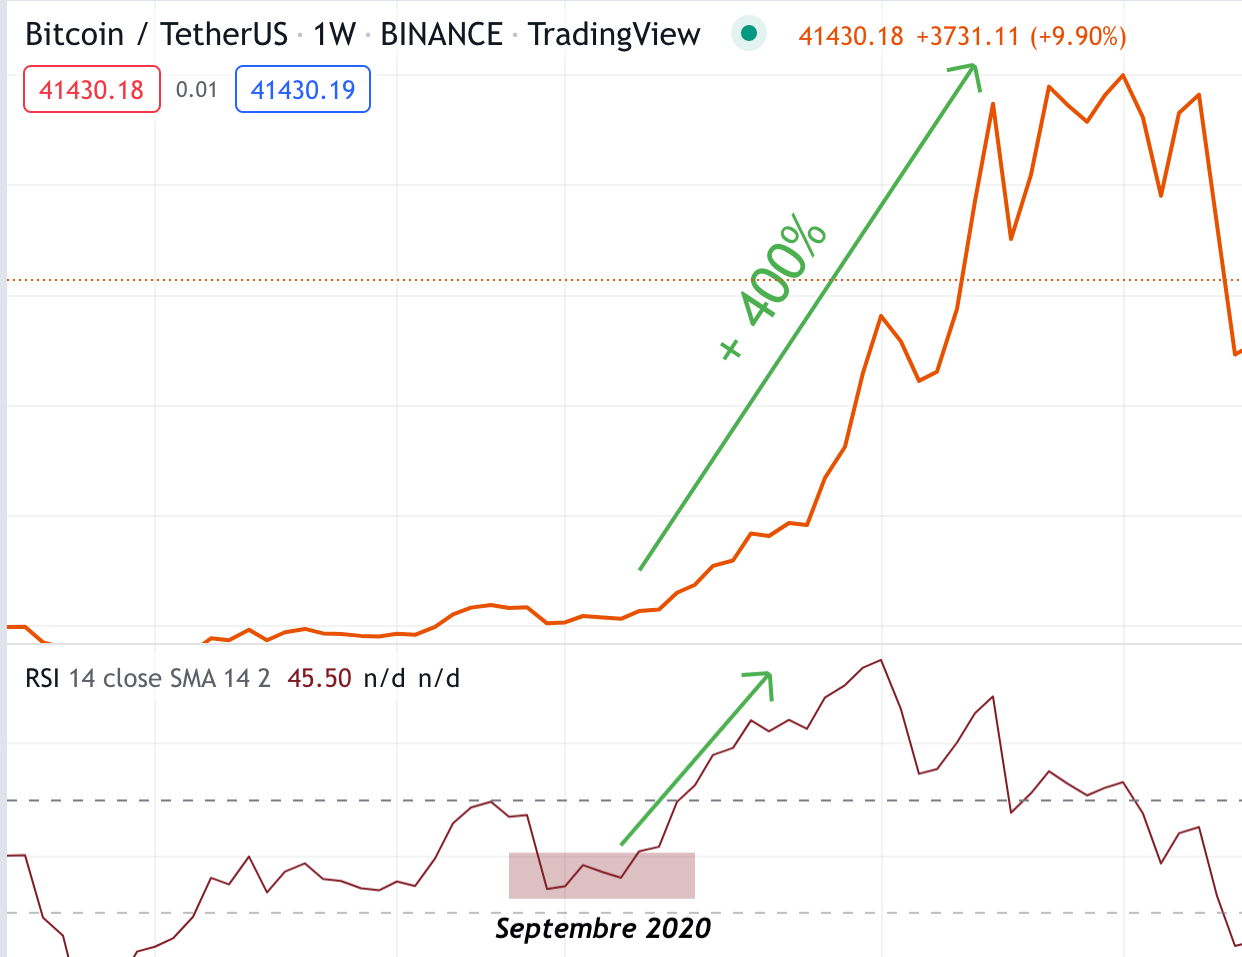
Bullish momentum on the price of Bitcoin against the dollar (1W)
This example illustrates the power of this kind of signals. Following this, Bitcoin came into bull run with a rise of more than 400%. It is all the more powerful when the momentum confirms before the price structures bullish figures in the same unit of time.
As for the weekly course, Bitcoin could then confirm by closing above $46,000. It is Bitcoin resistance that buyers need to take back. A bullish momentum and a price that closes above $46,000 would bode very well for the end of 2022.
We have indicators that have purged and which returned very low. In January 2022, the weekly RSI returned to 38, levels that Bitcoin has experienced twice: in March 2020 with the “Covid crash” and during 2018 in the middle of the bearmarket. Moreover, the stochastic is close to the oversold zone and could cross bullish at the end of the week.
Bitcoin daily
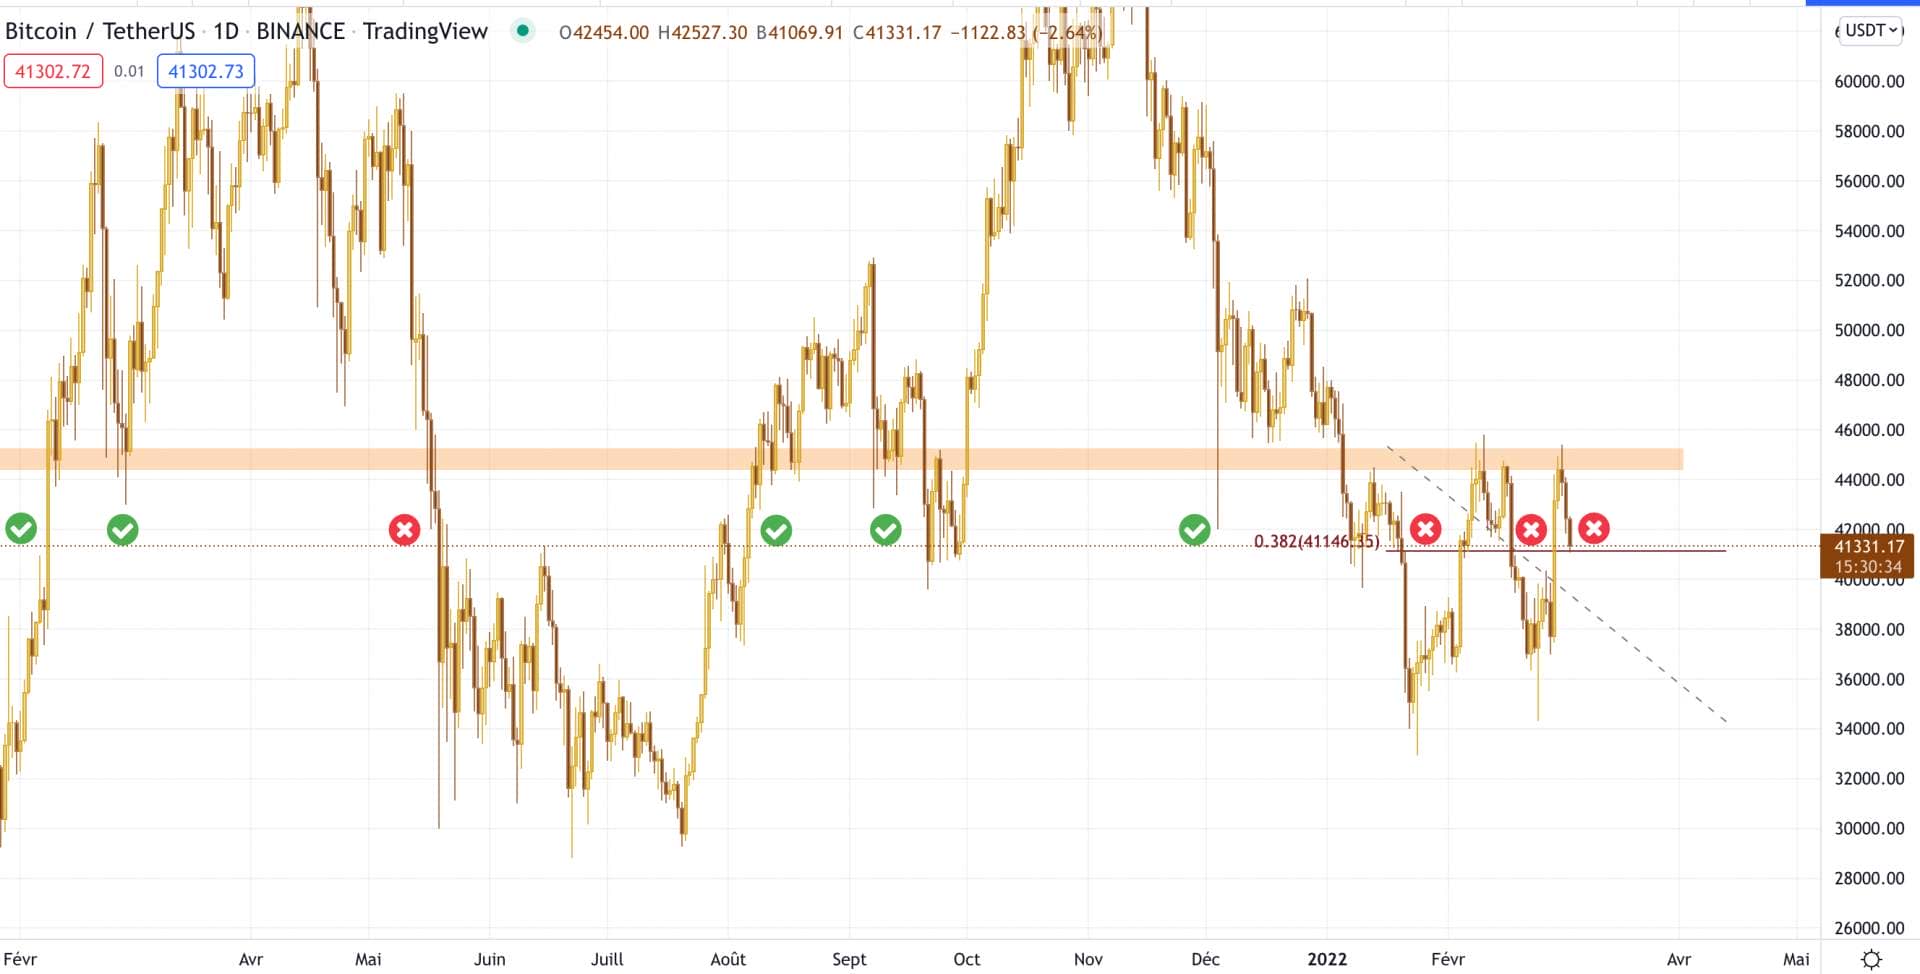
The graph above shows the importance of resistance at $45,000 for Bitcoin. It is very often a location major reversal leading to a low range return to $30,000 or a high-end return to $60,000. For the moment it is not happening. In the space of two months, Bitcoin was made to reject four times at this resistance.
We are currently at the level of first stop (0.382 Fibonacci retracement) of the upside move. As long as we hold it, we can see Bitcoin make a new high and therefore, potentially, close above $46,000. If this first stop gives way, the price will probably head towards $40,000 see below. It will be necessary to maintain at all costs the lowest established on January 24 at $32,900. If this low is not maintained, the whole theory mentioned above will then be invalidated.
Analysis of Bitcoin Derivative Contracts
To understand what the margin tradingI suggest you read this article which presents the essentials to know.
The Binance Perpetual contract gives some interesting information:
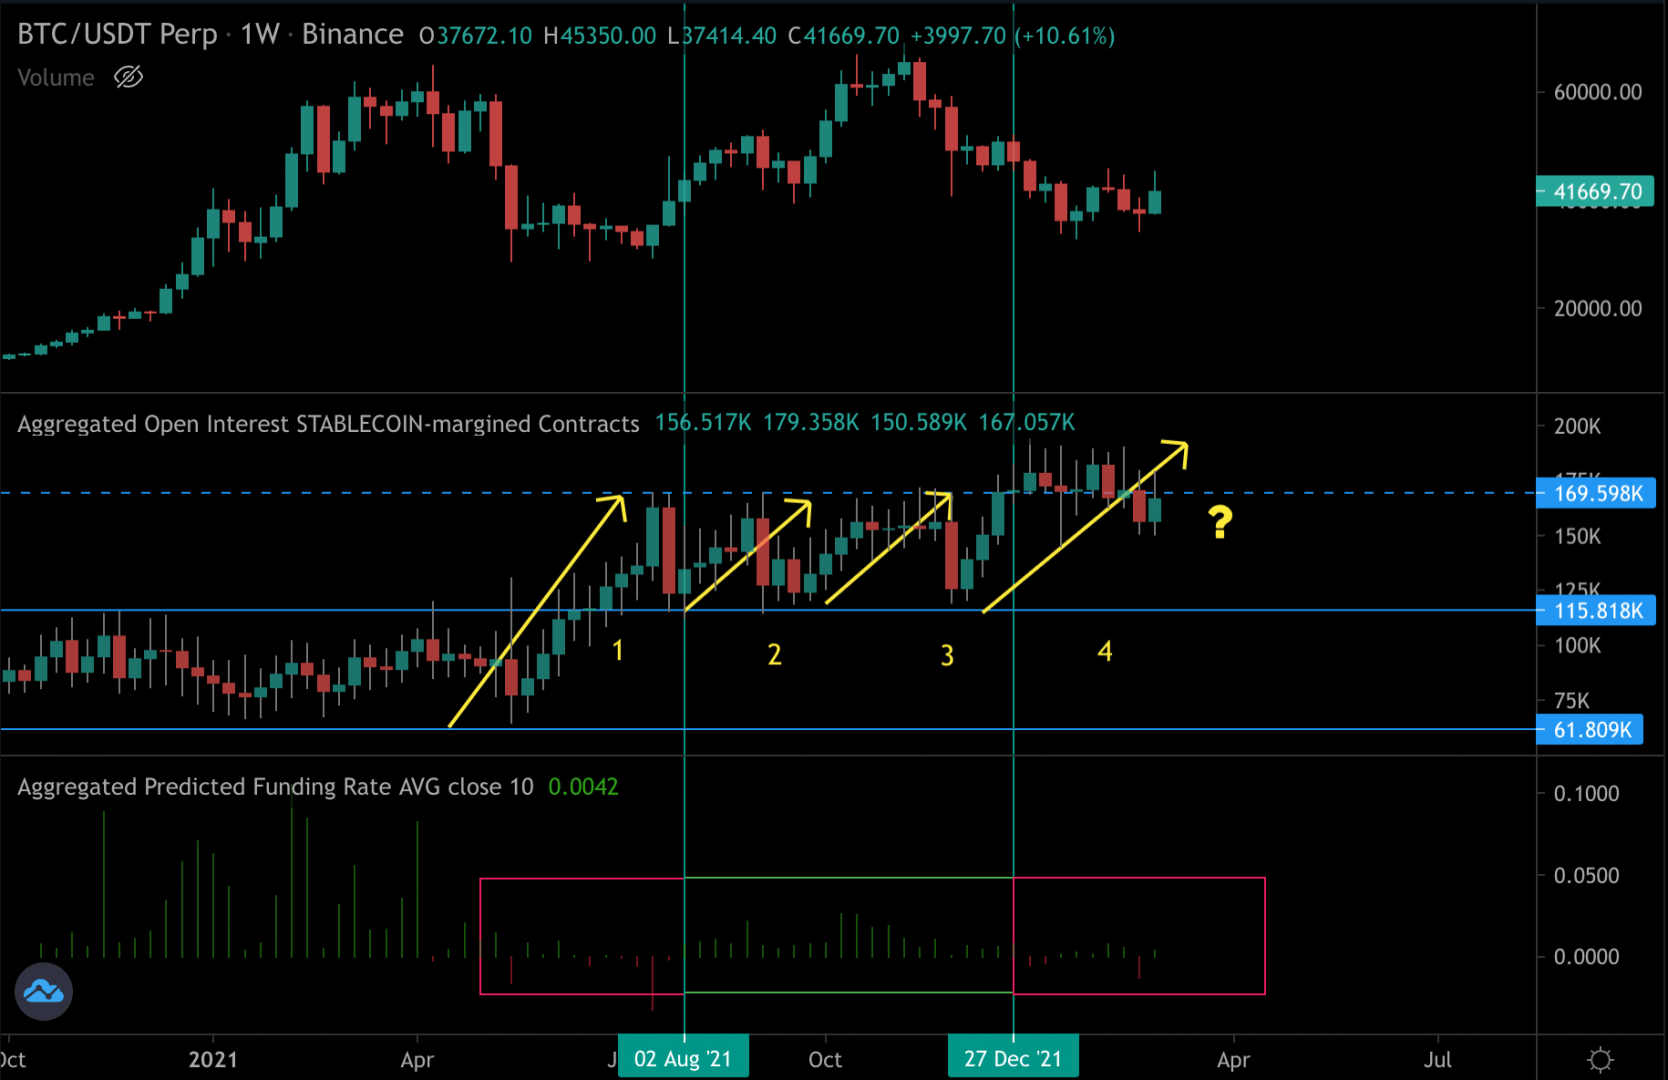
Open interest is a tool for knowing the opening and closing positions. We see that open interest creates supports and resistances interesting. This summer (1), there were a lot of positions opened which led to overcome resistance. The funding rate was itself neutral to negative. The short squeeze was visible when the open interest sharply dropped (red candle after 1) as Bitcoin price climbed. This indicated a closing of short positions with liquidations.
Periods 2 and 3, with the rise of open interest, were made with a funding rate positive. There was a lot of long triggered by the actors. The market stopped selling longs during the back to support of open interest (blue).
Period 4 on the chart is different. When returning to support in 3, one would have thought that the decline was over. If we go back to the previous reasoning, the longs had been liquidated. However, the rise of open interest was made with a funding rate neutral to positive. Actors certainly bought in thinking the drop was over. The rest, we know it, the price went down to $33,000.
It is always easier to draw conclusions after events. Let’s try to look at the current situation to formulate hypotheses. The rise from 3 to 4 was made with a funding rate positive-neutral at the beginning, then, the funding passed negative. So there is shorts to come out above $46,000.
From this, two hypotheses emerge:
- We created a new resistance (dotted blue) and the open interest will be reset to 0 when it comes back to support. The funding rate was negative like this summer, we can think that the rise in the price of Bitcoin would make it possible to lower the open interest.
- We have broken the new resistance and we still need shorts to open. The new resistance of the open interest will be higher. In this hypothesis, we imagine that the price is not ready to start rising again. We’re still going to needa phase of accumulation of shorts.
Interpretations on perpetual contracts can be talking point. The interpretation proposed here attacks one angle, there are other possible ones. Objectively, we see that the open interest on this contract remains very high while Bitcoin is only at $40,000. This indicates that volatility is likely to be significant again in the weeks and months to come.
If we analyze the orderflow of all contracts, this is what we get:
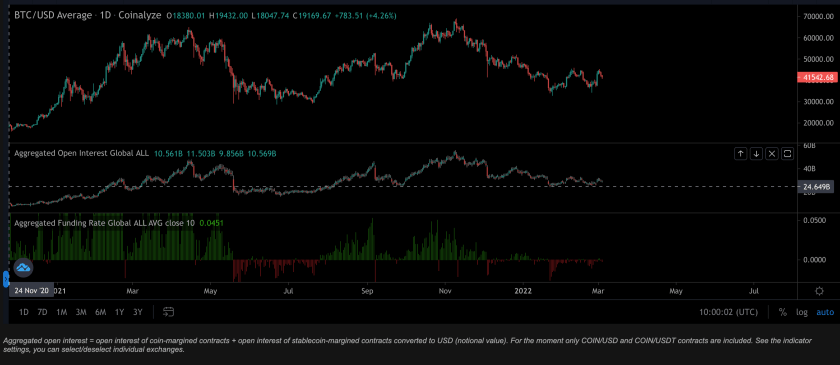
Thanks to this graph, we have a slightly different. Global open interest is very close to support established in September 2021. The funding rate is largely negative as was the case this summer. It is much easier to notice the phases of euphoria and fear of the market. Concretely, the funding rate has been negative since the end of January 2022 and neutral since the beginning of December 2021. This shows that, close to the support of $30,000the actors are not confident.
The market phases marked by a lot of euphoria are easily identifiable thanks to the funding rate. It is the top of the market when the funding is very high (green) and there is a bottom when it is very low (red).
Based on this data, it is likely that the market is structuring a market low and that a short squeeze is going to happen sooner or later.
Bitcoin on-chain analysis
Data on chain are based on the transactions made at the blockchain level. It contains interesting information on the medium to long term.
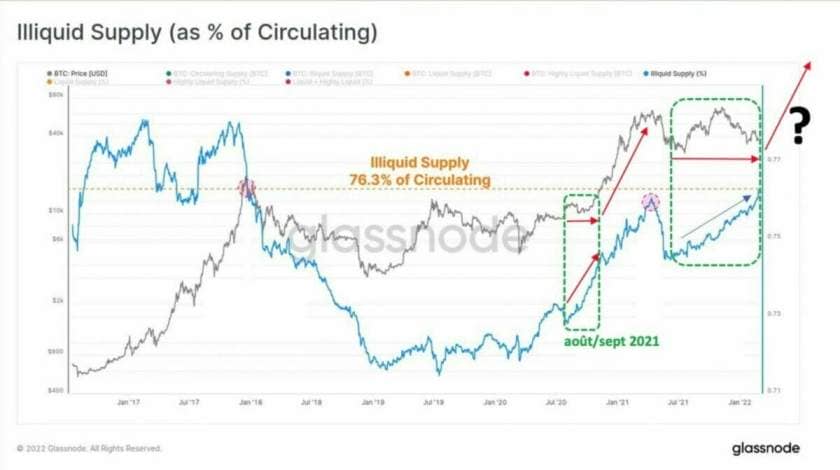
This data reflects the offer bitcoin. The illiquid supply represents the players who keep more than 75% of what they buy. We are not talking about traders here, but about investors who keep their Bitcoin over time. They are also called “strong hands”.
We see that these actors have distributed their bitcoin from the bitcoin top in early April 2021. From May-June there was accumulation of bitcoin again. We are, a priori, in a situation similar to August-September 2021. A price that does not move much while investors “strong hands” accumulate bitcoin. As the price fell more than 50%, they continued to accumulate. There are a strong divergenceit is a data bullish.
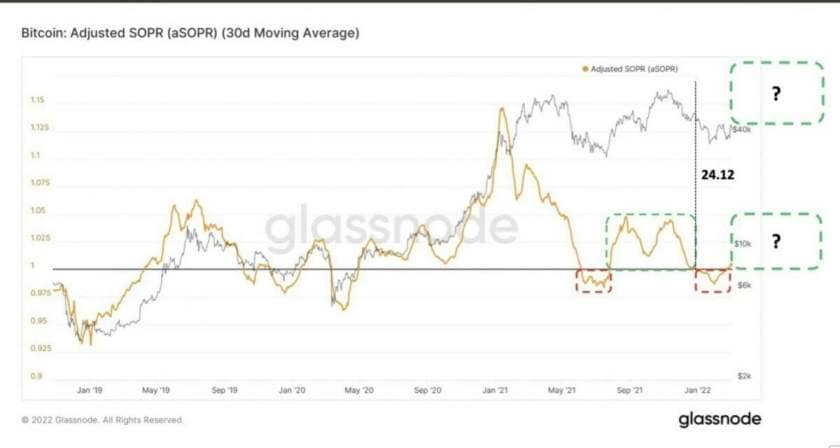
The SOPR (Spent Output Profit Ratio) shows whether trades are made at a loss (<1) or a profit (>1). It is interesting to note that we were in a period when the actors sold at a loss as in May 2021 or March 2020. This data is also bullish.
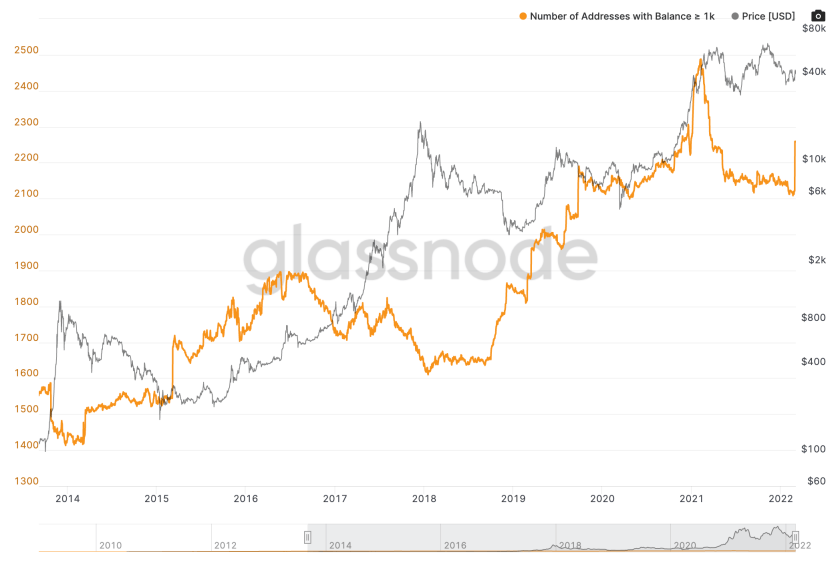
It is a data which is revealed very strong over time. Following the tops of Bitcoin, there follows a period when these players no longer do anything. This is a period when the orange curve no longer moves describing as a row. As soon as the orange curve breaks the range on the rise, anew bullish phase.
Beware, in November 2018, the price fell as players bought large quantities of Bitcoin. So this does not mean that Bitcoin has found its bottom and that there will only be upside from today. However, holders of more than 1000 Bitcoin are always present during bull markets and sell their Bitcoin as they rise.
It is a data which is bullish for the months to come. In the meantime, it is possible that Bitcoin will fall below the support at $30,000 for example. This data indicates that these players believe that current levels are interesting news. We see that they practice a DCAbecause, even in the event of a fall, they buy Bitcoin.
Technically, and beyond the contingencies due in particular to the Russian-Ukrainian conflict and the declarations of the FED, the Bitcoin is picking up color. It remains to be confirmed daily and then weekly. Sellers seem to be losing strength. The orderflow generally goes in the direction of the technique. The funding rate is close to what we experienced this summer or in market phases where Bitcoin develops lows. Be careful though, confirmations are necessary to prevent sellers from regaining control of the cryptocurrency market. On-chain analysis is rather bullish but these are data that are often relevant in the medium to long term.
Is it possible to be a winner every time? Whether the bitcoin price is in great shape, or going through turbulence, Coin Trading offers you to increase your chances of success. Indeed, Coin Trading allows individuals to access a trading tool algorithmic and 100% automated. Real trend mechanism, test this tool designed to adapt to market reversals and position yourself on the most dynamic crypto assets of the moment.