Bitcoin (BTC): Trapped in no man’s land
BTC rate: $38,681 (previous week: $43,550)
Resistances/Goals: $ 39,300, US $ 40,653, $ 41,445, $ 42.001, $ 42.546, $ 44,499, $ 44.99, $ 49.99, $ 46,710, $ 47,470, $ 49.370, $ 50.790 / $ 51,407, $ 52,125 USD 53,005 USD, $ 54.077, $ 55,817, $ 56.979, USD $57,901, $59,778, $61,771, $63,189, $64,896, $66,299, $67,416, $69,000
Supports: $38,289, $37,519, $36,312, $34,647, $32,930, $30,000, $28,810, $26,170
After Bitcoin (BTC) was once again unable to break out of the strong resist at USD 44,500, the key crypto currency subsequently slipped significantly south. Yesterday, Tuesday, February 22, there was a successful retest of the cross-support from the horizontal support and the downtrend line in the area of USD 36,643. Starting from this price level, the price recovered to the old breakout level at USD 39,300 before a slight consolidation occurred again in the course of a cautious stock market in the last few hours of trading. Uncertainty about increasing global political tensions surrounding the Ukraine conflict continues to set the tone for the time being. In Europe, a demanded ban on PoW-based cryptocurrencies by the European Parliament is causing investors to shake their heads.
Bullish Scenario (Bitcoin Price)
In the previous week, the chances were good for a short-term continuation of the trend in the direction of the historical high at USD 45,846. However, the clear reversal bar in the weekly chart and its risk potential were already pointed out in the last analysis. The simultaneously increasing political uncertainties surrounding a military conflict sent the global financial markets into a downward slide and also caused new price setbacks on the crypto market. Bitcoin broke all support levels and slipped 15 percentage points at the top. This resulted in a successful retest of the broken red downtrend line. Starting from the support zone in the USD 36,643 area, the Bitcoin price has recovered around eight percentage points in the last two trading days.
The bulls must now do everything in their power to reclaim the USD 39,300 level in order to rally back towards the EMA20 (red) at USD 40,653. If this area is skipped and USD 41,445 is also broken through, there will be another directional decision at USD 42,001. In addition to the strong horizontal resistance, the EMA50 (orange) can also be found here. It will take real buying power from the bull camp to sustain a break above this resistance level and activate the path towards last week’s high. Only when this cross-resist has been broken through sustainably will the zone between USD 43,546 and USD 44,499 move back into the focus of investors.
Key resistance decides the price development in the coming weeks
If the buyer side can also climb back into this zone without any significant setbacks, the key resistance at USD 45,846 will again decide the price development for the coming weeks. In addition to the high of February 10, 2022, the EMA200 (blue) can now also be found here. If the bulls manage to sustainably break through this price level and also overcome the 38 Fibonacci retracement at USD 46,633, this would be a first important partial success for the buyer side.
Bitcoin could then immediately rise towards the MA200 (green) and target the blue resistance area if it is cleared. The zone between USD 50,790 and USD 52,125 represents the next strong resist area. Already in December 2021, Bitcoin was unable to break through this resistance zone several times. If Bitcoin breaks through this resist zone, a walkthrough to USD 53,005 or even USD 54,077 is likely. Even a direct jump in price to USD 55,817 should not come as a surprise. However, first investors will rake in profits here.
Bounce or all-time high?
There will be a final showdown between the two factions at the latest on USD 57,901. If Bitcoin bounces significantly south here, another potential downward wave would be conceivable. This zone contains a cross resist of horizontal resistance and the 61 Fibonacci retracement of the full down move. If the buyers succeed in breaking through this strong resistance at the end of the day, the chart brightens significantly in favor of the bulls. Bitcoin is likely to march directly above USD 59,778 towards USD 61,771.
The all-time high would be within reach again. If the zone between USD 63,189 and USD 64,896 can also be attacked and overcome in the medium term, Bitcoin is likely to target the last two resistances on the way to new highs. USD 66,299 and USD 67,416 represent the last hurdles on the way towards USD 69,000. The RSI and the MACD indicator in the daily chart are currently showing sell signals again. Indicators should only turn to buy again if there is a sustained price recovery. As long as Bitcoin already fails at USD 39,300 and continues to value below USD 42,001, the bears will again have the scepter in hand.
Bearish Scenario (Bitcoin Price)
The bear camp took advantage of the current uncertainty in the global financial markets and sent Bitcoin well below important support levels. Although the buyer side prevented a direct sell-off back in the direction of the low for the year, this did not prevent the chart from clouding over. If the bears continue to cap Bitcoin below USD 39,300 and especially USD 42,001 in the coming trading days, the correction could resume. If Bitcoin falls below today’s low of $37,519, yesterday’s low of $36,643 will come into focus again. If the bulls fail to return to the floor here, the correction will immediately widen towards $34,647. If this support is also undercut by the daily closing price, a retest of the year’s low at USD 32,930 should be planned.
In the first attempt, a counter-movement is likely to set in. However, if the Bitcoin price cannot sustainably move north in the following days, an extension of the correction to at least USD 31,603 is likely. If this support is abandoned, Bitcoin will want to immediately target the psychologically important $30,000 mark. Then the 2021 low of USD 28,795 as a target is within reach. Whether a countermovement at this chart mark will be sufficient to stabilize the Bitcoin price in the long term is unlikely in view of the many uncertainties caused by politics and the central banks. The chance that Bitcoin will target the light green zone between USD 26,170 and USD 27,562 is noticeably increasing. This is where the 61 Fibonacci retracement of the complete overarching trend movement is found. Increased resistance and a relief rally can therefore be expected. It is currently difficult to assess whether this will be sufficient to avert a relapse to the breakout mark in the USD 20,000 area.
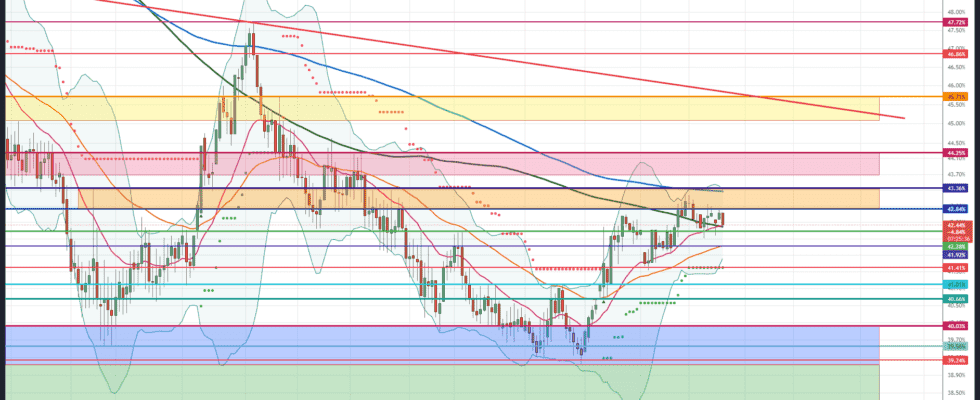
Bitcoin Dominance: Wedged below the EMA200
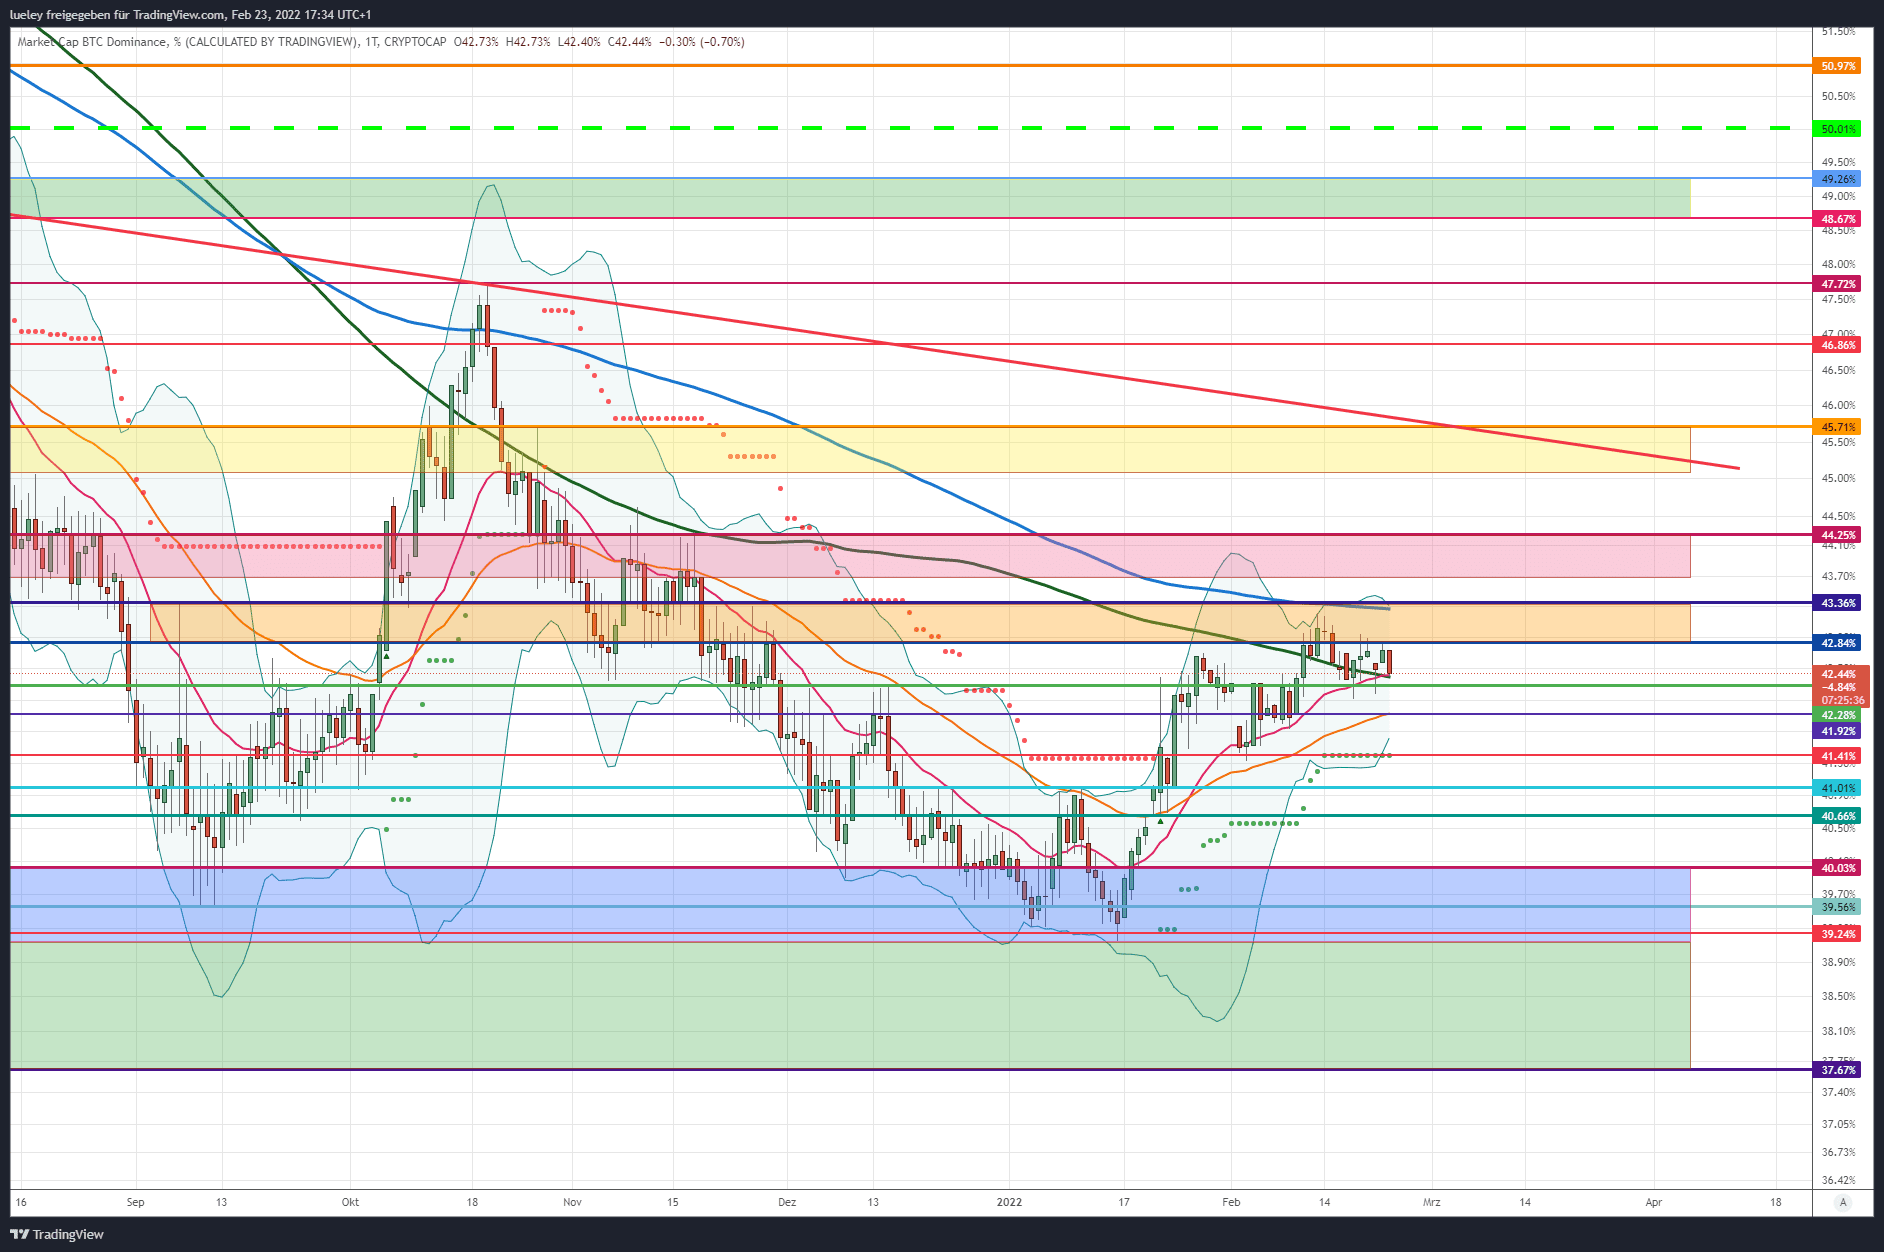
Bitcoin’s market dominance continues to falter week-on-week. BTC dominance failed to break through the lower edge of the orange resistance area at 42.84 percentage points several times. On the downside, bitcoin dominance is well protected with supports at 42.28 percent and 41.73 percent. In order to initiate a trend-following movement, it is necessary to break through the resistance level of 43.36 percent at the daily closing price in order to generate further upward potential of 44.25 percent.
BTC Dominance: Bullish Scenario
BTC dominance took a breather for the past seven trading days. The market power must now stabilize in this zone and break out sustainably above the 42.84 percent in order to increase further potential in the direction of the cross resistance of EMA200 (blue) and horizontal resist. If the BTC dominance then dynamically overcomes this strong resistance, a subsequent increase towards 43.70 percent and especially 44.25 percent can be planned. The BTC dominance should initially bounce off at this resistance level at the latest.
Only a sustained breakout above this price level confirms the month-long bottom formation in the 40 percent range. The yellow zone between 45.08 percent and 45.70 percent then comes into focus as a target area for the coming months. As a result, the key cryptocurrency Bitcoin could temporarily outperform the altcoins. If the BTC dominance breaks the 45.71 percent mark and rises above the red downtrend line, the next price target will be activated in the 46.86 percent area. Only when this resistance level can also be overcome by the daily closing price will the October high from 2021 at 47.72 percent come into focus again. If the Bitcoin dominance can also rise above this resistance level in the medium term, it is also conceivable to march through to the maximum target levels of 48.67 percent and 49.26 percent.
BTC Dominance: Bearish Scenario
Bitcoin dominance is currently unable to decide on a clear direction and lingers just above the cross-support from MA200 (green) and EMA20 (red). Only when the BTC dominance falls below 42.28 percent and thus a renewed abandonment of the two moving average lines does the support mark at 41.92 percent come into the focus of investors. Here the EMA50 (orange) has a price-supporting effect. If bitcoin dominance dynamically falls below this cross-support, the downside action extends towards the supertrend at 41.41 percent. If this support is also breached dynamically, a relapse of up to 41.01 percent is likely. This old resistance level is now acting as support.
An abandonment of this support level makes an extension of the downward movement to at least 40.66 percent likely. If this support does not hold either, a correction expansion back to 40.03 percent should be planned. However, clearer discounts can only be expected with a weekly closing price below the psychologically important 40 percent mark. Then a new test of the range between 39.56 percent and 39.24 percent would no longer be ruled out. If BTC dominance weakens again and falls below 39.24 percent, Bitcoin’s market power could fall back to 37.67 percent in the coming months. In the long term, a relapse up to the psychologically important 30 percent would be on the table again.
Disclaimer: The price estimates presented on this page do not represent buy or sell recommendations. They are merely an assessment by the analyst.
The chart images were created using TradingView created.
USD/EUR exchange rate at the time of going to press: EUR 0.88.
Sorare: collect digital football cards on the blockchain
Collect limited edition digital soccer cards, manage your team and earn top prizes.