The start of the new trading week begins similarly to the end of the previous week. Bitcoin (BTC) clearly has to give up and threatens to target USD 30,000 again if the exchange rate weakens. This downward pressure is currently noticeably spreading across the market as a whole. Most of the altcoins also have to give way.
News from China have caused a significant correction in Bitcoin (BTC) to currently 32,000 USD in the last few days of trading. A possible short-term directional decision was already pointed out in the last Bitcoin analysis on Wednesday, June 16. So far, Bitcoin has been able to stay above USD 31,000, but the negative effects on the overall market are being felt. As long as the crypto reserve currency moves within its range of the previous weeks, there is still a spark of hope that the current downward movement is only of a temporary nature.
Best price development among the top 10 altcoins:
Cardano (ADA)
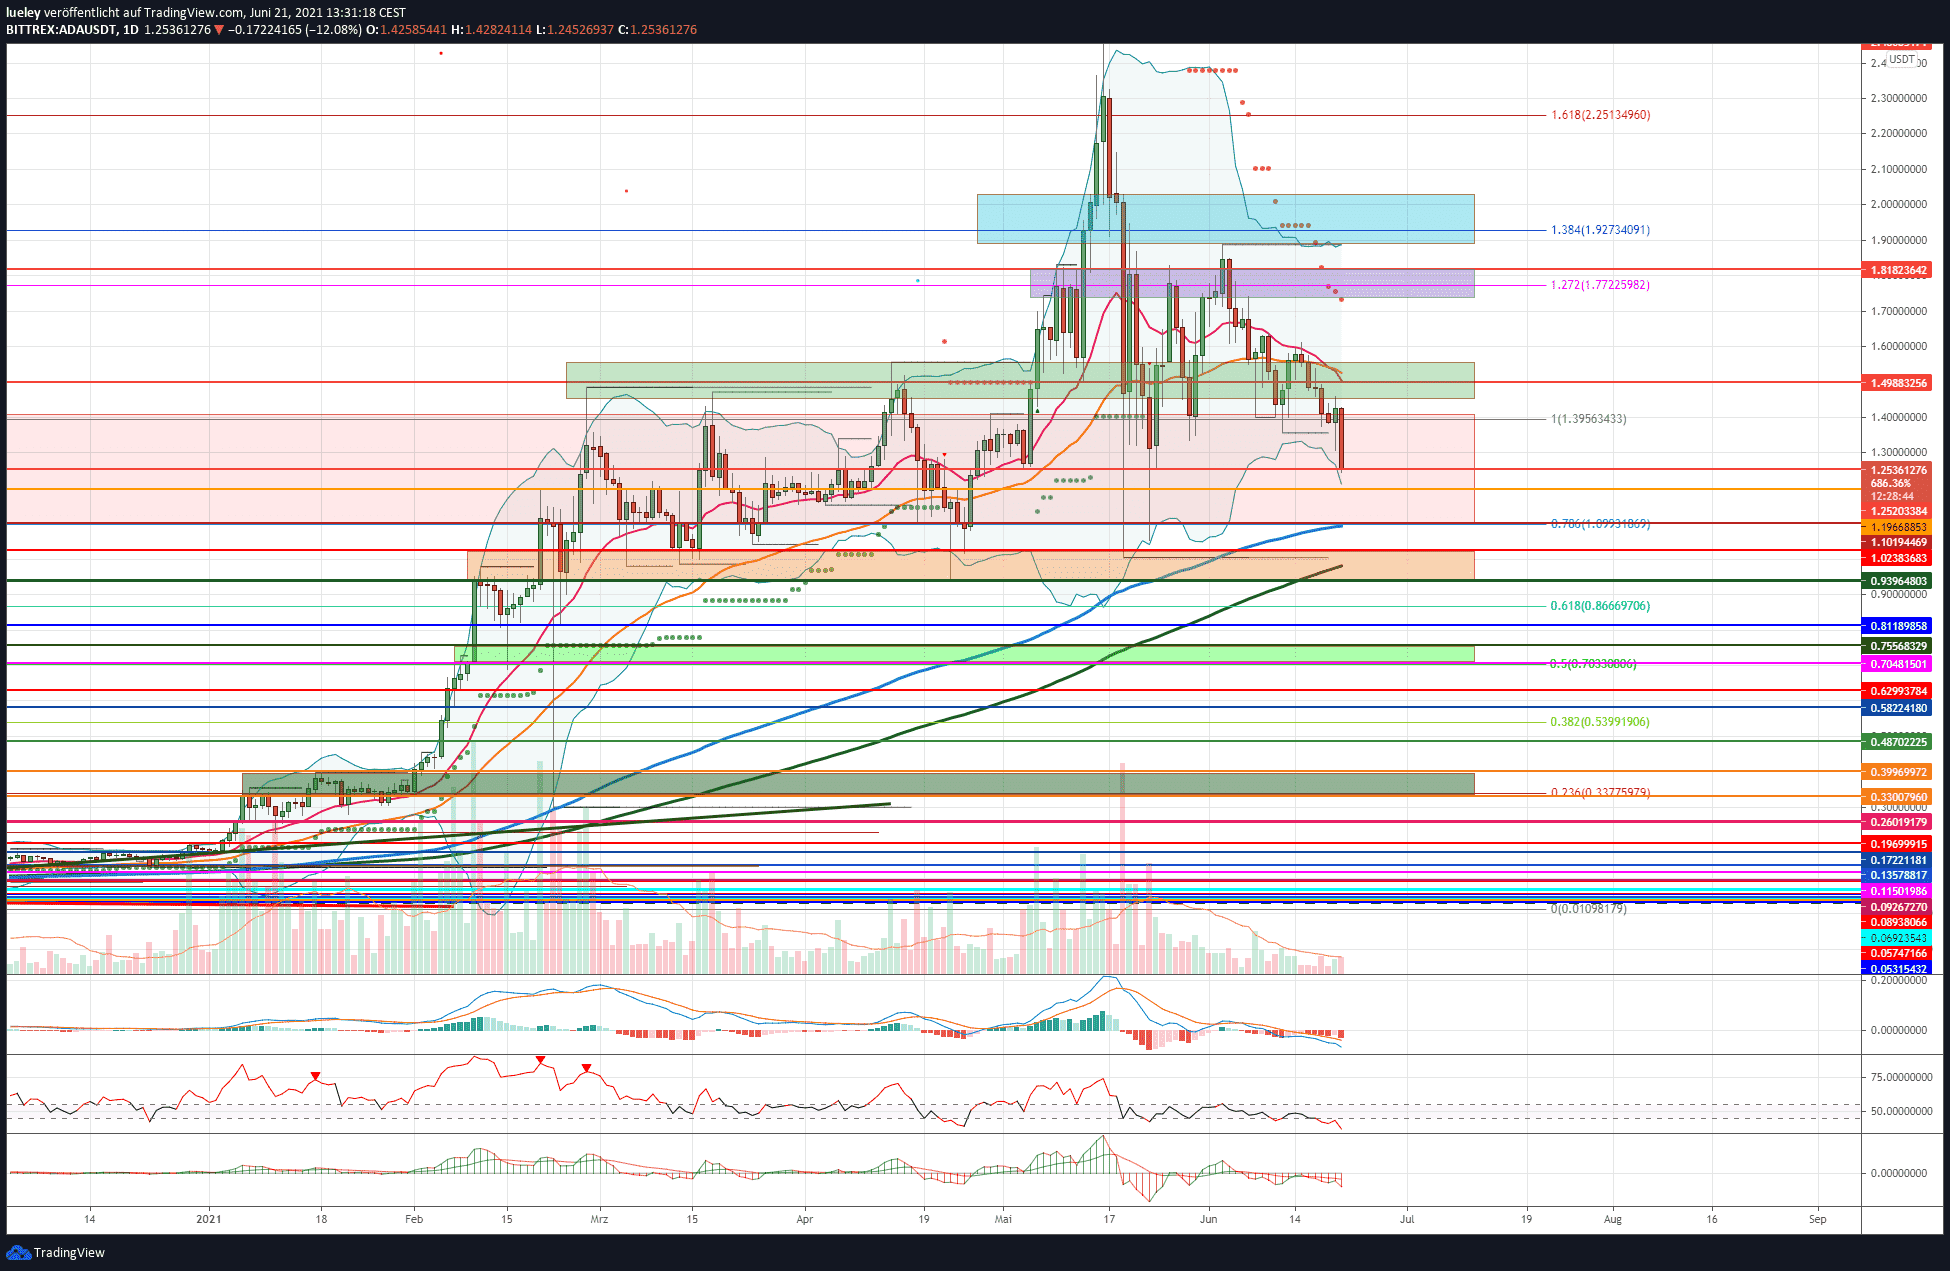
Price analysis based on the value pair ADA / USD on Bittrex
Cardano’s price fell by around 14 percentage points in the past trading week, but can hold its own relatively well. The ADA price slipped to a new low of 1.25 USD in the last hours of trading and is thus trading at 1.25 USD on the first relevant support. A short-term directional decision threatens. The volatility has noticeably gained momentum again in the last 48 hours, which is why investors should keep a close eye on the coming trading days.
Bullish variant (Cardano)
Like all other cryptocurrencies, Cardano was not spared the significant price setback. The fact that the ADA course can hold its own relatively well is to be assessed positively for the time being. Now the bulls have to prove that they once again have the strength to stabilize above the first support area at USD 1.25. If the ADA price can catch itself here and rise back above USD 1.39, the resistance at USD 1.49 will come back into focus as an important technical chart. With the EMA20 (red) and EMA50 (orange) there are two strong sliding resistances. Only when this mark is regained at the daily closing price and the area around USD 1.55 to USD 1.60 can be dynamically overcome, an increase back to the purple resist zone between USD 1.73 and USD 1.80 is conceivable. If this price mark is surpassed and the Fibonacci extension at 1.92 USD is subsequently regained, that would be clearly bullish.
If the bulls manage to break through the blue resistance zone upwards in the medium term, investors will initially focus on the area around USD 2.25. At this resistance level in the form of the 161 Fibonacci extension, the bulls will have to prove themselves again. Only when Cardano breaks through this resistance level on a sustained basis at the closing price of the day, will the view turn back towards the all-time high at USD 2.46. If the ADA rate manages to stabilize above USD 2.46, Cardano could target the next price target at USD 2.77. This chart mark is derived from the 200 Fibonacci extension. Only when Bitcoin can free itself from its sideways upward phase and set its sights on USD 50,000 will there be medium-term opportunities for Cardano to reach USD 3.63. This is where the 261 Fibonacci extension of the current upward movement runs. In the long term, the ADA price could gain further upward momentum and the overarching price target could start at USD 5.01. This resistance level is derived from the 361 Fibonacci extension and the superordinate upward movement. The maximum bullish price target continues to be the 461 Fibonacci extension at USD 6.40. As long as the overall market does not clearly gain upward momentum, these price targets are only of theoretical nature for the time being
Bearish variant (Cardano)
The bears pushed the ADA price noticeably south in the last few days of trading. If the seller’s warehouse manages to sell the ADA rate further towards USD 1.25 and USD 1.19 at the end of the day, clear resistance from the bulls is required to avert a widening of the correction. If the current correction in the overall market continues, Cardano will again fall back to at least USD 1.10. Here you can find the cross support consisting of 78 Fibonacci retracement and EMA200 (blue). Should this support also be broken, a retest of the history low at USD 1.02 should be planned. The MA200 (green) is also located just below. Again, resistance on the part of the buyer is to be expected here. As the bears push ADA course back towards the bottom of the orange support area, the situation will become increasingly bearish.
Abandoning USD 0.93 in particular should generate further selling pressure. A shortfall is likely to result in further sales in the light green area. The Fibonacci 50 retracement is found here at USD 0.70. If this support subsequently breaks, a relapse to the 38th Fibonacci retracement at USD 0.53 cannot be ruled out in the near future. Cardano will have an abandonment of this support brand corrected to at least $ 0.48. The gray support area between USD 0.39 and USD 0.33 should be mentioned as the maximum price target. This zone represents the outbreak level of the bullish rally since February 4, 2021. However, it is currently too early to assume such a sharp price correction. Investors with an affinity for risk can try to make their first purchases on the long side in the orange support zone.
Indicators (Cardano)
The RSI as well as the MACD indicator show clear sell signals in the daily chart. This picture coincides with the current chart situation. In contrast, the MACD indicator has now generated an active sell signal. Since the MACD also generated a sell signal in the weekly chart, further price declines are quite likely. The RSI is also back in the neutral zone between 45 and 55 and is also trending south. A sustained price weakness makes a trend reversal and falling prices likely.
Worst price development among the top 10 altcoins:
Ripple (XRP)
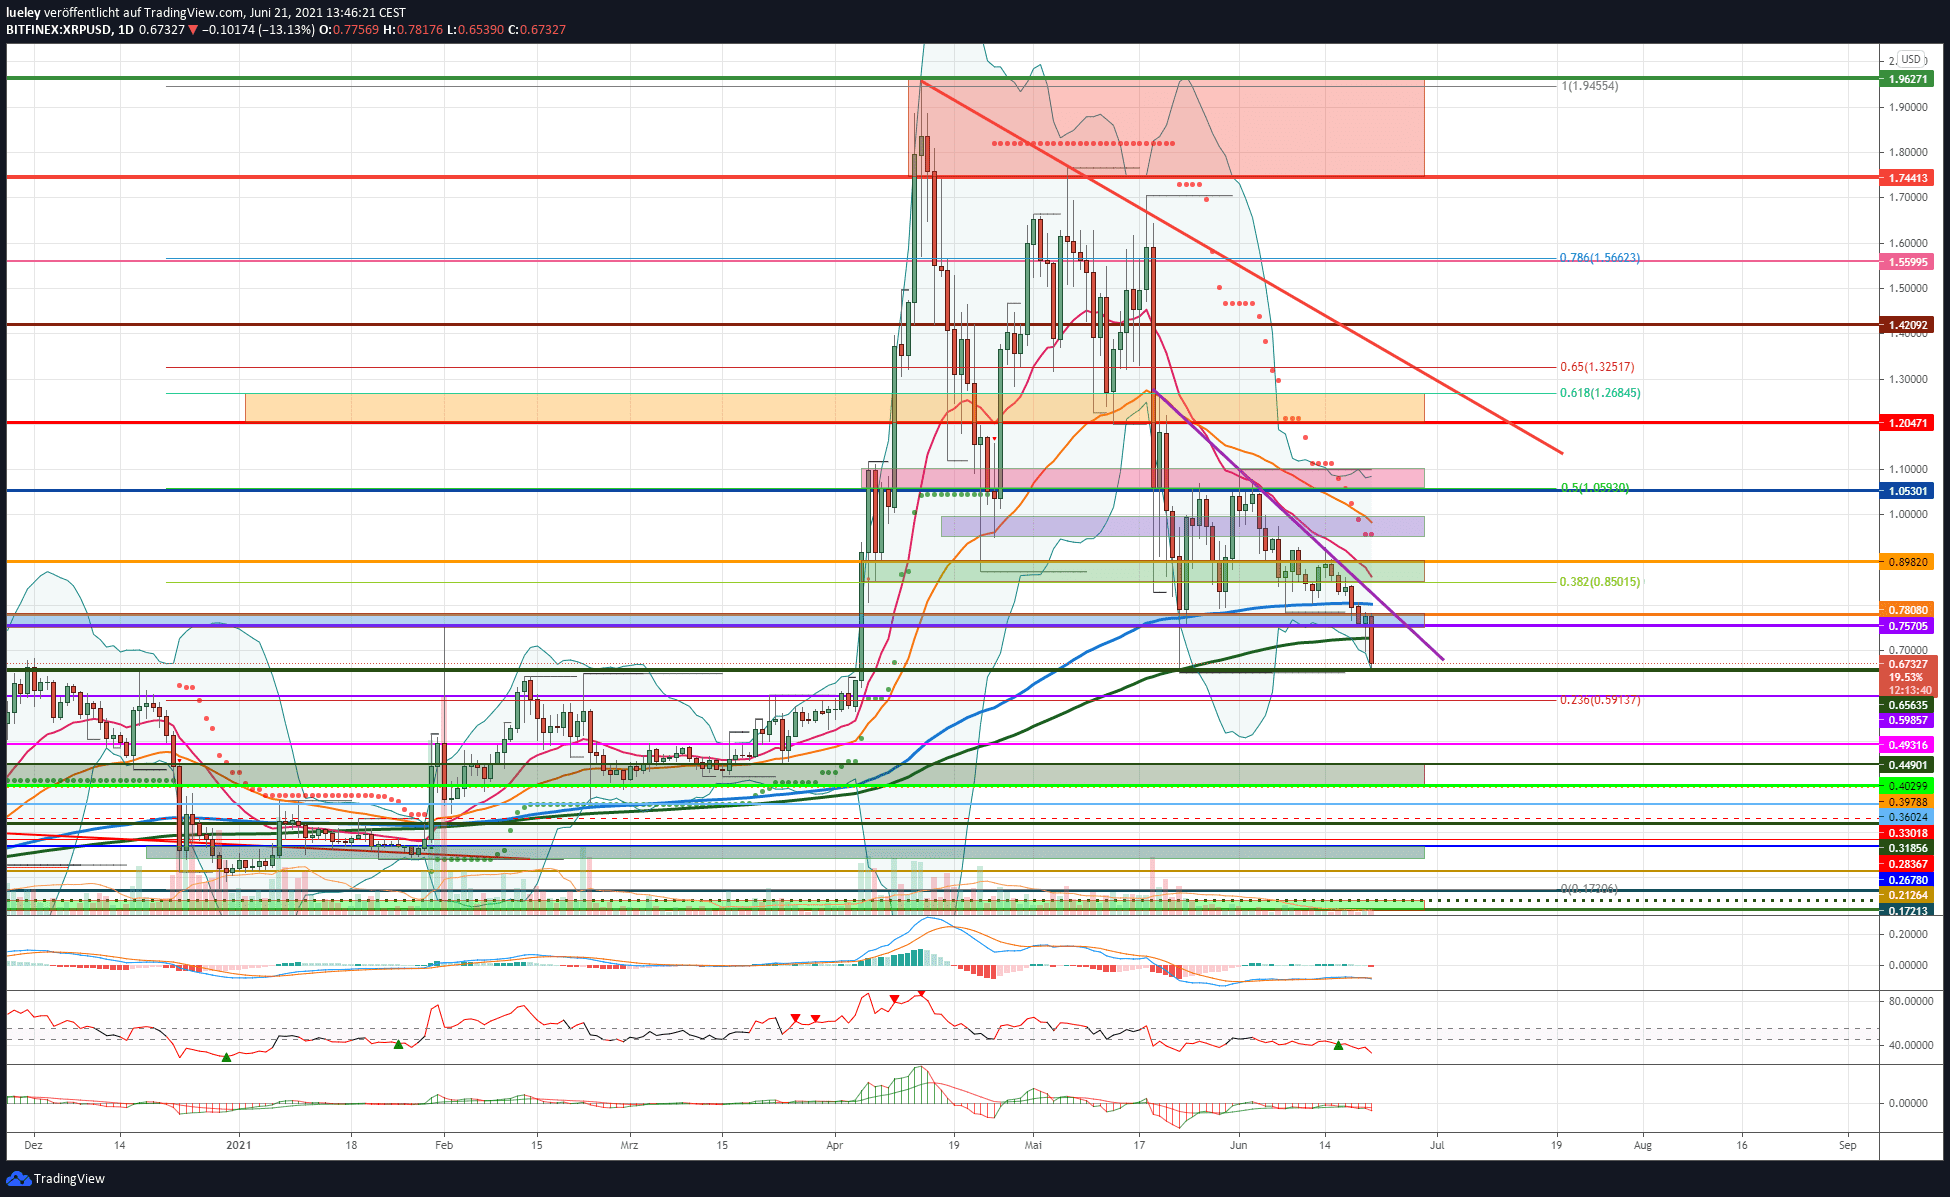
Price analysis based on the value pair XRP / USD on Bitfinex
Bitcoin’s weakness has also caused Ripple to break away significantly in the last three trading days. This means that the XRP price cannot escape the downward trend in the overall market either. At the time of this analysis, Ripple is trading at $ 0.67 just off its 4-week low at $ 0.65. In the short term, this chart mark will play a decisive role in the course of the price in the coming weeks.
Bullish variant (Ripple)
The XRP price did not manage to overcome the cross resistance consisting of the green resistance zone and the purple downtrend line in the past trading week. In addition, Ripple trades below all moving average lines in the daily chart. The abandonment of the two important moving average lines EMA200 (blue) and MA200 (green) is currently clouding the chart image significantly. The bulls must now try to keep Ripple’s price above USD 0.65 and regain the aforementioned average lines. If that succeeds and the purple downtrend line is recaptured, the green resistance area between USD 0.85 and USD 0.89 comes into focus again. The EMA20 (red) also runs in this zone. If the USD 0.89 is broken upwards, the next strong resist zone is already waiting in the area between USD 0.95 and USD 0.99. In addition to the supertrend, the EMA50 (orange) is also running here. If this zone is also recaptured, an increase into the pink area is to be expected. The Fibonacci 50 retracement is at USD 1.05.
In addition, the high from the beginning of the month is found at USD 1.10. If Ripple stabilizes above USD 1.10 and can target the orange resistance area between USD 1.20 and USD 1.26, a new directional decision will be made between the two camps. There are important horizontal resistance lines and the 61’s Fibonacci retracement. If the daily closing price of USD 1.26 is overcome, the red overriding downtrend line paired with the 65th Fibonacci retracement at USD 1.32 comes into view. If the bulls break out of this zone, the next target will be activated at USD 1.42. Above this price mark, the character picture brightens noticeably and an increase of up to USD 1.55 is to be planned. It is also true for Ripple that the overall market must also trend more clearly northwards before a price increase of up to USD 1.74 is conceivable. The range between USD 1.74 and USD 1.96 is realistic for the time being as the maximum increase target. A break through to USD 2.09 or more requires a significant recovery in the price of the crypto key currency Bitcoin. Only then would an increase to 2.62 USD (138 Fibonacci extension) and a maximum of 3.04 USD (161 Fibonacci extension) be considered for the end of the year.
Bearish variant (ripple)
If the price of Ripple slips dynamically below the USD 0.65, the current correction expands noticeably. If the 23 Fibonacci retracment at USD 0.59 also does not stop and the breakout level of April 4 is clearly undercut, the XRP price drops to at least USD 0.49. If the weakness in the market persists, the next important bearish correction target between USD 0.44 and USD 0.40 is likely. In this support area, the bulls should resist as much as possible in order to avert a price slump in the direction of USD 0.36 or even USD 0.31. If Bitcoin falls back towards USD 20,000, the Ripple price could lose further traction and possibly even head for the green support area between USD 0.26 and USD 0.24. Bullish investors should watch the chart carefully for the time being and wait until a clear reversal is seen.
Indicators (Ripple)
The RSI indicator as well as the MACD show active sell signals in the daily chart. The same can be seen in the weekly chart. Here, too, both indicators have now also generated fresh sell signals. Further price declines are likely, at least in the short term.
Top 10 stability
The sideways phase of the crypto key currency Bitcoin is also causing uncertainty among investors in the top 10 Altcoins. As in the previous week, all top 10 Altcoins have to cope with a decline in prices. Polkadot (DOT) and Cardano (ADA) with 14 percent share price decline are still doing best. The weakest of this trading week is Ripple (XRP) with a 21 percent discount, followed by Uniswap (UNI) and Dogecoin (DOGE) each with a 20 percent loss in value. There was only one change in the ranking of the top 10 altcoins. Bitcoin Cash (BCH) slipped past Litecoin (LTC) to 9th place.
Winner and Loser of the Week
After a turbulent weekend with price setbacks across the board, the market as a whole corrected significantly at the beginning of the week. Fortunately, only six of the top 100 Altcoins posted a weekly plus. The previous week’s winner Amp (AMP) can again hold its own at the top with a new all-time high and a 33 percent price premium. XDC Network (XDX) and Quant (QNT) are just as bullish with 17 percent and 13 percentage points, respectively. The long list of weekly losers is headed by Kusama (KSM) with a price discount of more than 43 percent. The newcomer Internet Computer (ICP) is again weak, again with a 37 percent discount. BitTorrent (BTT) and Qtum (QTUM) also fall significantly behind, each with a price drop of more than 32 percent. The preliminary decision on the market mentioned in the last Bitcoin analysis on June 16 seems to have been made in favor of the bears for the time being.
Disclaimer: The price estimates presented on this page do not constitute buy or sell recommendations. They are only an assessment of the analyst.
The chart images were created using TradingView created.
USD / EUR exchange rate at the time of going to press: 0.84 euros.