An encouraging DCA – The price of Bitcoin (BTC) is foraying above $25,000 again. The cryptocurrency seems to have passed a retest of an old resistance, but this success is to be confirmed on another time scale.
Successful Retest for Bitcoin Price: Weekly Close Must Confirm
Bitcoin price rises to $25,018, after falling to $23,362 on Bitfinex, today, February 17, 2023. The cryptocurrency is trading at $24,755 at the time of writing this article. Its price is currently registering a daily gain of 5.18%.
After the rejection at $25,232 yesterday, February 16, Bitcoin price retested former resistance at around the $23,400 – red line in the graph below. This resistance has given bulls a hard time many times in the past – blue circle.
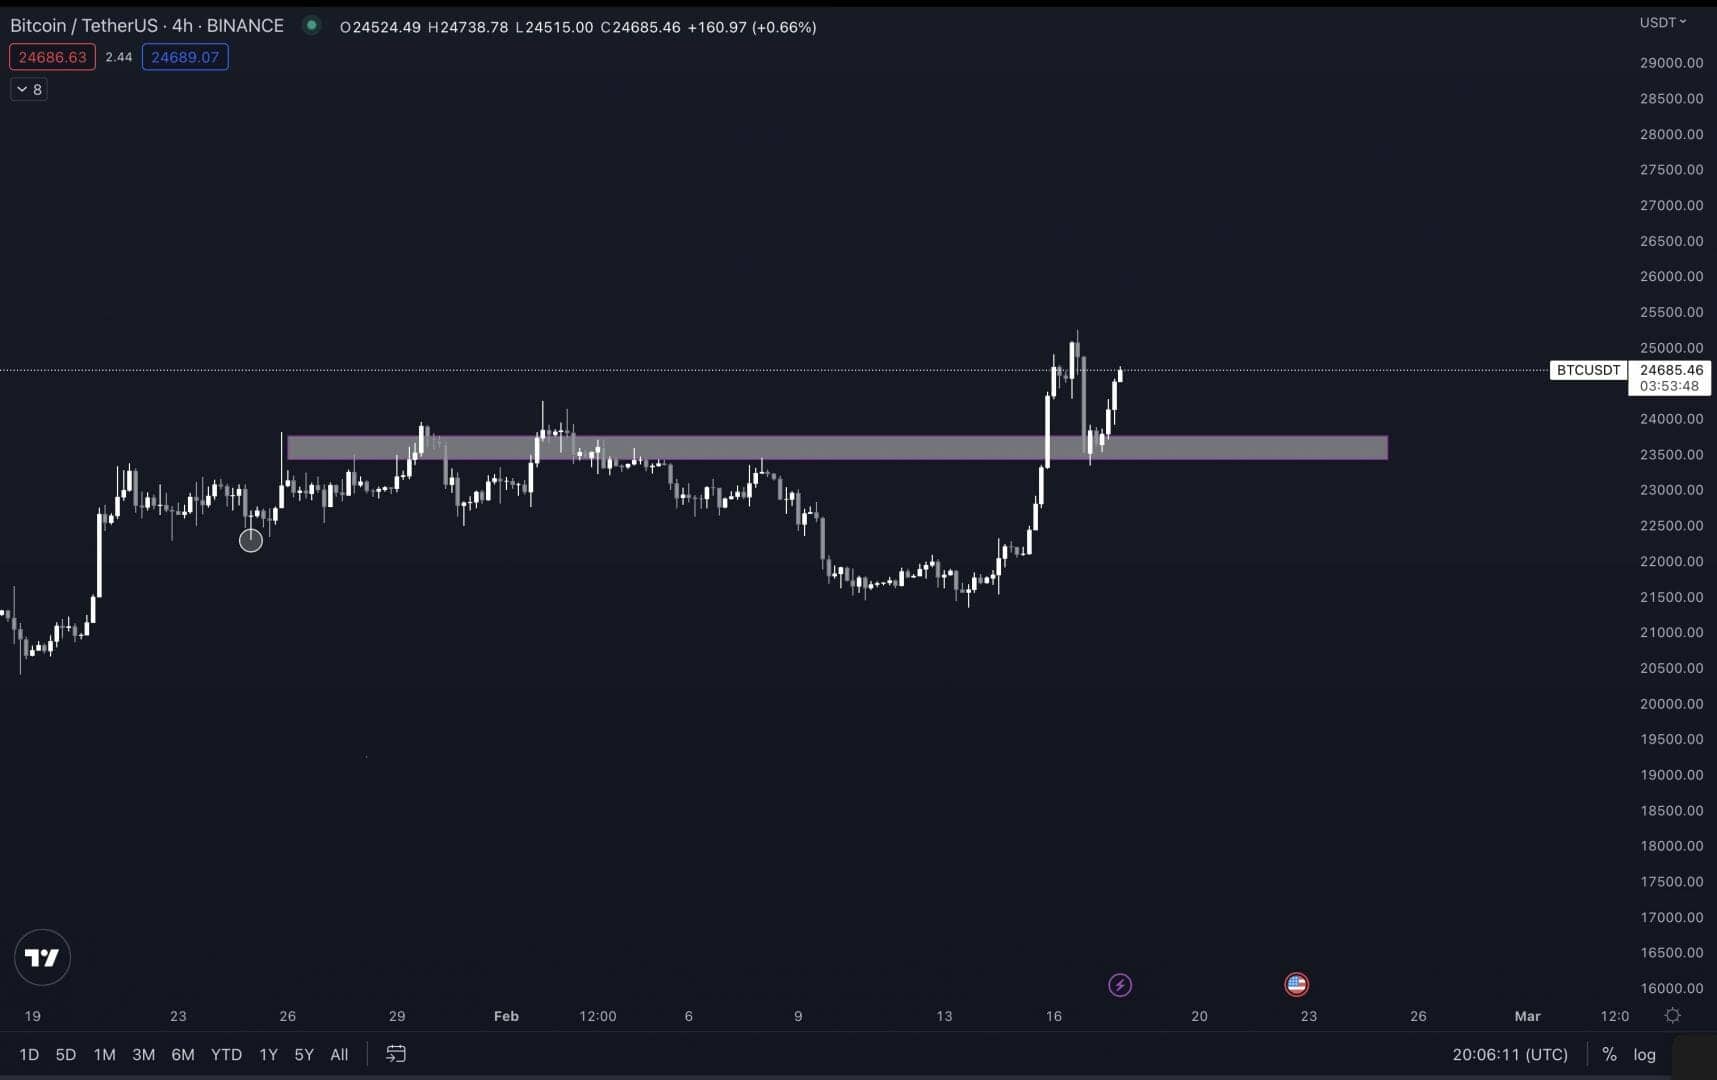
Trader Pentoshi also pointed to the retest of a former resistance zone at $23,300-$23,700, sharing a 4-hour chart of Bitcoin price.
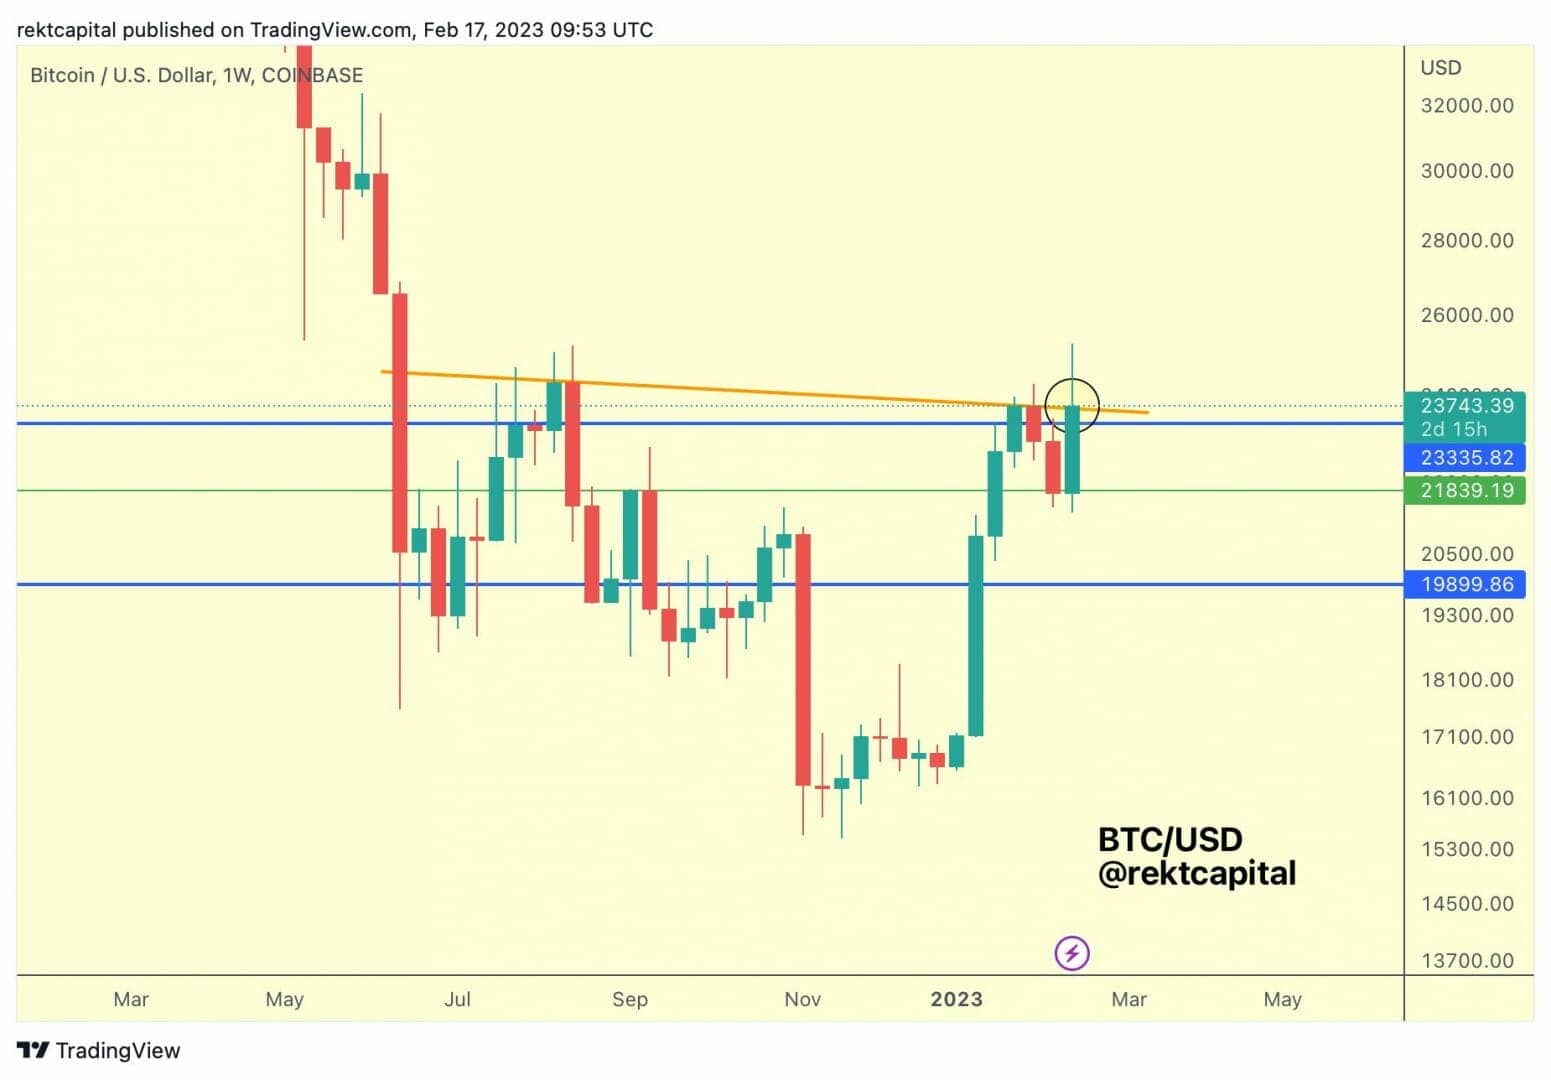
In view of bounce cryptocurrency at $23,362, as the underline the trader Rekt Capital, the price of Bitcoin then seems to have successfully retestedon a daily basis, this resistance around $23,400.
For bullish continuity, Rekt Capital believes that the cryptocurrency must now make a weekly close above the area around the $23,335 – $23,700in order to “break this zone of confluent resistance”.
>> 10% reduction on your trading fees? Sign up on Binance (commercial link) <<
Daily DCA indicator flashes: Heading back near its ATH for Bitcoin?
Can Bitcoin conquer new local near-term highs and get closer to $30,000, or are the levels around $25,000 a ceiling that the bulls are struggling to break through at the moment?
Analyst Mohit Sorout issued an optimistic outlook for the cryptocurrency, in his February 16 tweet. He shared charts to show that the indicator DCA daily bitcoin “blinked” for the fourth time since the existence of cryptocurrency.
“The ‘Daily DCA’ indicator tracks the profit/loss of buyers who have hypothetically purchased a fixed amount of bitcoins per day over the past year (365 days). »
Source: tweet by Mohit Sorout
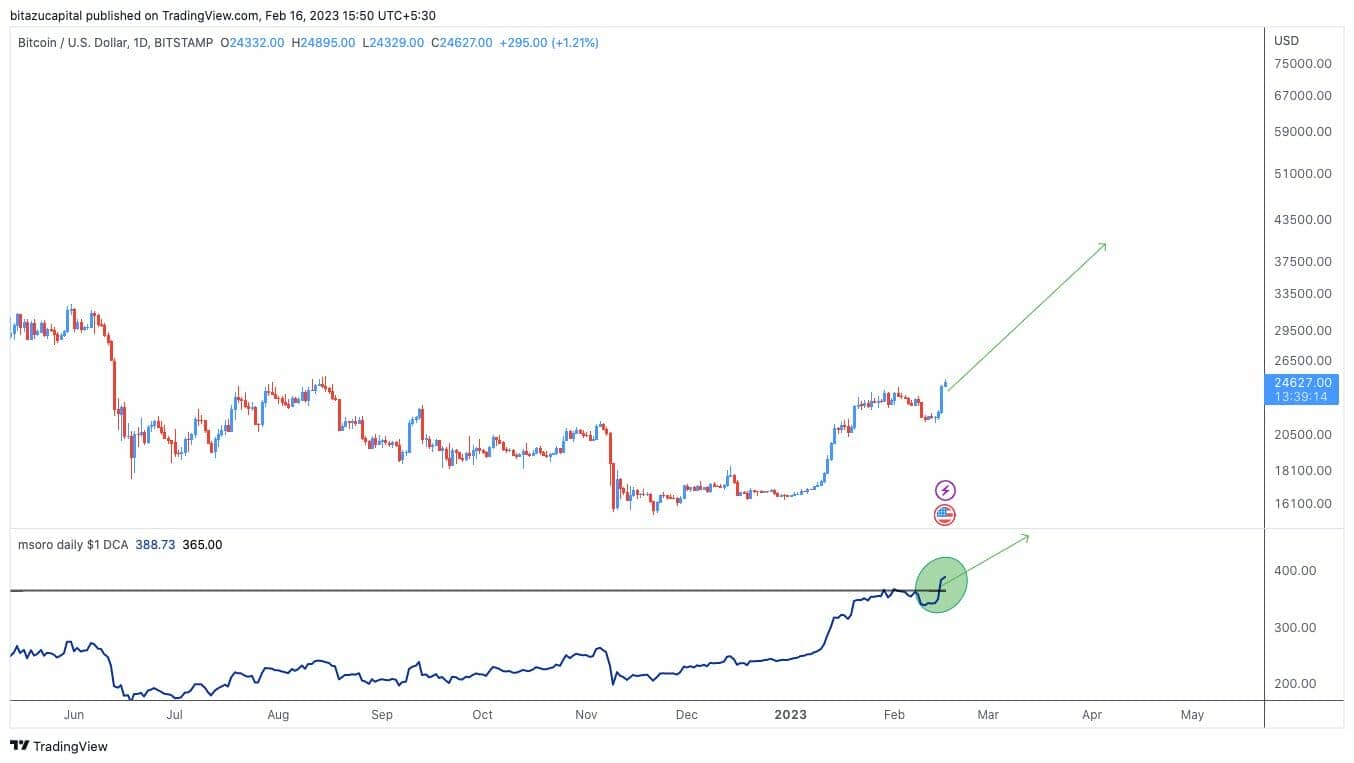
The value of this indicator exceeded 365. In the past, such an event leaked massive bullish rally follow : an increase of 7,400% in 2015, 160% in 2019, and 640% in 2020.
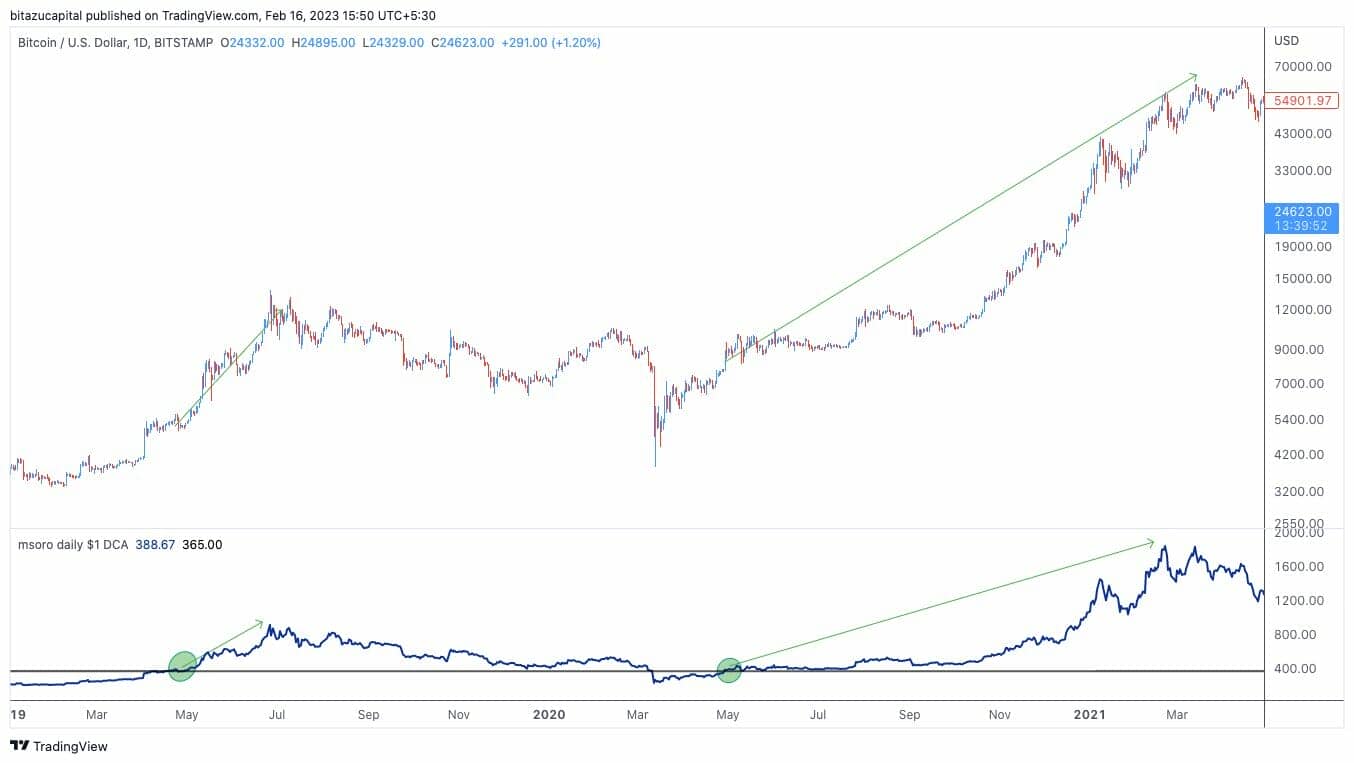
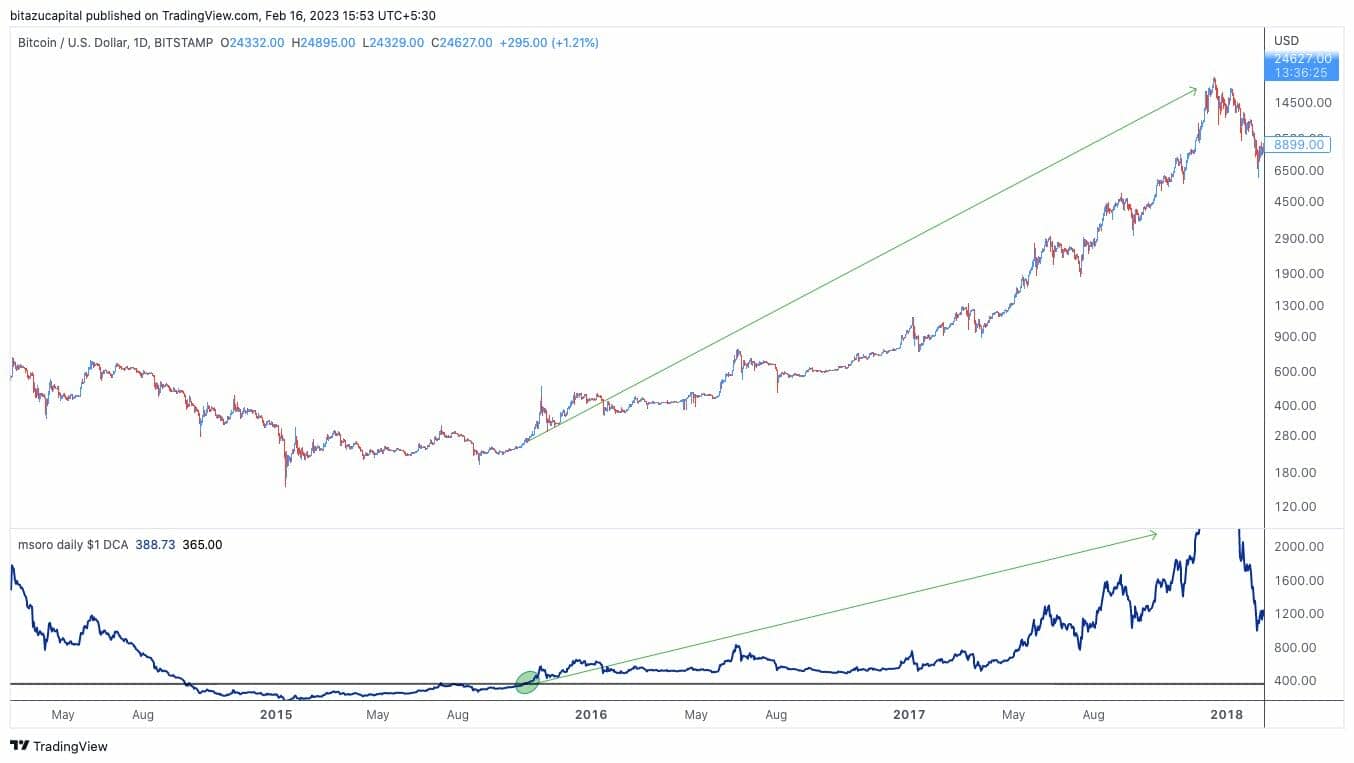
If this scenario were repeated, even with a 160% increase, Bitcoin would then return to around the $64,000a level not far from its all-time high near $69,000.
The recent explosion in the price of Bitcoin could thus be followed by other even larger increases. However, markets should watch the weekly closing level, which will provide a clearer idea of the likelihood of further bullishness.
Take advantage of the opportunities to buy low-cost cryptos that the market offers us! To not miss the opportunity of a lifetime, register quickly on the Binance platformSave 10% on your trading fees by following this link (trading link).