
Between hope and caution – The price of Bitcoin (BTC) touches $21,000 for the first time, after it lost this level during the crash on September 13th. While the markets are seeing a bullish bounce that could be the start of a sustainable bullish rally, they also need to take into account that the cryptocurrency has yet to break through key levels, which would confirm the strength of the current moves.
This Bitcoin price analysis is brought to you in collaboration with CryptoTrader™ and its algorithmic trading solution finally accessible to individuals.
A red dollar for a green bitcoin
Bitcoin price continues its ascent, 24 hours after recovering from $20,000, with a foray above $21,000 today, October 26, 2022. The cryptocurrency is trading at $20,714 at the time of writing. Its price is currently registering a daily gain of 2.81%.
The price of Bitcoin therefore continues its momentum, taking a head above the 100-day moving average which is currently near $20,910, while the dollar has been in a downtrend for the past few days. The value of the DXY currently stands at 109.76, compared to an opening price of 111.86 at the start of the week.
This drop seems to benefit other fiat currencies and risky assets. Trader Daan Crypto Trades shared a chart that shows a EUR/USD pair “ break out of its downtrend which began in February 2022. The euro has now regained parity with the dollar.
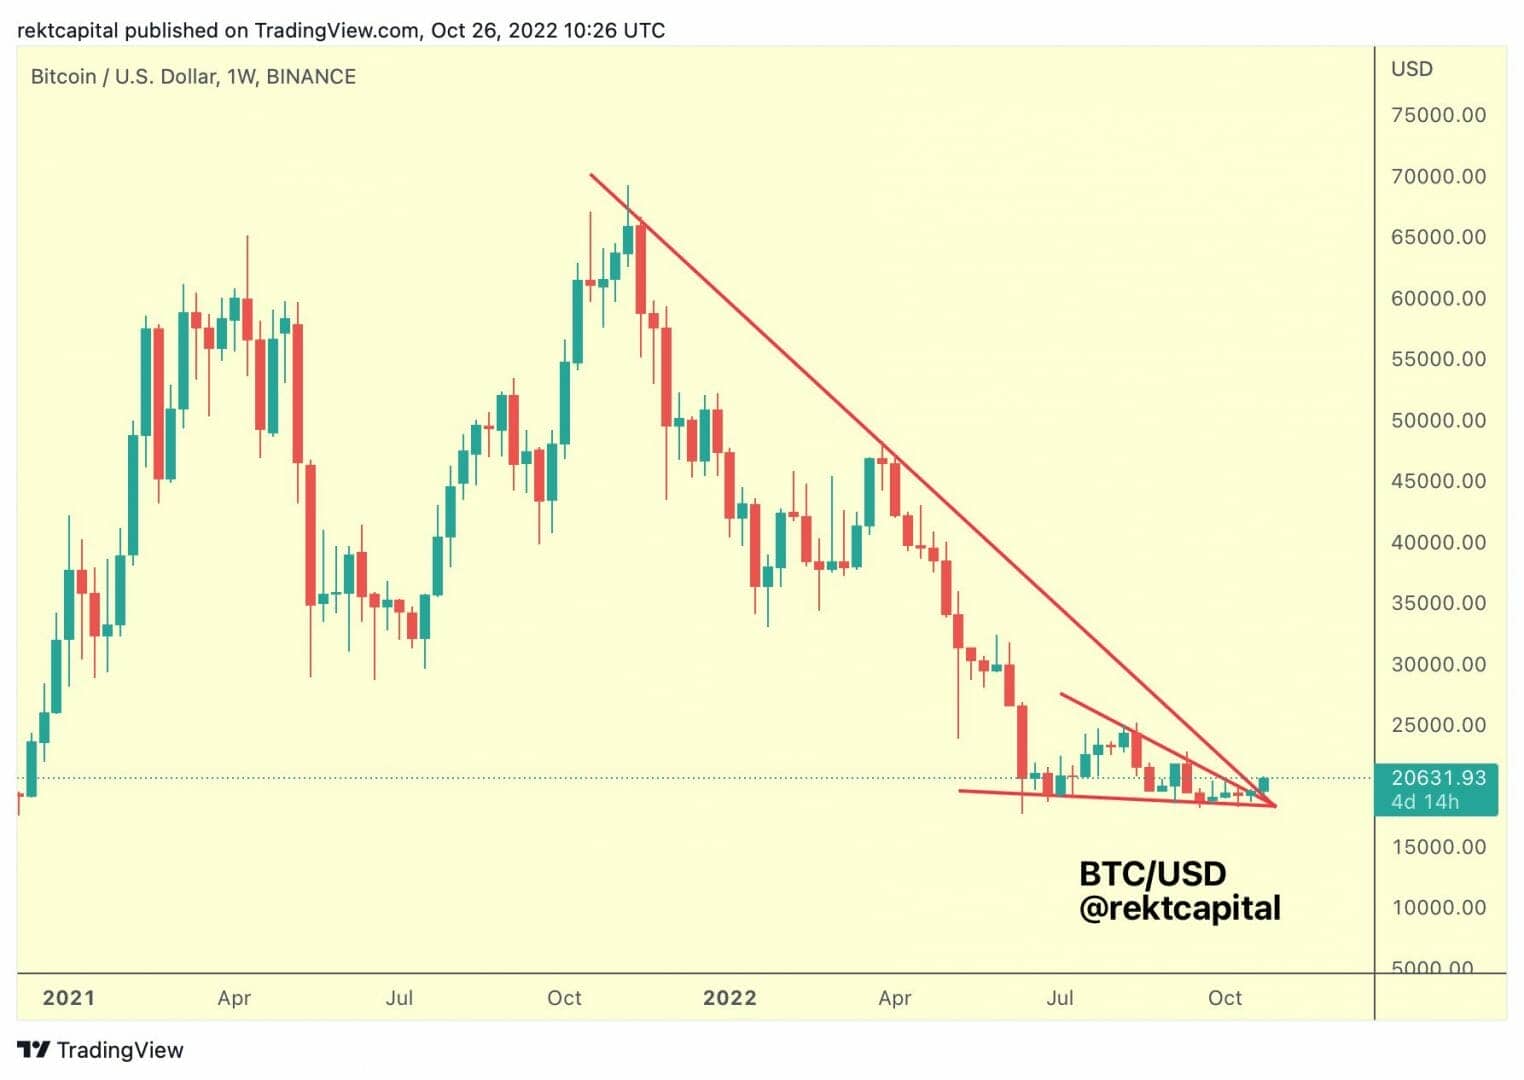
Regarding the Bitcoin price, trader Rekt Capital shared a one-week Bitcoin price chart, while emphasizing that the cryptocurrency is “ breaking the downtrend over the year “.
No major breakout yet for Bitcoin price
Despite the bullish bounce that took Bitcoin temporarily back above $21,000, markets should temper their optimism given some indicators.
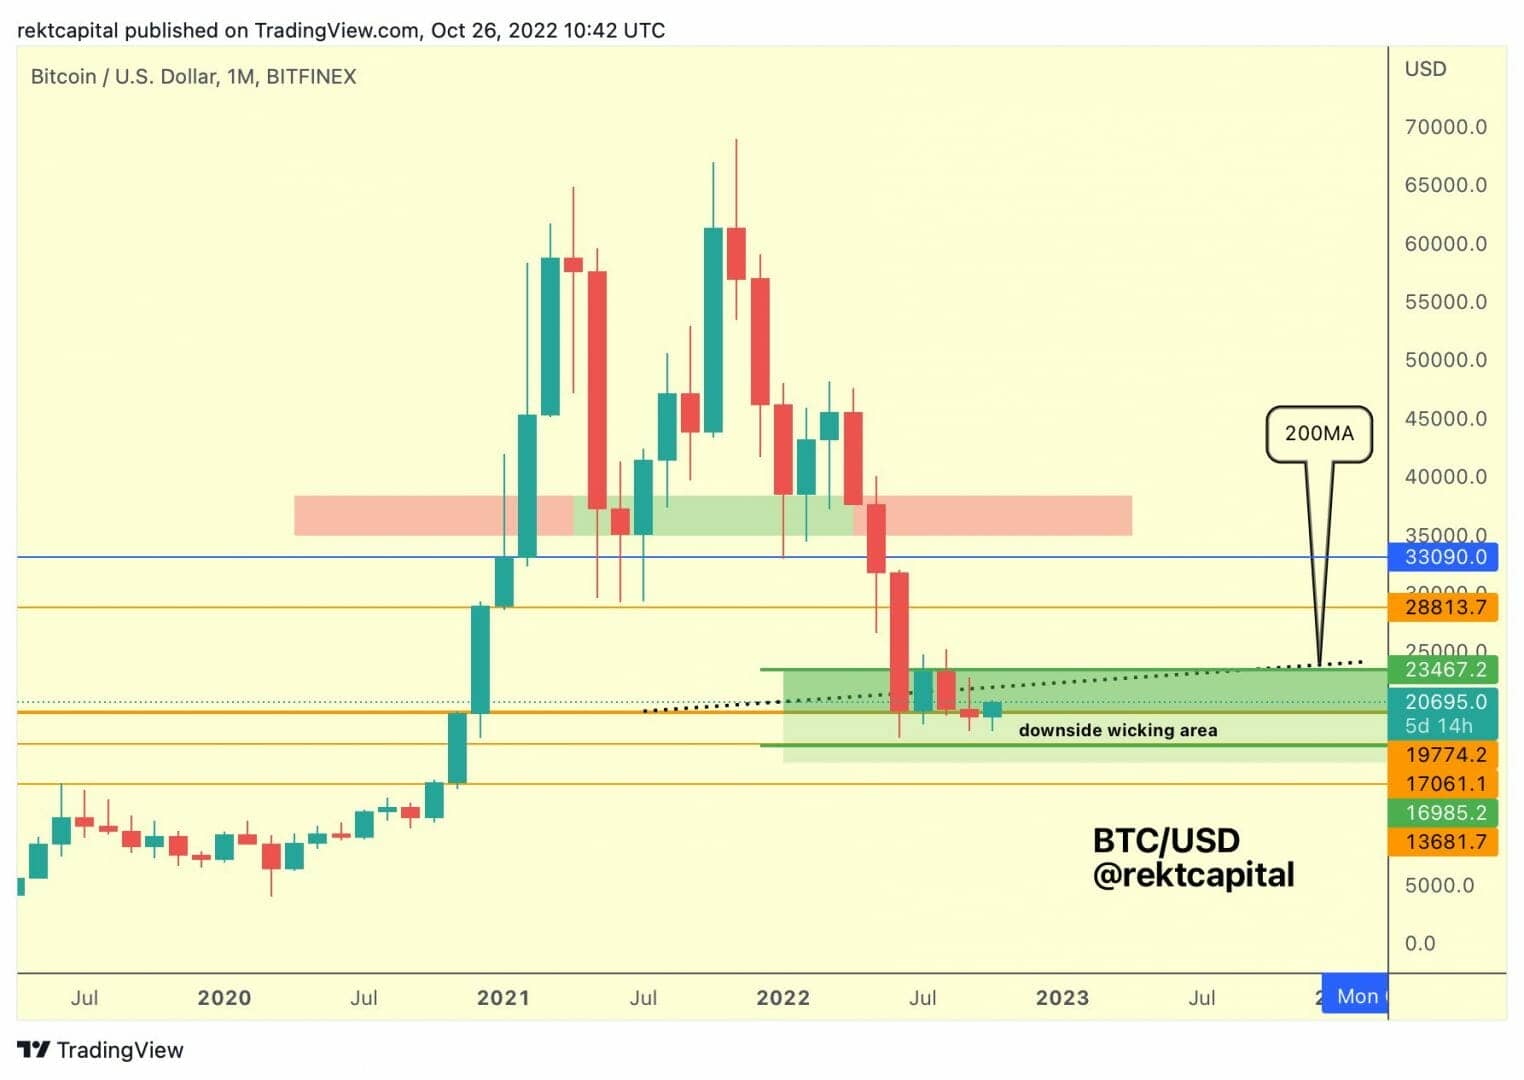
In support of the graph, trader Rekt Capital indicated that Bitcoin is still in “its historical bottom zone and has not no major break yet “. The cryptocurrency would have to break above $23,450, for the current rise to accelerate. This level roughly corresponds to the 200-week moving average.
Analyst Matthew Hyland also shared a chart that urges markets to be cautious. The daily RSI of Bitcoin is approaching a level “ who acted as a resistance since April of this year.
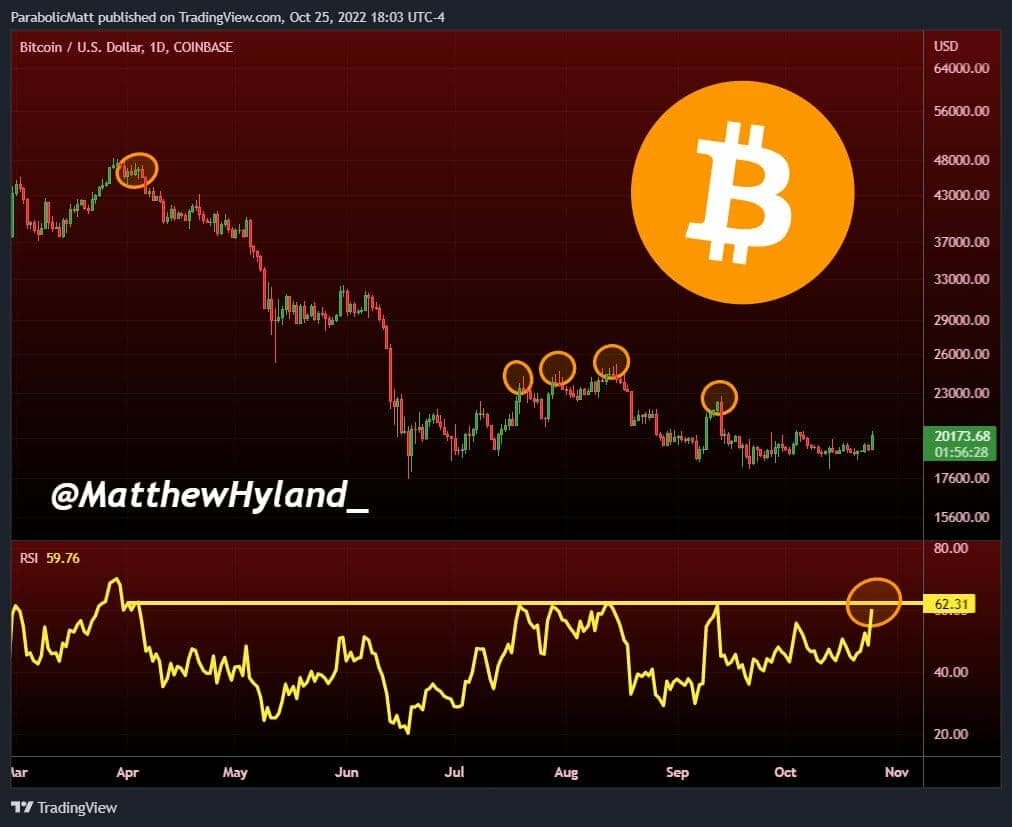
Based on past fluctuations in the value of this indicator and those in the price of Bitcoin, markets should expect further declines in the price of the cryptocurrency, if the daily RSI fails to break this resistance, with a rejection that would follow such a failure.
Pushed by a dollar in the red, the price of Bitcoin managed to break the first resistances which could have jeopardized the bullish continuity. The cryptocurrency is currently at the closing level of August 19, which had stopped the hemorrhage on the markets that day. Will the next few days see a convincing reconquest of $21,000, a consolidation above $20,000, or a return below after what would then have been a simple bullish trap?
Obtain the same results as trading professionals without investing your own time? It’s now possible with CryptoTrader™, a powerful fully automated trading solution.