
After several bullish weeks, Bitcoin (BTC) hit the psychological USD 50,000 mark and failed in the first attempt to stay above it. Bitcoin dominance also cannot benefit from the strength and has been moving sideways for 10 trading days
Bitcoin (BTC): Profit-taking initiates consolidation
- BTC course: 47,395 USD (previous week: 44,767 USD)
- Resistance / goals: $ 48,222, $ 50,325, $ 51,307, $ 53,005, $ 54,077, $ 55,817, $ 57,998, $ 59,470, $ 61,771, $ 64,896, $ 67,416, $ 69,660, $ 70,856, $ 76,472, $ 77,678
- Supports: $ 47,070, $ 46,009, $ 44,878, $ 44,147, $ 42,923, $ 41,321, $ 40,585, $ 39,240, $ 38,537, $ 37,321, $ 36,643, $ 34,899, $ 33,335, $ 32,718, $ 31,603, $ 31,010, $ 30,000 , $ 29,300, $ 28,795, $ 27,563, $ 26,404, $ 23,887, $ 22,222, $ 21,892, $ 19,884,
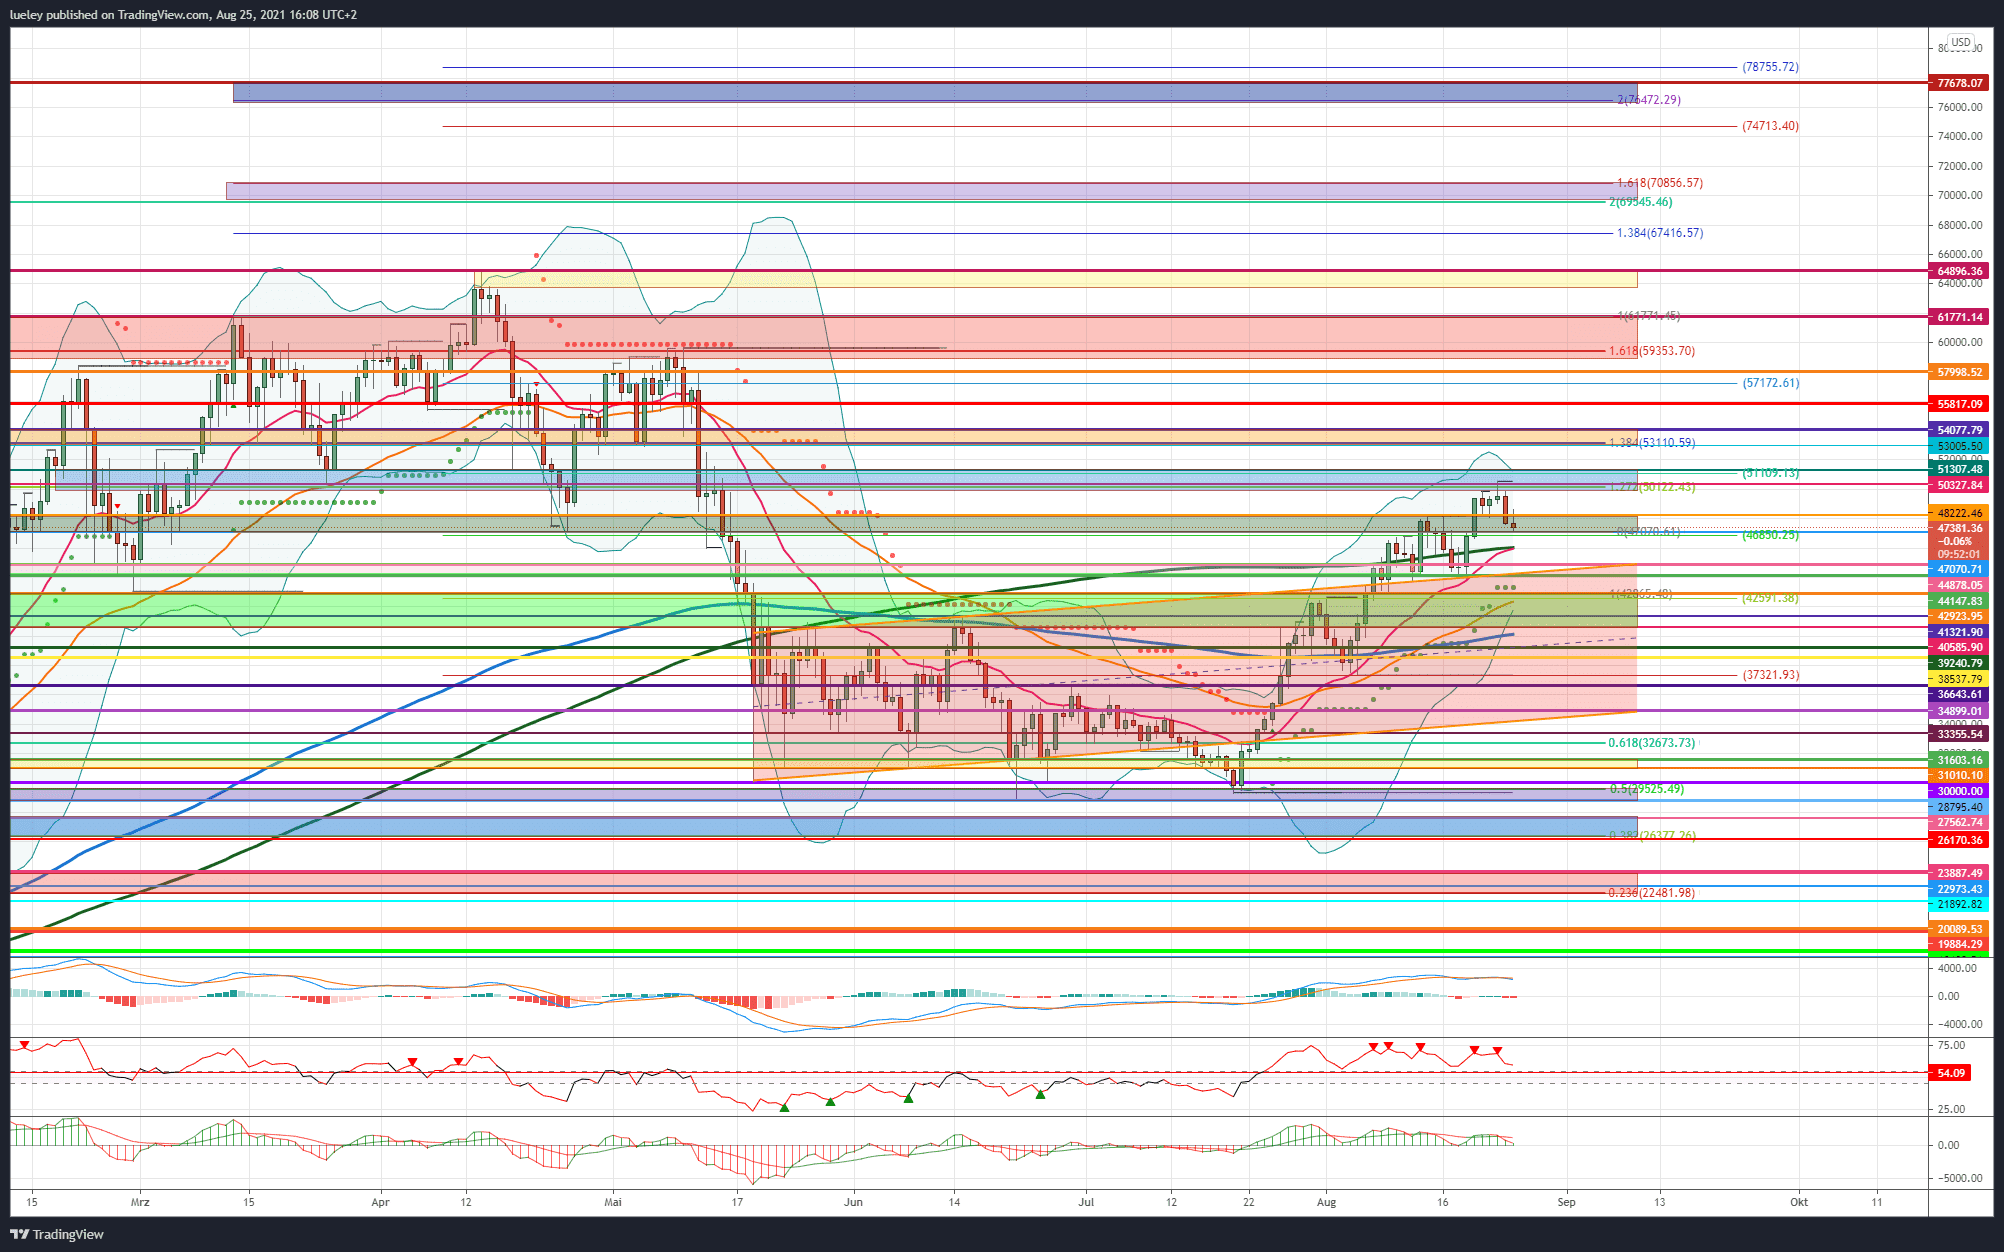
The Bitcoin bulls showed their horns in the last few weeks of trading and overran all attempts by the bears to sustainably depress the BTC price. At the beginning of the week, the BTC price rose into the strong resistance zone between USD 50,327 and USD 51,307 before more significant profit-taking occurred. As a result, the BTC price slipped back below the support at USD 48,222 on Wednesday August 25 and fell at its peak to the repeatedly discussed USD 47,070 before a slight countermovement to currently USD 47,395 began in the last hour of trading. Since many Bitcoin futures expire next Friday, increased volatility is to be expected for the time being.
Bullish scenario (Bitcoin price)
Bitcoin is currently giving way and is estimated to be a good five percentage points below its weekly high. After the strong rise of the last few weeks, this is quite healthy for its further price development. The bulls will now do everything possible to stabilize the BTC price in the green support zone. A short-term relapse to the cross support from EMA20 (red) and MA200 (green) at USD 46,009 is also unproblematic and should be used by investors for a new entry. Even retesting the range between $ 44,878 and $ 44,147 is conceivable. This is where the upper edge of the red trend channel runs. If there is a clear upward countermovement here at the latest, the first thing to do is to recapture USD 48,222 in the long term. A daily closing price above this chart level reactivates the blue resistance zone in the area of the weekly high as a new price target. Then the resistances at USD 50,327 and USD 51,307 come into focus as targets. Only when it is possible to break through the USD 51,307 sustainably, a subsequent rise in the orange resistance area between USD 53,005 and USD 54,077 is conceivable. An increase in this region would have to be seen as an important partial success.
The way towards the all-time high
If this resistance zone is also overcome dynamically, a march through to the next price target at USD 55,817 should be planned. In the medium term, the next overarching price target of USD 57,998 is then in focus. Increased profit-taking is again to be expected here. Only when investors manage to sustainably break through this resistance level and stabilize the price above is a subsequent rise to the course high of USD 59,470 conceivable. Should investors manage to break the psychological USD 60,000 mark and send the BTC rate towards USD 61,771, the chance of an attack towards the all-time high increases. If the bull camp succeeds in approaching and even surmounting USD 64,896 in the coming months, a subsequent increase up to the 138 Fibonacci extension at USD 67,416 should be planned. If Bitcoin does not turn around here, the next price target can be found in the purple resistance area between USD 69,660 and USD 70,856. In this zone, Bitcoin should initially bounce down and perform a consistency test of the old all-time high. If a stabilization succeeds above the current all-time high, the chance of a march towards USD 70,000 and beyond increases noticeably. The key crypto currency could then approach the maximum target range between USD 76,472 and USD 77,678.
Bearish scenario (Bitcoin price)
Since reaching USD 50,000, the bears have been trying to put up more resistance. The RSI and the MACD indicator have been indicating the first signs of weakness since yesterday. A fall back below USD 47,070 and subsequently below USD 44,147 would therefore be an important partial success. If Bitcoin then even slips below the support at USD 42,923 and breaks through the supertrend, there will be another battle of strength. In addition to EMA50 (orange), the lower Bollinger Band also runs at 41,321. Since this is currently trending upwards, an immediate break in this mark is not to be expected. On the other hand, if Bitcoin falls to USD 40,585, resistance from the bulls can be expected again. The EMA200 (blue) is currently also running here. Giving up this sliding support would have a signaling effect and could mean the short-term end of the bullish rally. If this area is abandoned and Bitcoin subsequently falls back below the support lines at USD 39,240 and USD 38,537, the bears will gain further strength.
The upward trend is wobbling
The downside momentum will increase and lead the BTC price to the 23rd Fibonacci retracement at 37,321. If the bears manage to break through this support, the correction will gain further strength and activate the next relevant price target at USD 36,643. If this support level is also sustainably undercut, the correction extends to at least USD 34,899. If the bulls do not come back on the floor here either, a correction widening to around USD 33,355 is likely. The 61 Fibonacci retracement, which was already fiercely contested in July 2021, also runs just below this. A dynamic break of this support level should lead Bitcoin immediately back to USD 31,603. If the Bitcoin price breaks this support as well, the downward movement expands to USD 31,010 or even USD 30,000.
For the time being, this course low in the purple support area represents the maximum bearish price target. Only if the low of June 22nd at 28,795 USD per day’s closing price would be undercut, further clear price drops up to at least 26,399 USD are conceivable. If the 38 Fibonacci retracement is undercut dynamically, the BTC rate could correct through the 25,000 USD to the 23,887 USD. However, as long as Bitcoin stabilizes above USD 42,865, the perspective should continue to be directed upwards.
Bitcoin dominance: Break out of sideways range should provide directional decision
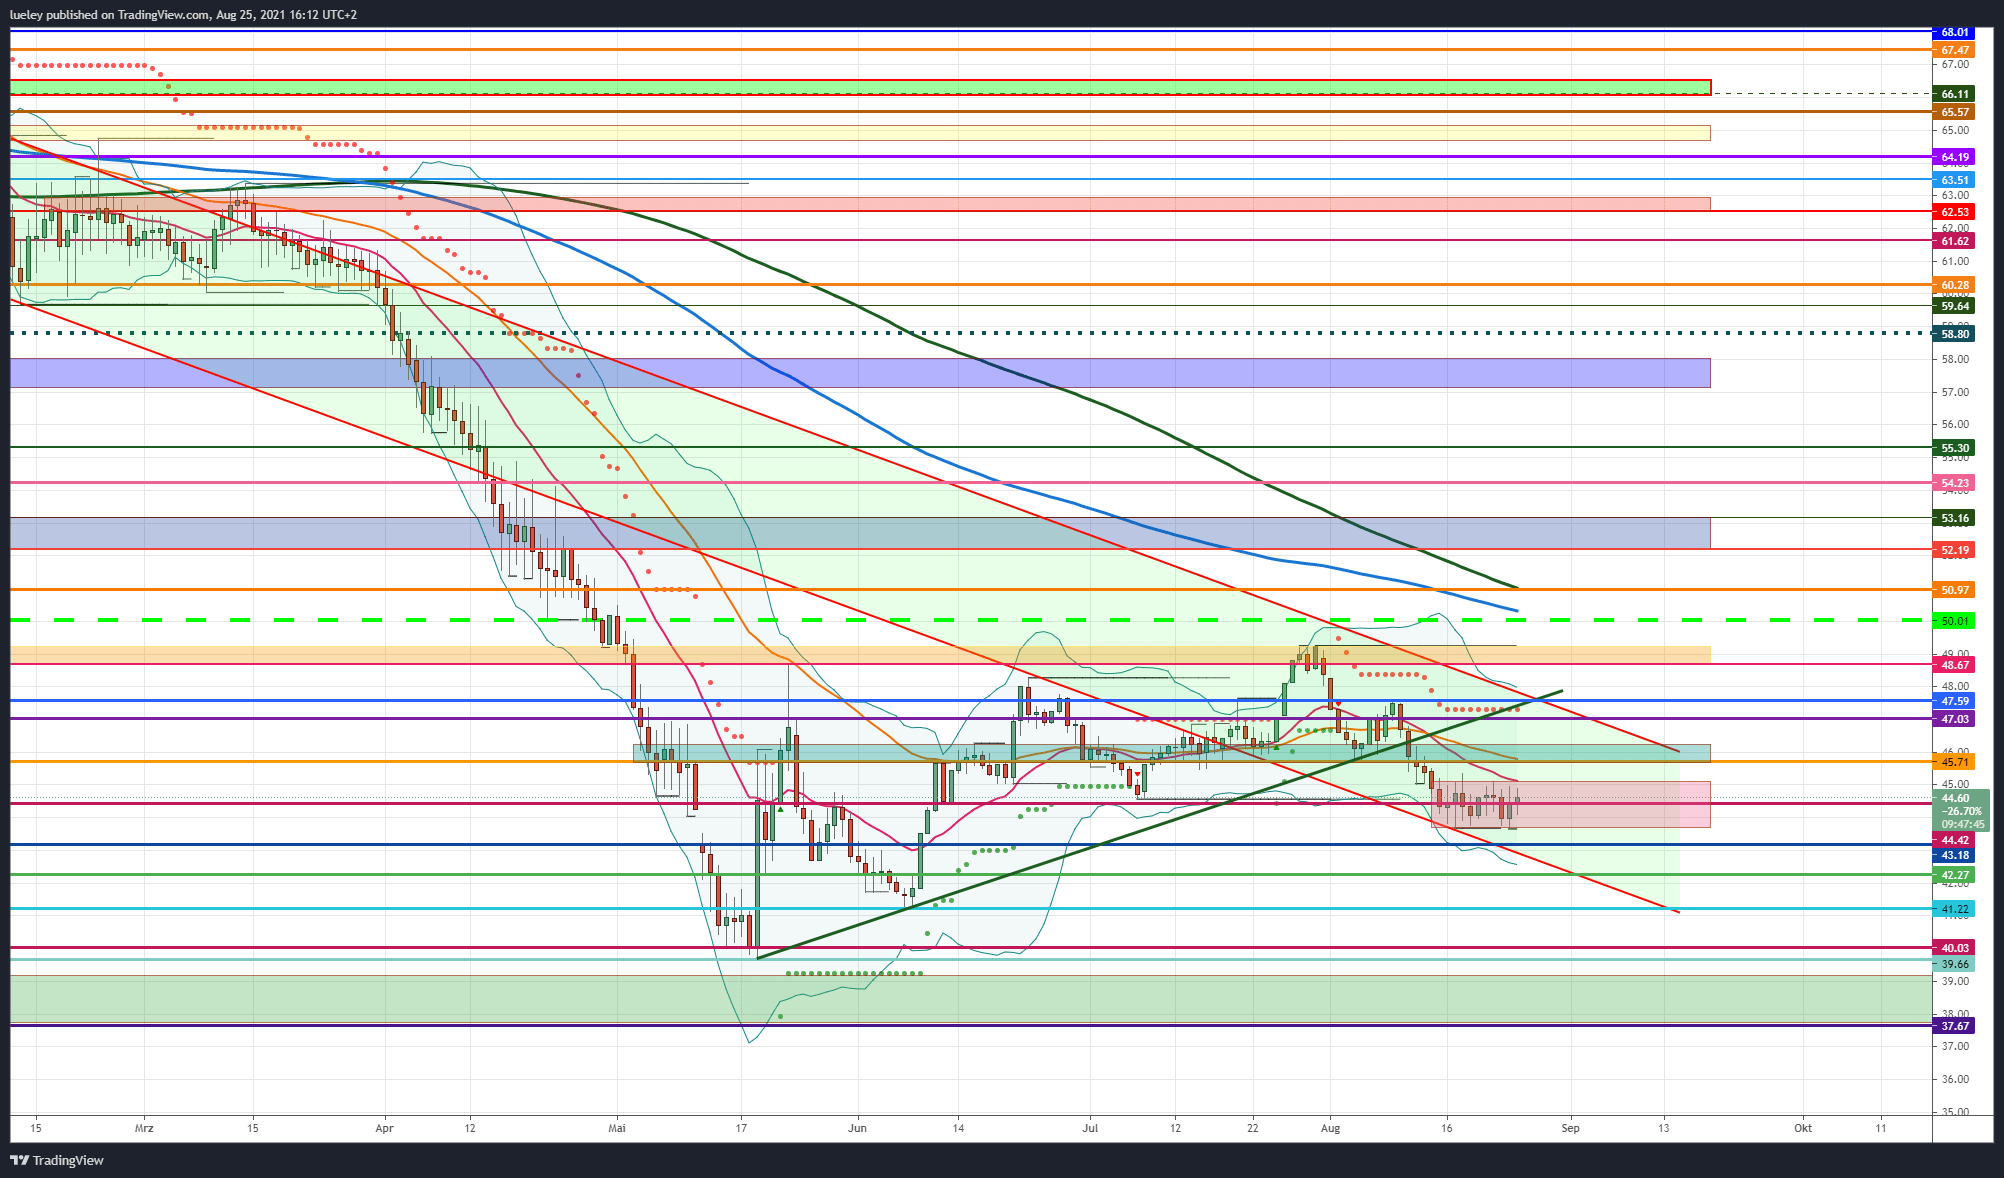
After the Bitcoin dominance consolidated back to the lower edge of the trend channel, it has been in a narrow range between 43.68 percent and 45.11 percentage points since August 15, 2021. The BTC dominance has thus oscillated around the support line at 44.42 percent for 10 trading days and is currently unable to break away in any direction. Currently, however, the trend is more towards the south, as long as the dominance of the crypto reserve currency is below EMA20 (red) and EMA50 (orange), a decline towards 43.18 percent and below is more likely.
BTC Dominance: Bullish Scenario
Despite the rise in Bitcoin, its market dominance could not sustainably recover. The constant dilution through almost daily new crypto currencies contributes significantly to this. Only when the red box is dynamically resolved upwards and thus also the EMA20 is recaptured, the resistance at 45.71 percent comes into focus again. The EMA50 can also be found here. If this mark can also be overcome and, as a result, the blue resistance zone behind, the chart image brightens up a little. Then the resistance range between 47.03 percent and 47.59 percentage points comes into focus as the first target. With the supertrend, the upper downtrend channel line and the green uptrend line, there is a bundle of potential hurdles. The upper Bollinger Band is also currently trending in this area. If the 47.59 percent is permanently skipped, a march through to the orange resist zone is conceivable.
A breakthrough above 48.67 percent activates the high from July 2021 at 49.24 percentage points as the target. If the dominance does not turn south here either, a directional decision at the psychological mark at 50.01 percent is likely. Just above that, the EMA200 (blue) is another important resistance level at 50.32 percent. A breakout above this activates the MA200 (green) at 50.97 percent as a potential target. Initially, the BTC dominance is likely to fail here. If it is possible to break both moving average lines in the medium term, an increase in the blue resistance zone between 52.17 percent and 53.16 percent should be planned. The maximum price target is to be seen for the time being at 54.23 percent. Since the abandonment of this price mark, Bitcoin dominance has not made it back to this price level, which is why an outbreak above it is very unlikely.
BTC Dominance: Bearish Scenario
As suspected since the last analysis on August 11, the BTC dominance is still on the decline. If the dominance of Bitcoin soon falls back below the support line at 44.42 percent and tests the lower edge of the developed range at 43.68 percent, a directional decision can be expected. If the BTC dominance gives up this support mark, price targets are activated at 43.18 percent, and especially 42.27 percent. The Bitcoin dominance will have to prove itself at this cross support of the horizontal support line and the lower edge of the trend channel. Abandoning this price level brings the low of June 7th at 41.22 percent into focus.
A sustained outperformance of the altcoins could also break this strong support. A relapse to the 40 percent mark is then conceivable. If the dominance of the crypto reserve currency continues to weaken, the probability increases that the annual low of 39.66 percent could also be tested and broken. A dynamic break in this support leads the dominance into the green support zone between 39.21 percent and 37.67 percent. For the time being, this area is to be seen as the maximum bearish price target.
Disclaimer: The price estimates presented on this page do not constitute buy or sell recommendations. They are only an assessment of the analyst.
The chart images were created using TradingView created.
USD / EUR exchange rate at the time of going to press: 0.85 euros.