Bitcoin continues to gain this trading week, reaching the last relevant resistance below the psychologically important USD 60,000 mark. Its dominance is also on the rise. In the short term, however, a sideways consolidation is to be expected.
Bitcoin (BTC): catching breath before attacking all-time high?
BTC course: 54,982 USD (previous week: 54,368 USD)
Resistance / goals: $ 55,817, $ 57,998, $ 59,470, $ 61,771, $ 64,896, $ 67,416, $ 69,660, $ 70,856, $ 76,472, $ 77,678, $ 85,563, $ 87,090, $ 89,982
Supports: $ 54,077, $ 53,005, $ 51,307, $ 50,325, $ 49,555, $ 48,222, $ 47,070, $ 46,040, $ 44,147, $ 42,855, $ 40,585, $ 39,240, $ 38,537, $ 37,458, $ 36,643, $ 34,899, $ 33,335 , $ 32,718, $ 31,603, $ 31,010, $ 30,000, $ 29,300, $ 28,795
Bitcoin price continued to rise in the last seven days of trading, hitting the resistance at USD 57,998 in the last few days before consolidating to support at USD 54,077 yesterday evening. Currently, the buyer camp can successfully ward off a relapse under this support. In the short term, the upward movement is likely to stall a little and probably form a sideways movement. The area around USD 48,222 should now be seen as a key support. The current strength of the bulls suggests that even the bottom of the orange support zone at $ 52,861 could be the max correction target. Many investors are currently waiting for the release of an ETF in the USA, which should spark new price dynamics.
Bullish scenario (Bitcoin price)
Bitcoin’s price movement continues to be bullish and, as has already been seen several times in recent years, could result in Bitcoin outperforming Altcoins. The increasing Bitcoin dominance also points in this direction. As long as the BTC price is trading above USD 48,222, the bulls now have the scepter firmly in hand. If the current consolidation movement breaks out of the resistance at USD 57,998 in a timely manner, a dynamic retake of the psychological mark of USD 60,000 is likely. If the bulls subsequently manage to overcome the resistance at USD 61,771, a subsequent rise to the all-time high is very likely.
If there is no significant profit-taking and the Bitcoin price breaks through the existing all-time high in the long term, a price jump towards the 138 Fibonacci extension at USD 67,416 can be expected. Above this resistance, the zone between USD 69,660 and USD 70,856 comes into focus. Particular attention should be paid to the Fibonacci 161 extension at USD 70,856. Only when this price mark can also be broken by the daily closing price, a subsequent increase in the direction of the target range of this trend movement between USD 76,472 and USD 77,678 should be planned. If Bitcoin reaches this important resistance level and breaks above it, a march through to the resist zone between USD 87,090 and USD 89,982 is possible by the end of the year.
Bearish scenario (Bitcoin price)
While the bears were able to increase selling pressure in the last 48 hours of trading, they missed the chance to break the orange support area. If a sell-off succeeds below USD 52,861, the area at USD 51,307 becomes the target mark. The EMA20 (red) is currently running here. If it falls below this, the correction should extend to USD 49,555. It is currently unlikely that the sellers will manage to push the Bitcoin rate to the key level of USD 48,222. The EMA50 (orange) and the supertrend in the daily chart are also currently running at this level. A clear break in this support level would call the upward movement into question, at least in the short term. The probability of a false outbreak then increases noticeably. If Bitcoin drops below USD 48,222 and breaks through the support at USD 47,070, the bulls will face increasing distress. A correction widening to at least USD 44,147 is conceivable.
The MA200 (green) currently runs along this cross support. If this is undercut, this is another bearish indicator and should allow Bitcoin to correct back into the range between USD 42,855 and USD 40,585. The EMA200 (blue) is currently also running in this zone. If the BTC rate continues to correct and falls back below USD 40,585, a retest of the low at USD 39,240 is likely. Here the bulls have to stabilize Bitcoin in order not to jeopardize the upward trend. If this fails and the bears continue to increase selling pressure, a relapse to the 23rd Fibonacci retracement at 37,321 should be planned. This support represents the last chance for the bulls to avert another crypto winter. A maximum retest of the July 27 outbreak level at USD 36,643 would be conceivable. As long as Bitcoin can defend USD 48,222, the bullish scenario is currently preferable.
Bitcoin dominance: price reaches MA200
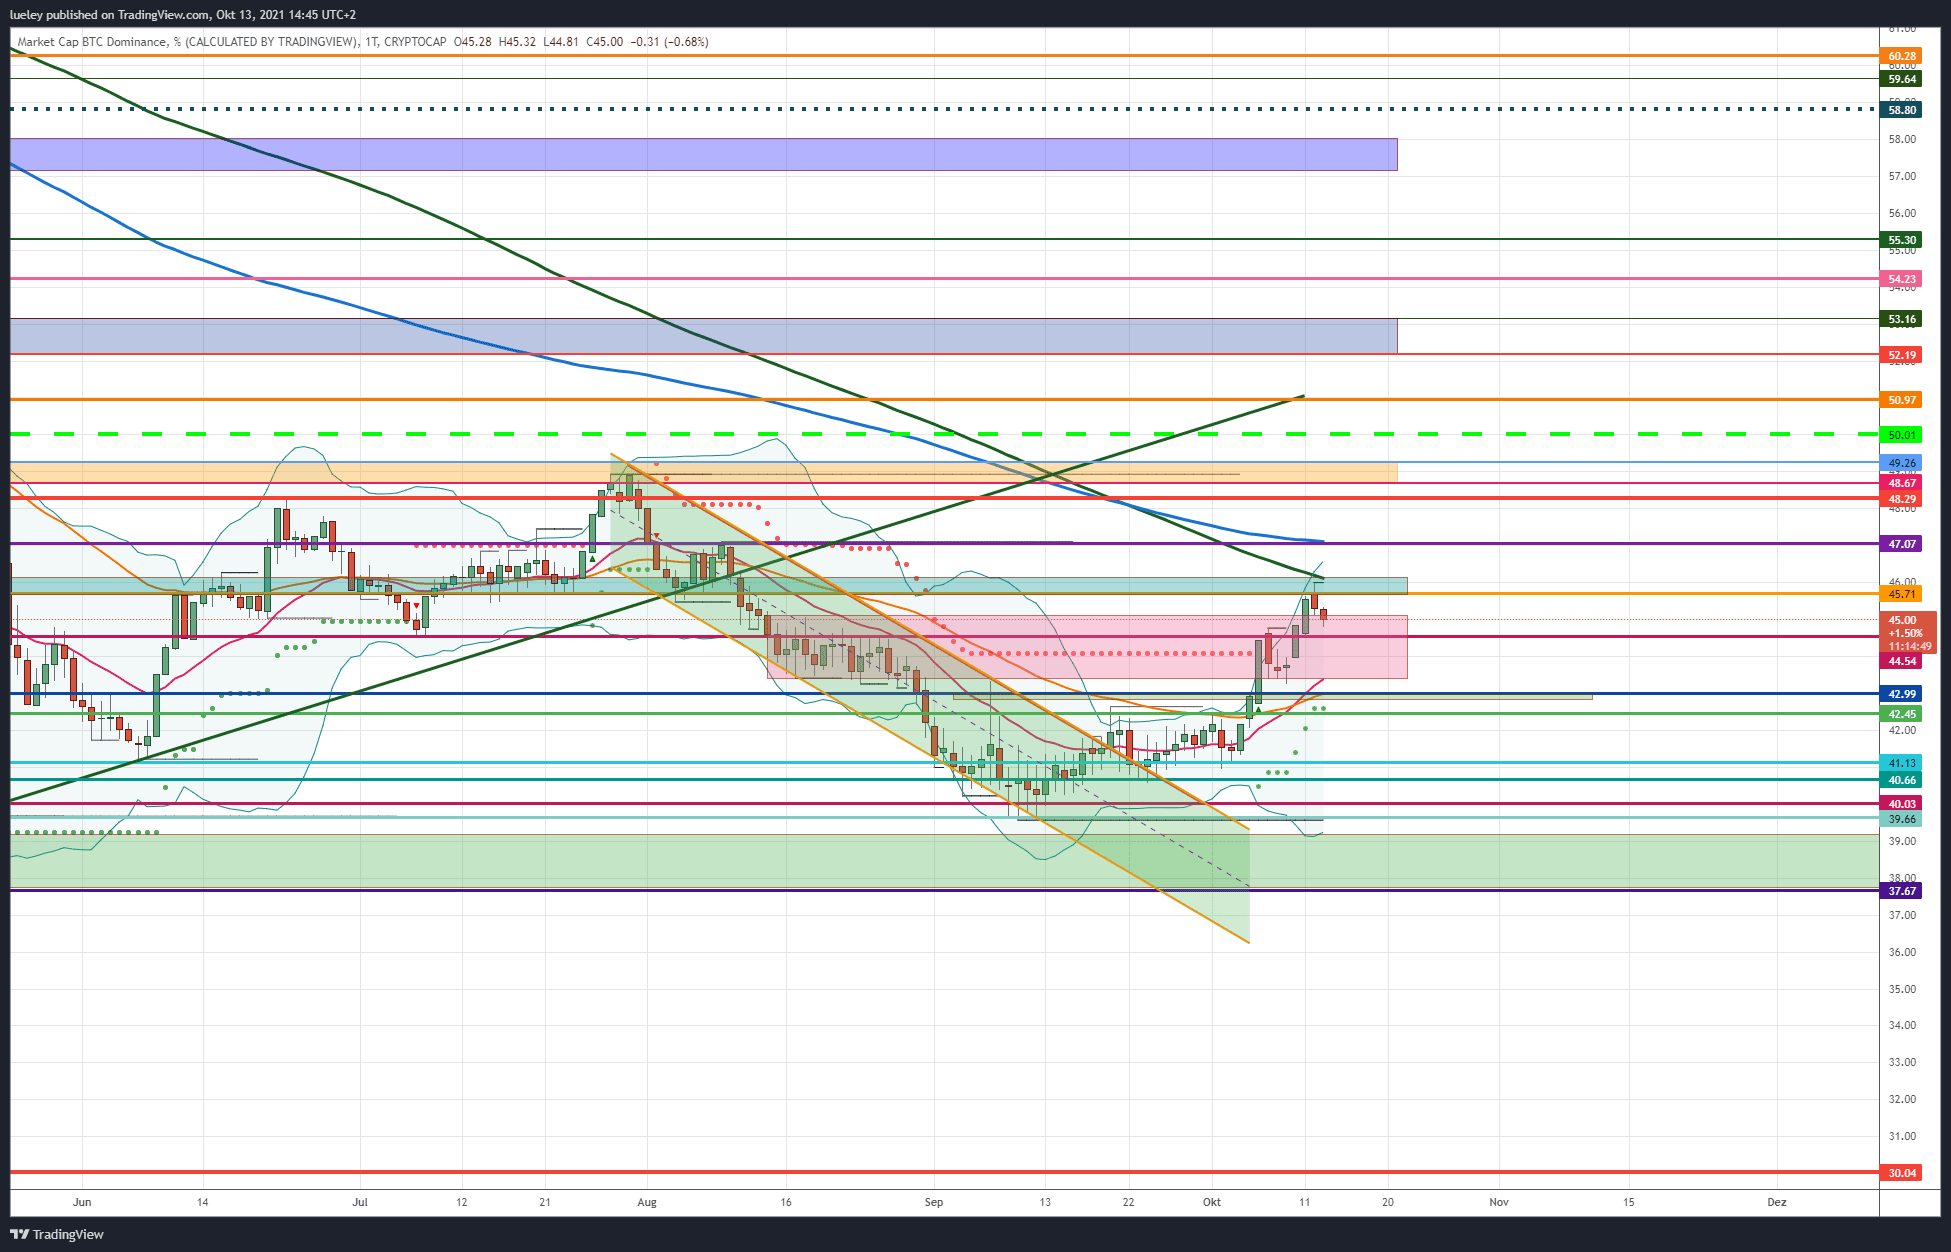
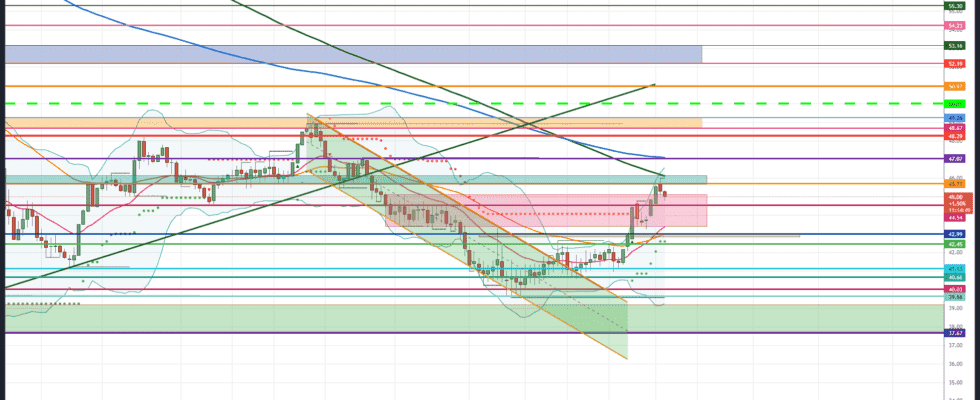
Bitcoin dominance continues to rise this trading week as well. After the strong resistance at 44.54 percentage points was dynamically overcome, market power rose to the 46 percent mark on Tuesday, October 12th. Although the BTC dominance was not able to break through the resistance at 45.71 percent by the daily closing price, the weekly high of 46.00 percent was only close to the MA200 (green). Currently, the dominance of the crypto reserve currency is falling slightly back in the direction of the old resistance at 44.54 percent, but is currently trading slightly above it at 45.00 percent.
BTC Dominance: Bullish Scenario
Bitcoin dominance is also on the rise this week, hitting a new monthly high. There is currently a slight countermovement towards the south, which is not surprising after the steep rise in the last few weeks of trading. This increase was also evident in the performance of the Bitcoin course, which increased in value more than most of the top 100 Altcoins. The BTC dominance is now trading well above the moving averages EMA20 (red) and EMA50 (orange). As long as the market dominance can now stabilize above 43.41 percent, the view should be directed further north. Ideally, the BTC dominance already hits the 44.54 percent north to make another attempt at the MA200. If the BTC dominance can stabilize above 44.54 percentage points, the first thing to do is to sustainably overcome the resistance at 45.71 percent. Then the MA200 comes back into focus at 46.14 percent.
If this resistance level is also broken by the end of the day, a subsequent increase in the direction of the cross resistance at 47.07 percent should be planned. Here the EMA200 (blue) is paired with a relevant horizontal resistance level. At this level, there is likely to be another setback towards 46.00 percent. If, on the other hand, the Bitcoin dominance overcomes the EMA200 sustainably in the coming trading weeks, a breakthrough of up to 48.29 percent is conceivable. A rise above this activates the next target area in the form of the orange resistance zone. The resistance range between 48.67 percent and 49.26 percent should be named as the maximum increase target in the short term. In the medium term, Bitcoin dominance could even target the psychologically important 50 percent mark and rise to 50.97 percent. For the time being, however, an increase above this resistance level is not to be expected.
BTC Dominance: Bearish Scenario
Today, Wednesday, October 13th, the BTC dominance is coming back a little and is again below the 45 percent mark. Should the BTC dominance continue to decline and correct back below 44.54 percent, the lower edge of the red price range will come into focus again. The EMA20 (red) is currently running here, which is why a ricochet to the north is to be expected at the first attempt. If, on the other hand, the EMA20 is undercut dynamically, a decline in dominance up to cross support at 42.99 percent is likely. A short setback of up to 42.45 percent cannot be ruled out. Between 42.99 percent and 42.45 percent there are two strong supports with the EMA50 (orange) and the Supertrend. If the BTC dominance breaks through these supports on a sustained basis, there is a risk of a stronger bearish movement back to the monthly low of 41.13 percentage points.
This is where the decision is made as to whether the BTC dominance will break away again towards 40.66 percent and below. A dynamic undershoot should lead the Bitcoin dominance back to the 40 percent mark. The annual low of 39.66 percent would then be within reach again. If the dominance of the crypto reserve currency does not stabilize sustainably at this key brand either, there is a risk of a correction expansion into the green support zone between 39.21 percent and 37.67 percent in the medium term. Surrendering the 37.67 percent would have far-reaching consequences for Bitcoin’s market power. The market dominance could then decline further and, in the long term, even target the psychologically important mark of 30 percentage points.
Disclaimer: The price estimates presented on this page do not constitute buy or sell recommendations. They are only an assessment of the analyst.
The chart images were created using TradingView created.
USD / EUR exchange rate at the time of going to press: 0.86 euros.