
Still in a channel, the Bitcoin seems to be showing signs of strength in recent days. As usual, let’s combine technical analysis, the order flow (the study of volumes), the data on chain in order to draw the best conclusions!
This technical analysis is offered to you in collaboration with the Coin Trading and its algorithmic trading solution finally accessible to individuals.
Bitcoin/USD technical analysis
From a technical analysis perspective, Bitcoin appears to be in an interesting setup. The level of $36,000, having been worked on a lot, did not yield. We are now slowly moving towards the $45,000 level, constituting the upper part of the channel in which we have been evolving for 3 months.
If we manage to break through this level, I would expect buyers to surge around the $48,500 level initially. These levels, as we will see later, seem particularly interesting to me, because they are levels of Fair Value Gap (GVF). This means that we broke through these levels via high momentum candles, and therefore low volume levels remain.
However, the market has a habit of filling these gaps, hence the fact that I monitor them particularly.
This scenario seems particularly interesting to me, in particular because many stakeholders are currently in fear. They dare not redeem, and a nice bullish candle could make them FOMO (Fear Of Missing Out, the fear of missing an opportunity).
Elsewhere, the NASDAQ, the US index to which Bitcoin is highly correlated, appears to be showing signs of strength.
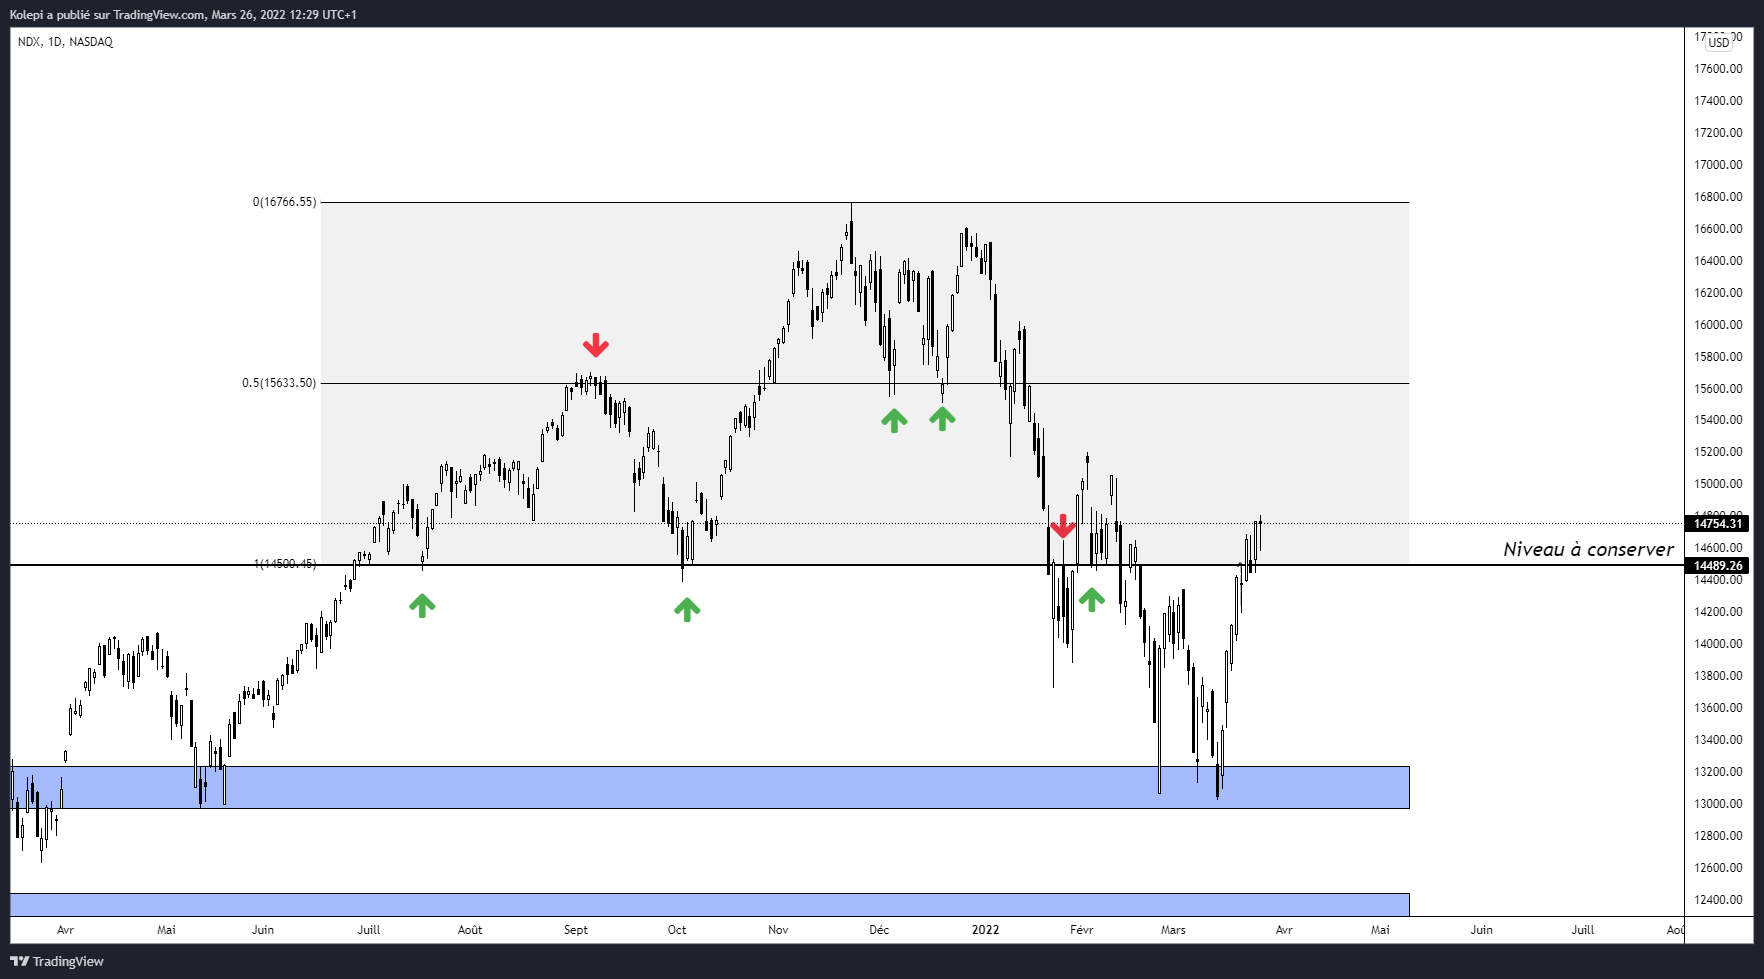
If it maintains this level of $14,500, we could see it approaching $15,500, an important pivot point for the year 2021.
But then why am I not thinking of a move higher than $55,000? Mainly because beyond the Ukraine-Russia conflict, the rate hike by the Federal Reserve should also have an effect on the financial markets. Historically, rate hikes have been followed by crashes.
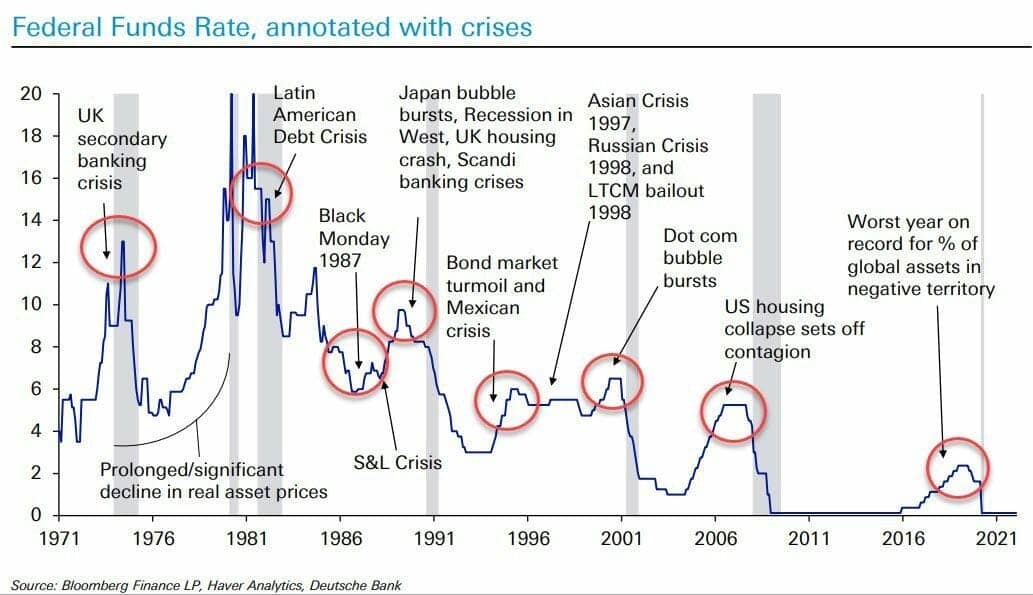
With this in mind, it is difficult for me to think of a new ATH for Bitcoin and the crypto market more generally.
Orderflow, study of volumes, studies of financial data
The reason why I only use a few indicators is because a majority are related to price and not volume. The price is only the result of incoming and outgoing volumes, hence my preference to observe this metric.
Thus, we will see here some rather particular graphs about the volume.
Weekly Volume Profile
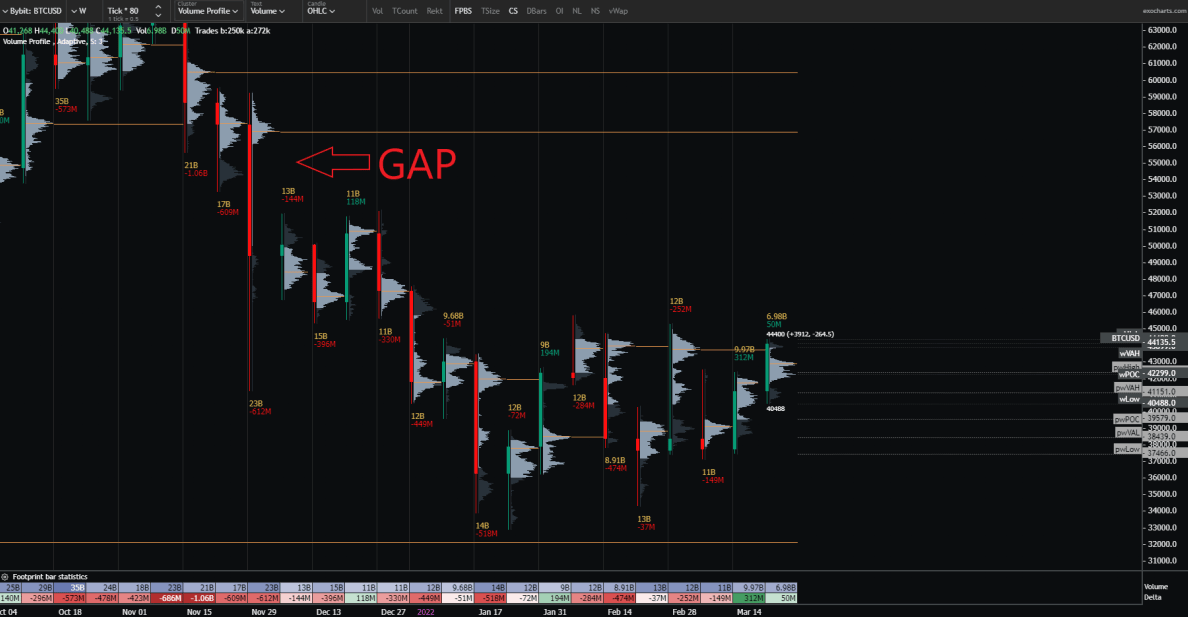
The volume profile lets you know at what price level the volume is. Volume will act as a likely rebound zone, as it will be more difficult to break through a level where there is a lot of volume, and there will be much more volatility in low volume levels. This is also what explains the difficulty we are currently having in crossing the $45,000-$46,000 level.
A lot of volume resides on this level, so it is very difficult to pass it. If it is crossed, and ideally successfully retested, the $50,000 – $55,000 will seem much closer.
Only, I strongly doubt a retest in this specific case, why?
Quite simply, a lot of traders are currently shorting $45,000. If we come to cross this level, Stop Losses and liquidations should be linked.
What happens when short position stop losses are hit? This triggers a buy, and therefore an even more powerful bullish move.
Clearly, a movement of the type would have a “champagne cork” effect which could be very interesting, to follow!
Net Long / Net Short
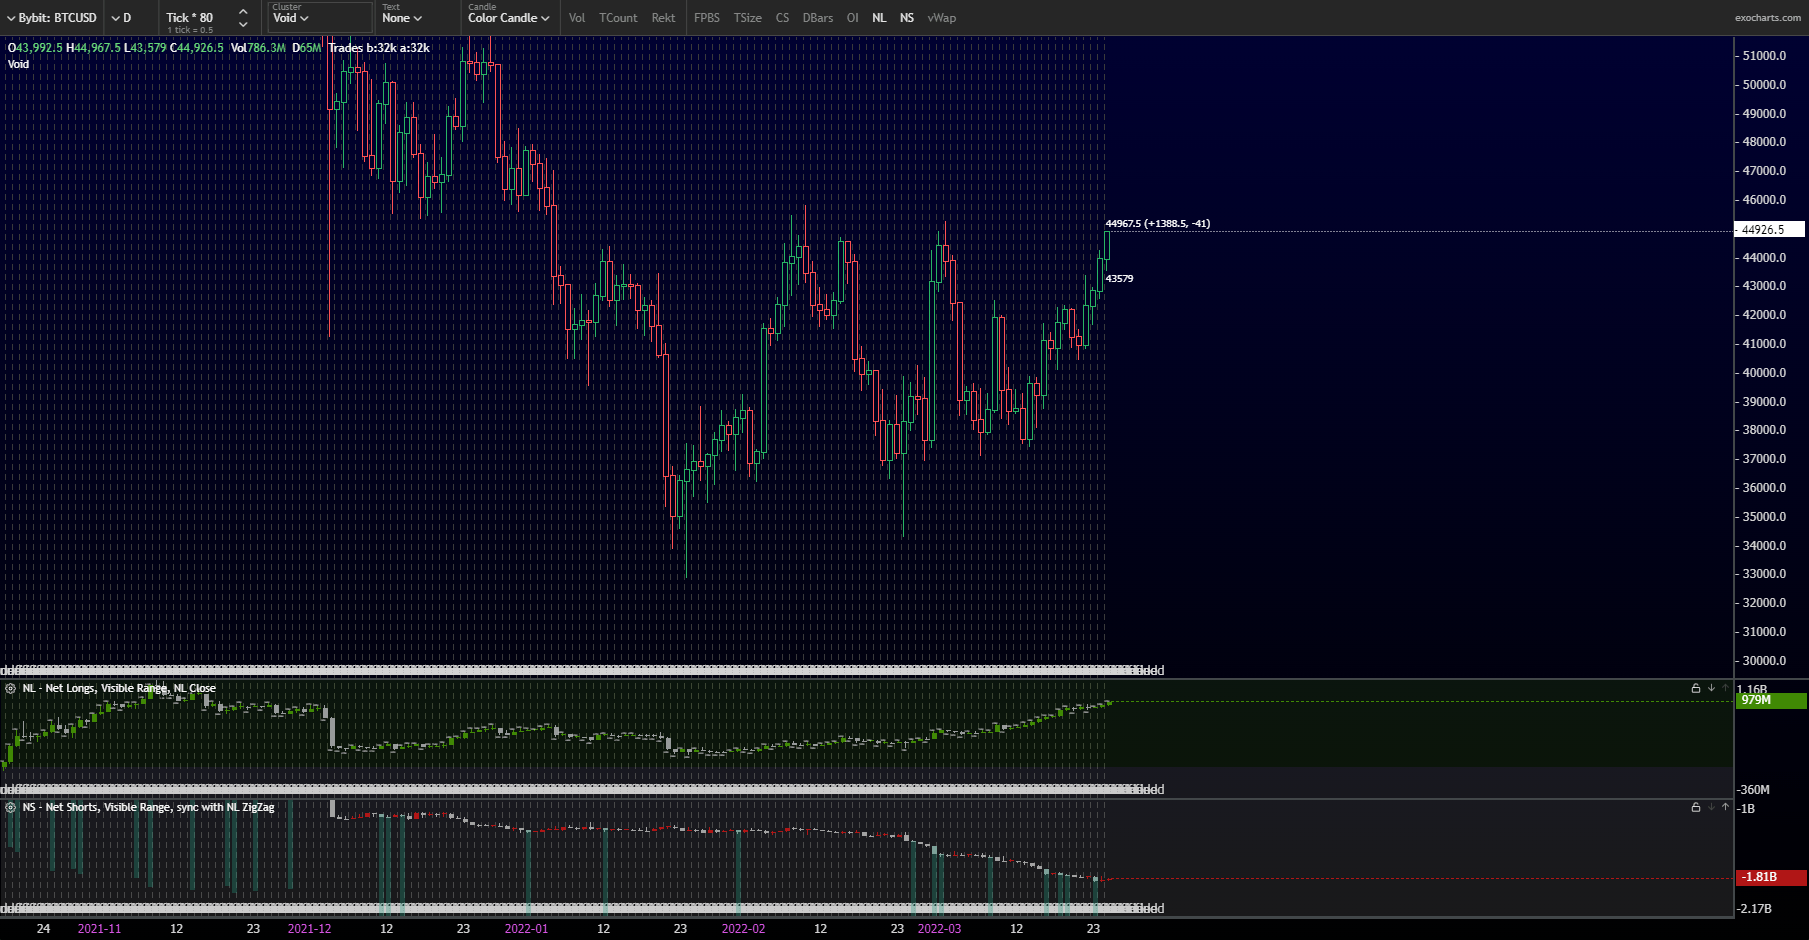
Always interesting to observe, the number of short and long positions of the participants. Here we can see that since the low point of the year at $33,000, the shorts have gradually lost momentum while the longs have continued to rise, so a majority of participants would be bullish at this threshold.
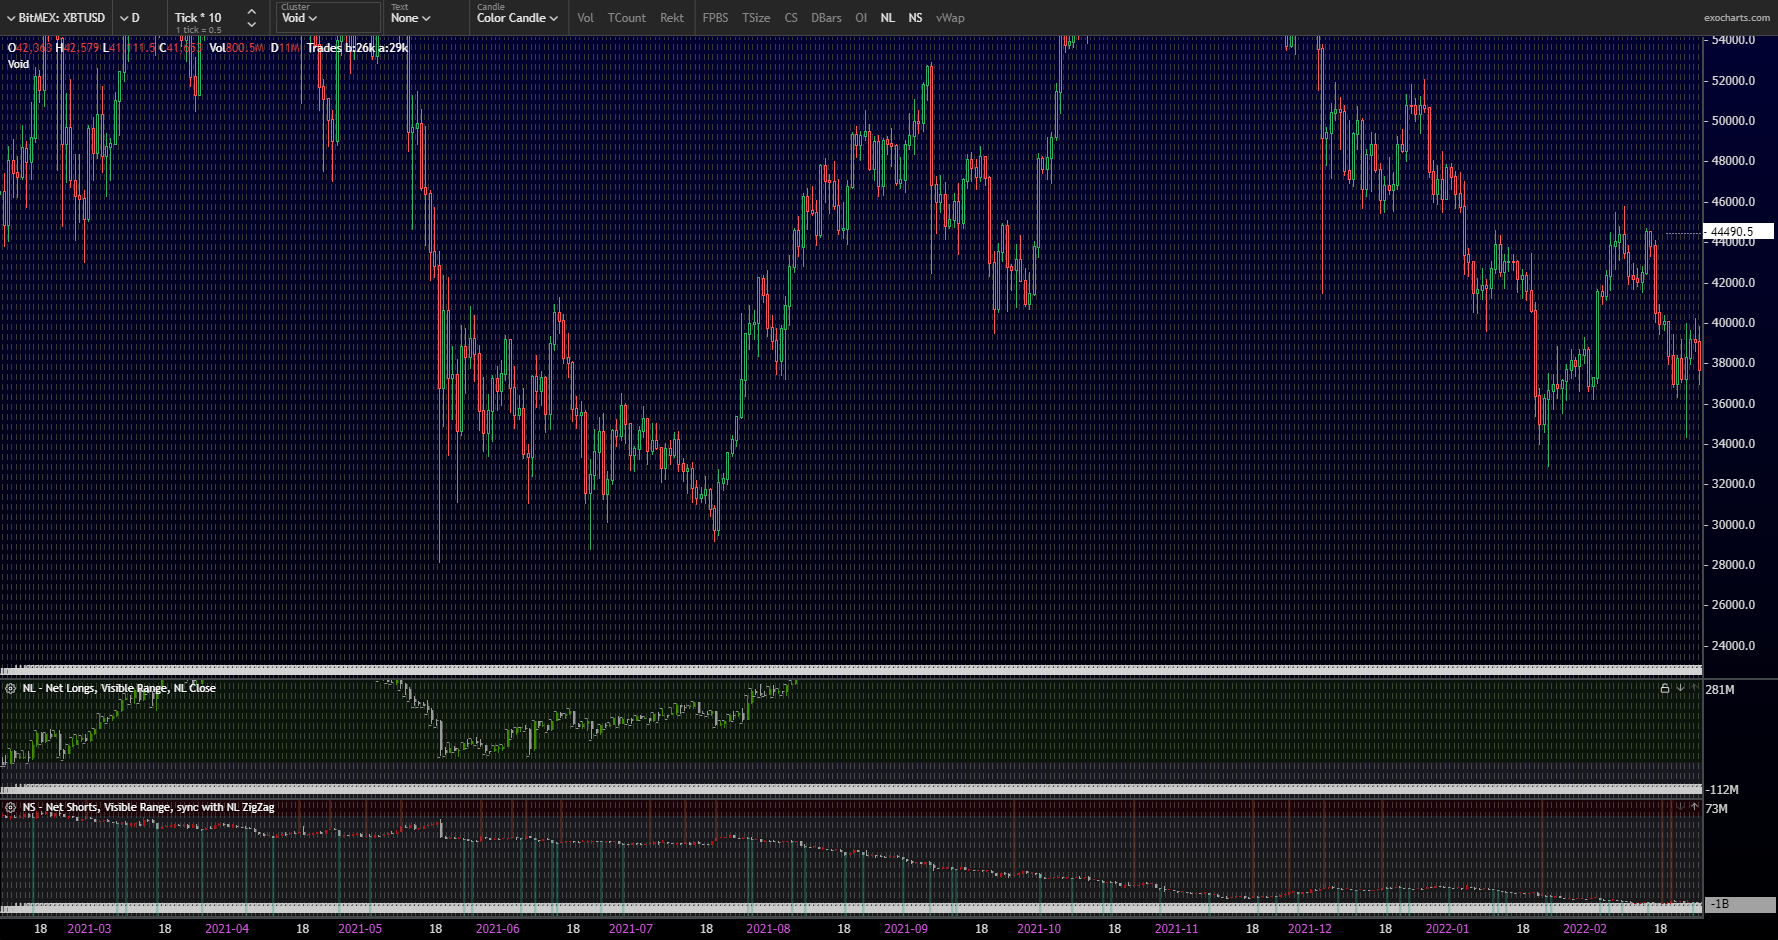
Is this really a problem? Is the market absolutely looking to chase your stop losses? Not necessarily. As we can see here, we witnessed the same scenario in the summer of 2021. The shorts were decreasing, the longs were increasing, and that did not prevent Bitcoin from doing +100% during the second half of the year. year 2021.
Bitcoin Options
Last piece of data that I like to look at: options contracts and their expirations.
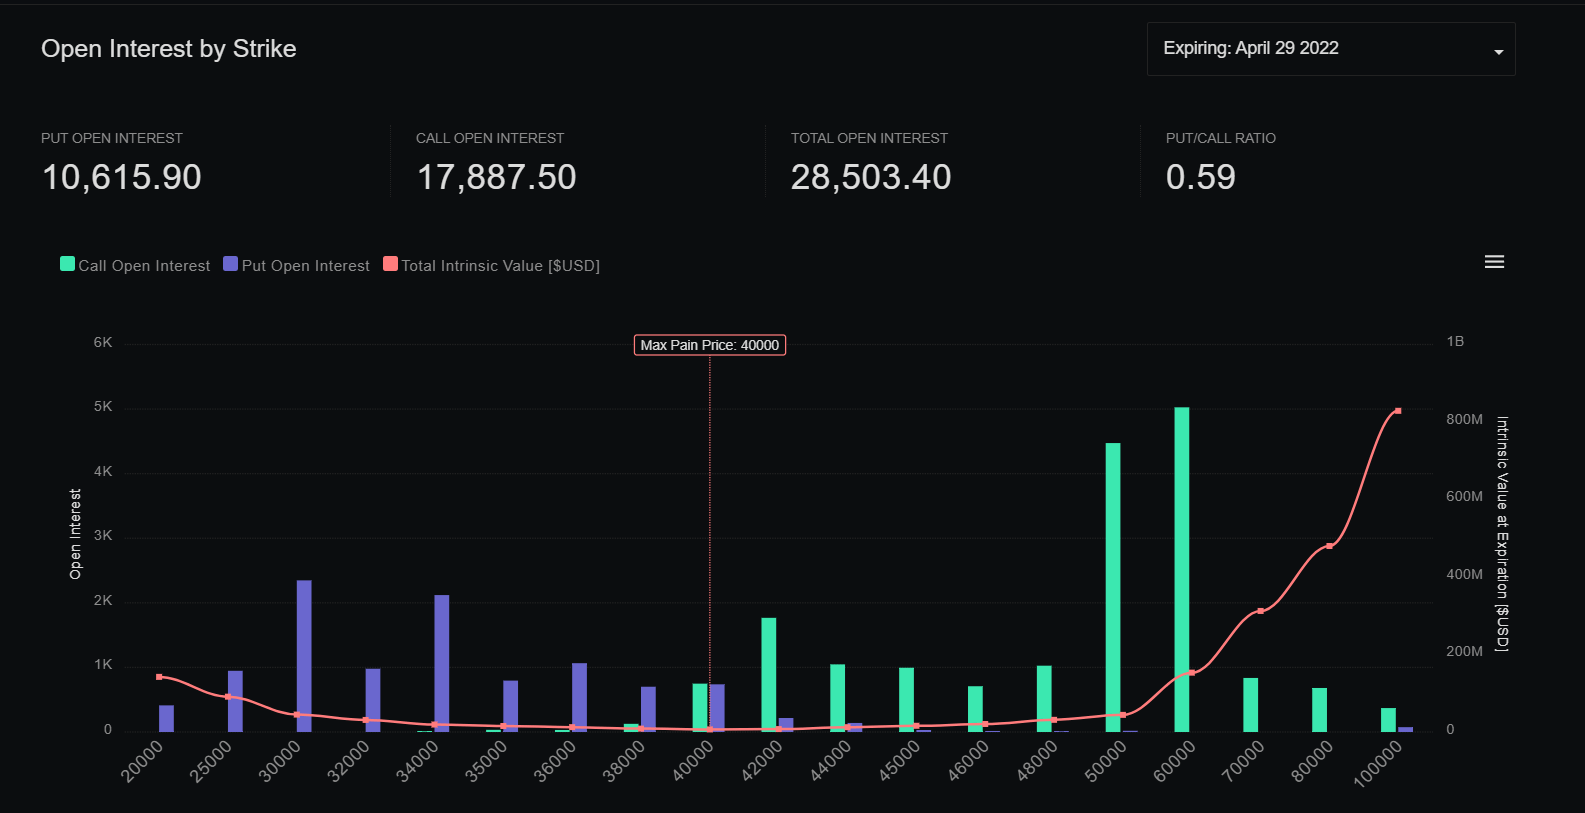
The next big close for options is April 29, with over 28,000 Bitcoin expiring.
We can see here that the max bread price is at $40,000 on that date. It is important to look at these data, which can tell a lot about the psychology of the speakers. It can be seen that options traders are quite bullish until this period, as there are more call options than put options in play. Calls are used to hedge on the upside, while puts are used to hedge against the downside.
The max pain price is the price level at which the most options traders will lose. As options close, the price tends to get closer to the max pain price, so we’ll probably have time to refocus on that by then!
On-chain data
Bitcoin Whales
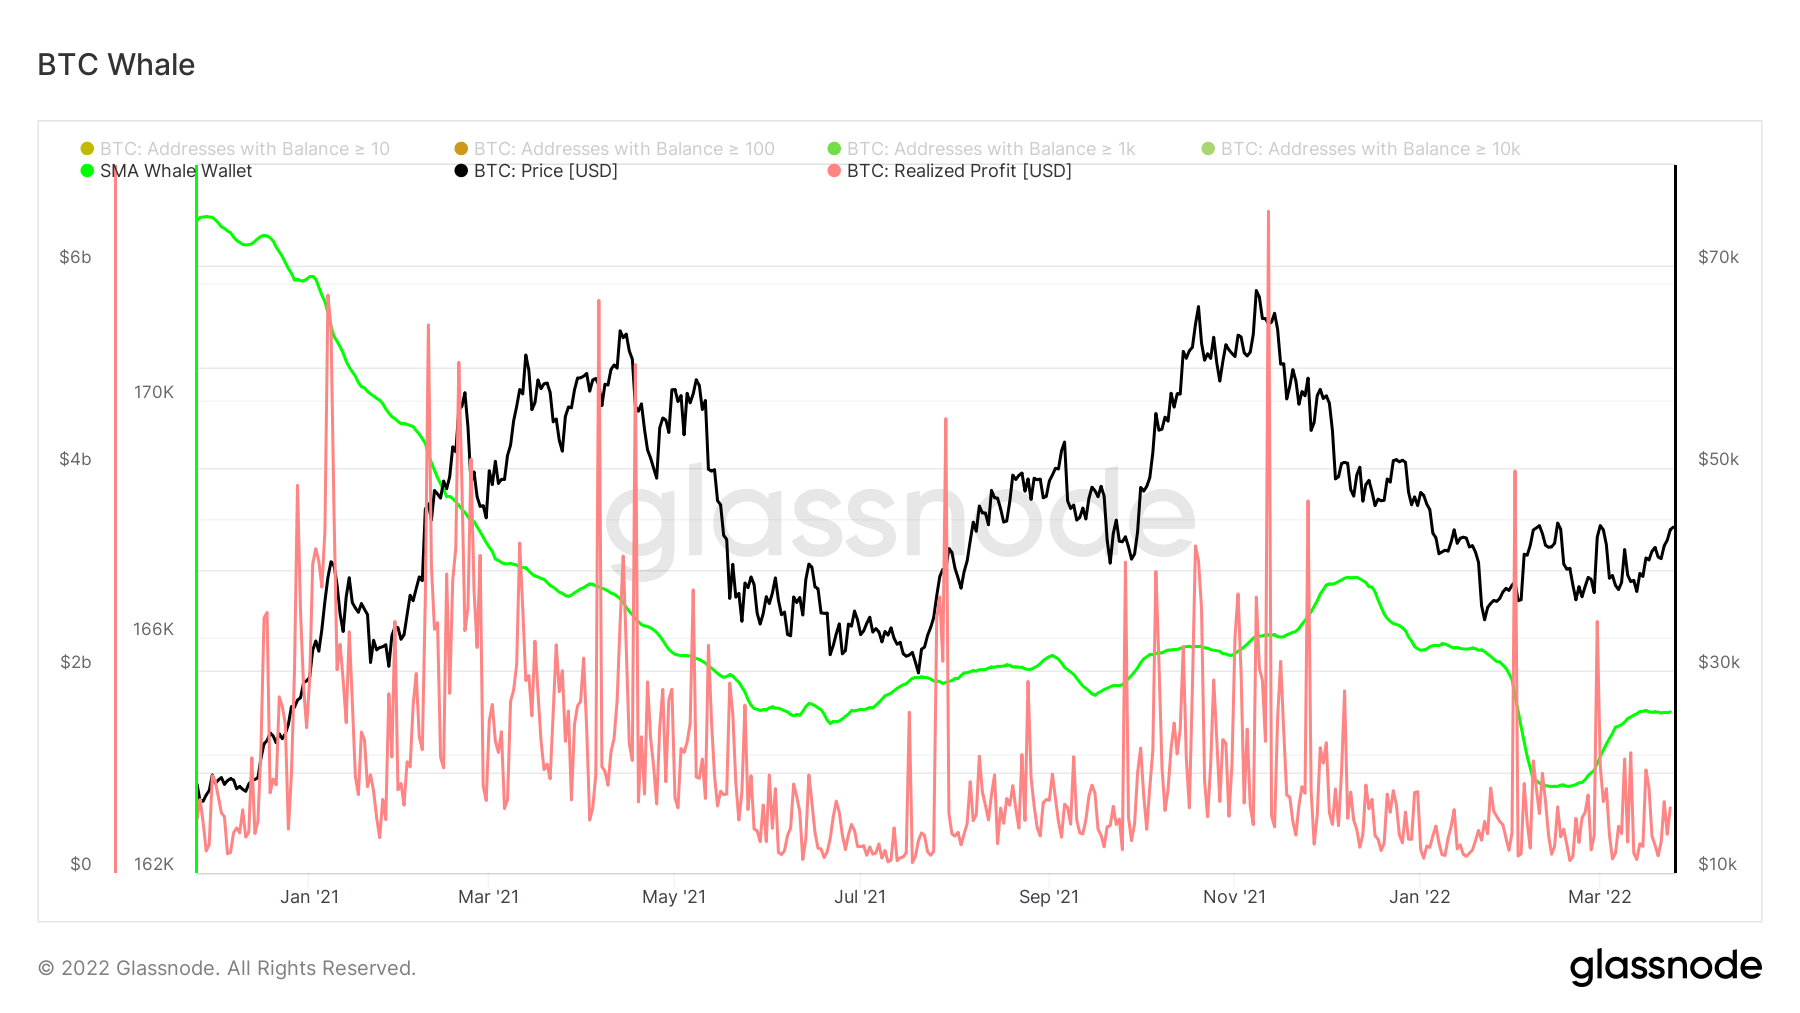
Graph that I always like to use: the red line lists the profit taking, the green line is an average of the number of “important” portfolios. We can see that recently we had two small profit takings. Would Stakeholders Expect a Bitcoin Crash? No one knows, it remains interesting to observe that some of the whales recharge, this can be observed in particular by the slight expansion of the average in green.
It’s not a big expansion, but it does show that one party has indeed recharged its wallet.
Accumulation?
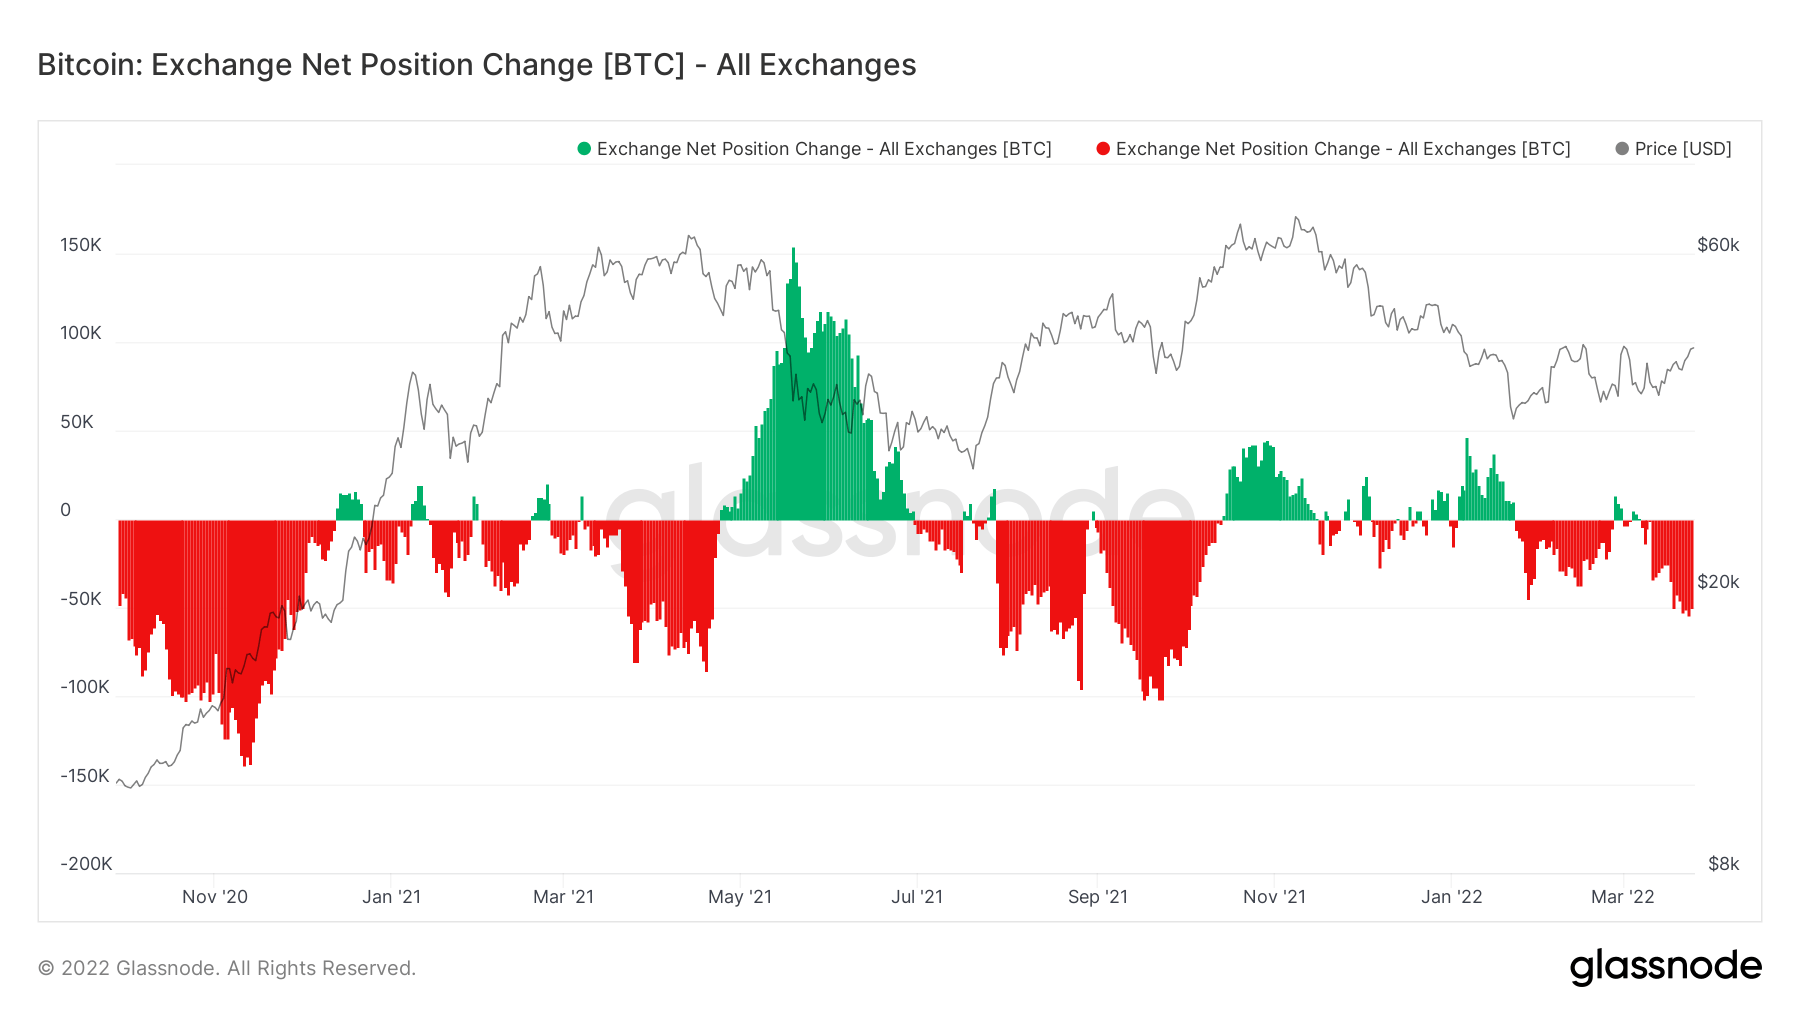
This graph represents the amount of Bitcoin leaving the exchanges (in red) and returning (in green). We can see that good amounts of Bitcoin are currently coming out of it.
I interpret this data as follows:
- Outgoing bitcoins from exchanges are accumulated. By taking their Bitcoin out of exchanges, operators probably store their bitcoins in a “cold wallet”. Understand here: a Ledger. They therefore do not plan to sell them immediately, and they will have to be repatriated to an exchange to sell them.
- Incoming bitcoins on exchanges are most likely to be sold. There is little point in keeping bitcoins, especially in large quantities, on an exchange. A risk of hacking the platform on which they are stored is always possible, the stakeholders therefore prefer to take them out in order to put them in safety.
This metric is not necessarily relevant, although it gives a position on the psychology of the speakers. For example, it took some time for a large amount of bitcoin to re-enter the exchanges during the summer 2021 crash.
In a tense geopolitical and economic context, Bitcoin has managed to regain some color in recent days. However, don’t get carried away, stay pragmatic! We already need to spend the $45,000-46,000 before designing a push. However, after a 2-month channel, a lot of buyers and sellers have accumulated, and Bitcoin’s next move will no doubt be very powerful, whether it’s up or down!
Is it possible to be gwinner every time? Whether the Bitcoin price is in great shape, or going through turbulence, Coin Trading offers you to increase your chances of success. Indeed, Trading Du Coin allows individuals to access an algorithmic and 100% automated trading tool. A real trend mechanism, this tool was designed to adapt to market reversals and position itself on the most dynamic crypto assets of the moment.