
All it takes is stoking investor fears about the Ukraine crisis to see Bitcoin (BTC) plummet again. While attempting a rebound for much of the day, he fell off his pedestal. Faced with this period of uncertainty where anything can happen, should we really leave the ship rather than lose our feathers?
The weekly and daily technical analyzes have noted signs of running out of steam. Are we seeing the end of the BTC recovery since January 24? What are the technical signals and key levels for investors to watch carefully? Now let’s see what the king of cryptos could have in store for us in the days/weeks to come.
This Bitcoin price analysis is brought to you in collaboration with the Coin Trading and its algorithmic trading solution finally accessible to individuals.
Bitcoin, a weekly candle that leaves uncertainty
During my previous market update, I was excited that Bitcoin could have a third consecutive week higher. Ultimately, the last weekly candle would probably be a doji (orange dot). This portends a fierce battle between buyers and sellers, but also uncertainty about the next moves.
The fact that it comes close to resistance around $46,000 makes this doji more important both graphically and psychologically for investors. Moreover, BTC prices stumble on the Tenkan and find themselves slightly inside the Kumo to the point that the closing price is getting dangerously close to the head-shoulder (ETE) neck line.
Despite these slightly negative technical signals, the Chikou Span remains firmly anchored above the cloud even though it is below Bitcoin prices. This temporarily dismisses the scenario of a bear run, because it would be necessary to be under the support of $30,000.
A return of Bitcoin towards the neckline of the ETE?
Cryptocurrency investors were excited from the first half of the week with Bitcoin very close to resistance around $46,000. But from the second half, things got tougher, culminating in the Ukrainian crisis.
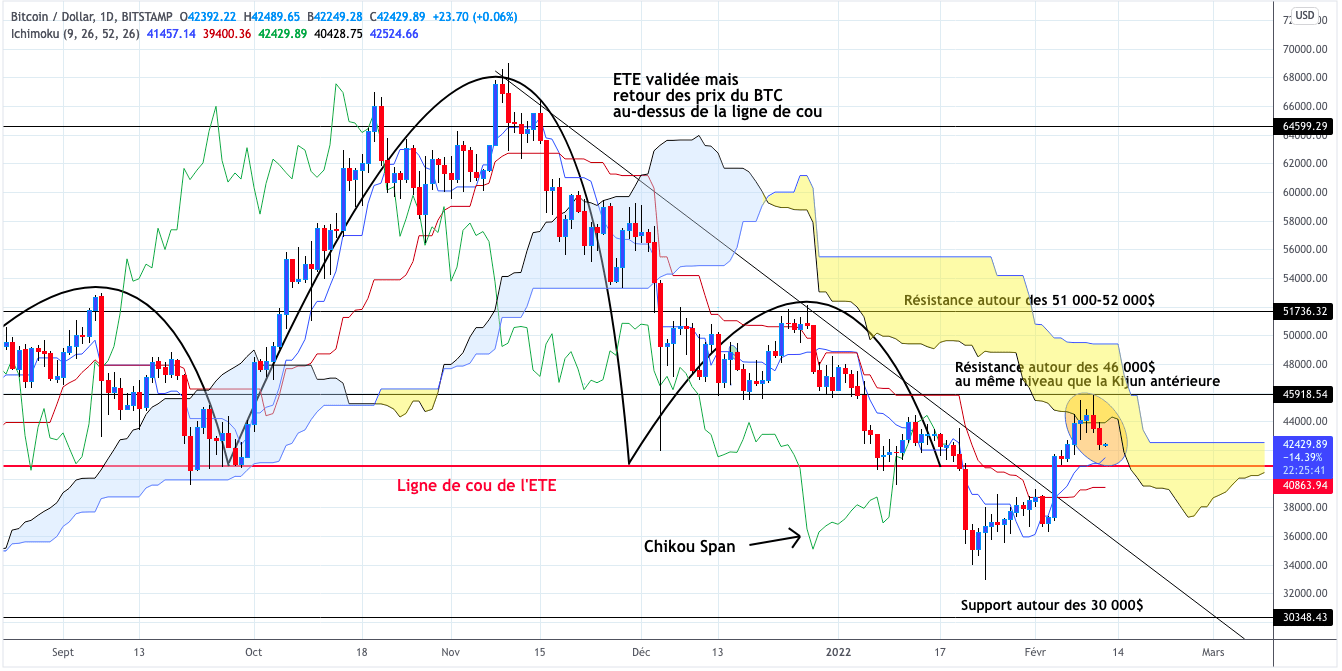
It is no coincidence that certain components of the Ichimoku unfortunately contributed to the end of the ascent in daily units. Especially since Senkou Span A (SSA)the lower limit of the Kumo in a downtrend, served as a dam against the continued rebound in BTC. And if you have the eye, the resistance around $46,000 is at the same level as the earlier Kijun. Like what, it was not satisfied with an intermediary role between $41,000 and the $51,000-52,000 zone.
Now, prices for the king of cryptos are said to be on the verge of flowing back to Tenkan, which is a stone’s throw from the neck line of ETE. This would serve as a fulcrum for a new upward wave. On the contrary, it could be seriously threatened if it falls below $41,000. Which would result in the validation of this bearish chart pattern for the second time. On the Chikou Span side, we see it languishing below the Kumo and the downtrend line since its last ATH, despite the renewed energy of the past two weeks.
In summary, the slowdown we are witnessing on Bitcoin seems logical given the rebound since January 24, which took place in a context of high volatility. Moreover, its negative reaction to the latest inflation figures in the United States and to the Ukrainian crisis prove for the umpteenth time that Bitcoin is a “risk on” or high-risk asset.
While BTC’s weekly technical analysis leads us to remain neutral at this stage, it is less so in daily units. The downtrend line that has been broken upwards is not an end in itself to confirm the start of a bull run. The Ichimoku, which has the annoying habit of frustrating some investors, shows us that the game is far from won for buyers. As assumed by crpto_me, Bitcoin would fall again if it were to see the nearest key levels compromised. Starting with the ETE neck line, the fateful threshold around $41,000.
Is it possible to be gwinner every time? Whether the Bitcoin price is in great shape, or going through turbulence, Coin Trading offers you to increase your chances of success. Indeed, Trading Du Coin allows individuals to access an algorithmic and 100% automated trading tool. A real trend mechanism, this tool has been designed to adapt to market reversals and position itself on the most dynamic crypto assets of the moment.