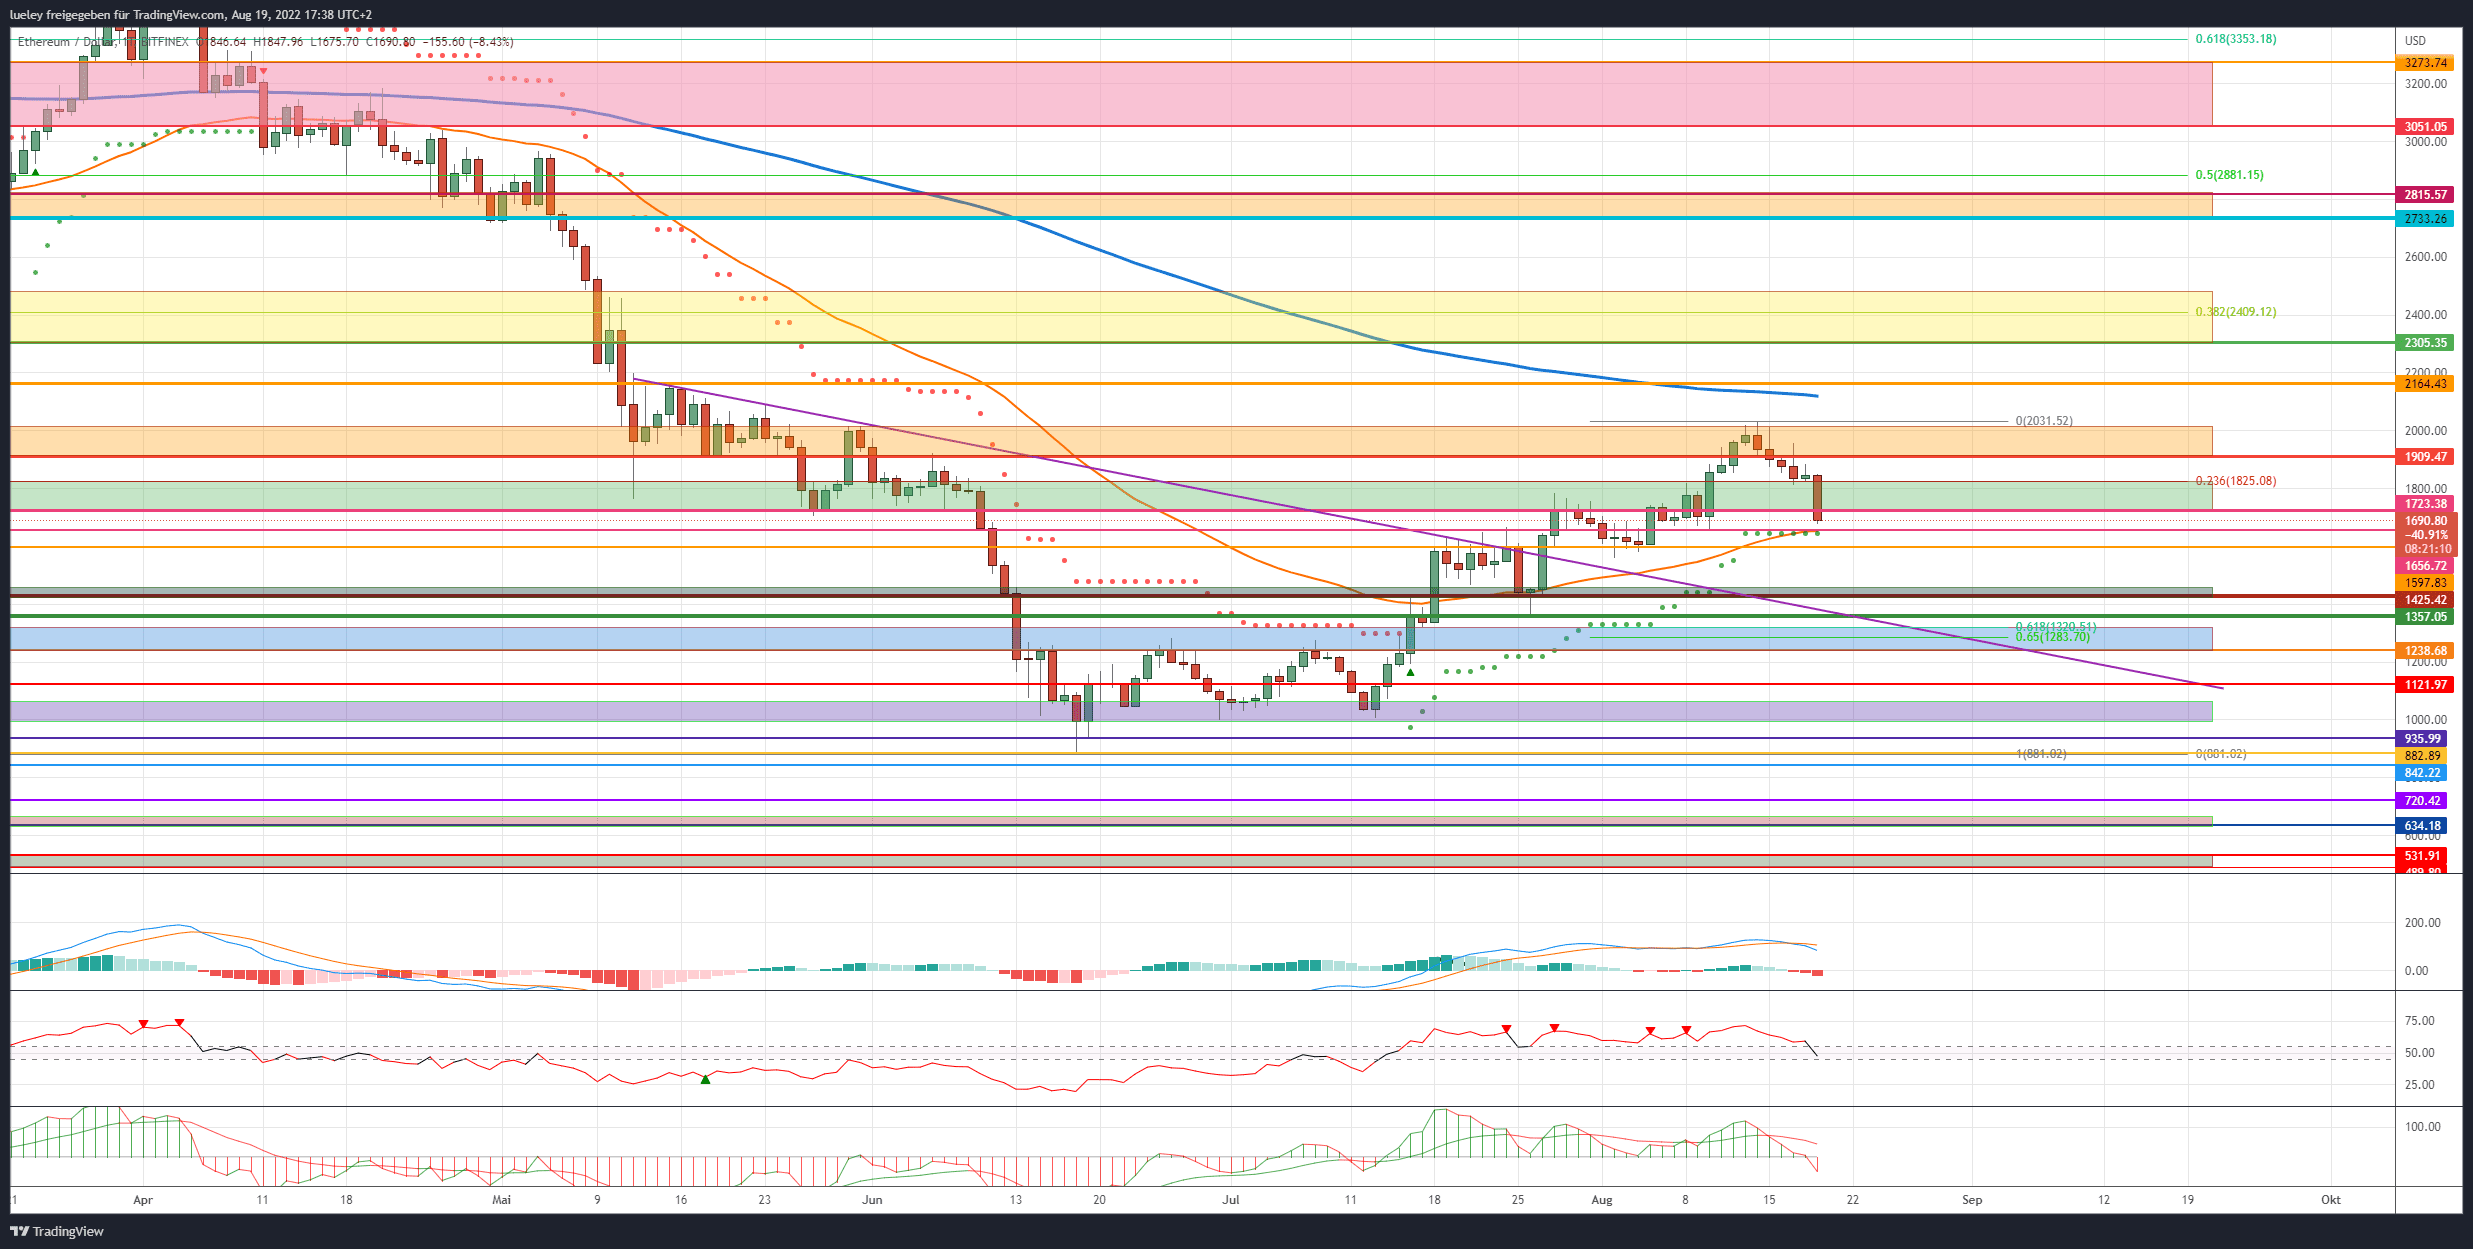
- Course (ETH): $1,690 (previous week: $1,928)
- Short-term resistances/goals: $1,723, $1,825, $1,909, $2,050, $2,164, $2,305, $2,448/$2,485, $2,733
- Short-term supports: $1,656, $1,597, $1,521, $1,425/1,458, $1,357, $1,238/1,320, $1,121, $1,063, $992, $935, $882, $720, $663/634, $531/489
Ethereum Recap
- In the previous week, Ethereum reached the second relevant target area around USD 2,050 before a price reversal began in the following days.
- Ethereum then slipped back to USD 1,825 before the ether price corrected again one level lower this Friday morning to the strong support at USD 1,723 with high sales volume.
- At the time of writing, Ethereum is currently trading even below that key support at $1,689.
- From the high of the previous week, the second largest cryptocurrency has now lost a good 16 percent in value.
- One reason for today’s sell-off is the weakness of the Nasdaq100 technology index. The demand for further interest rate hikes by the US Federal Reserve ensures significant profit-taking in many stocks on the last trading day of the week.
Relevant price markers for the coming trading week
- In the short-term, the ether chart looks a bit oversold in the shorter timeframes. However, Ethereum could promptly test the cross-support from Supertrend and EMA50 (orange) in the area of USD 1,656 for consistency.
- Even a short spike up to USD 1,597 would be conceivable in the near future.
- On the upside, USD 1,825 and the area around USD 1,909 are now acting as resist levels.
- Only a daily closing price above USD 1,909 would brighten the chart image again and initiate a renewed attempt to rise in the direction of the previous week’s high.
- Overall, the bulls must defend the zone between USD 1,425 and USD 1,357 in order not to endanger the upward movement.
- Looking at the RSI and MACD indicators, both the 4-hour and daily charts are showing sell signals. A sustained consolidation in the coming days should therefore not be ruled out.
- On the other hand, the MACD indicator has now generated a buy-signal on a weekly basis. This underlines the chance of prospectively higher ether prices until the merge on September 15th.
Bullish Scenario (Ethereum)
- In the previous week, the bulls managed to heave the ether price into the repeatedly mentioned target area of USD 2,050 with strong buying volume.
- However, at the time of the last price analysis on July 29, it was already apparent that the momentum was threatening to weaken somewhat.
- However, as long as the buy side manages to send Ether price back north and back above the USD 1,825 and USD 1,909 resistances in the coming days, another attack towards USD 2,050 is likely.
- If the EMA200 (blue) can also be breached at currently USD 2,119, the USD 2,164 mark will come into focus. Here, however, the ether course should bounce back south again.
- If Ethereum then stabilizes north of USD 1,825, the bulls will do everything in their power to attack the yellow resistance zone between USD 2,305 and USD 2,485. This area must then also be skipped over the long term in order to generate a bullish change in market structure.
- Thereafter, the probability of a bullish continuation move towards the orange resistance area between USD 2,733 and USD 2,815 increases. This area represents the maximum upside target until the move to Proof of Stake in mid-September.
Bearish Scenario (Ethereum)
- The sell-side took advantage of the weakening buying momentum and turned the course southwards in the orange target zone.
- In the last few hours of trading, bears pushed Ether price back to the first key support area in the $1,700 zone amid heavy volume.
- In total, leveraged long positions of more than $130 million liquidated.
- In the short term, a small recovery movement to the north is therefore very likely.
- However, if the bears succeed in dynamically undercutting the important support at USD 1,656 in the coming trading days, the breakout level at USD 1,597 will come into focus again.
- First of all, the ether course should stabilize here.
- Only when this price mark is also undercut by the daily closing price does the correction expand in the direction of the gray support zone between USD 1,458 and USD 1,425.
- However, the bulls should not give up this area without resistance. Otherwise, the risk of a widening correction would increase noticeably.
- However, if there is no countermovement, the low of July 26 at USD 1,357 will come back into the eyes of investors.
Medium-term directional decision imminent
- If this support does not hold, a directional decision can be expected in the zone between USD 1,320 and USD 1,238 at the latest. Here is the July 16 breakout level and the golden pocket of the move up from the yearly low. The buyer side should be here.
- If, for example, there are problems during the switch to the PoS network and the USD 1,238 is also permanently undercut at the daily closing price, the chart picture becomes significantly clouded.
- If the classic stock market also comes under pressure again and Bitcoin also falls back below USD 19,000, Ethereum will target the purple support area again with a stop at USD 1,121.
- In the demand zone between USD 1,062 and USD 999, it is finally decided whether the bulls have the strength to turn the course north again or have to bow to the selling pressure of the bears.
- This zone is of great importance for Ethereum. The bulls were able to defend the purple area as support several times.
The bears are gaining ground
- If this area is breached in the coming weeks, Ethereum will fall directly to at least USD 935.
- A renewed approach to the low for the year at USD 882 should not come as a surprise either.
- If the price falls below the annual low for a sustained period of time, the downward movement will expand without detours to around USD 720.
- If the classic financial market is also bearish due to persistent inflation and an increasingly weak global economy, a relapse to the breakout level from December 2020 between USD 663 and USD 634 cannot be ruled out.
- The maximum target price on the bottom is unchanged between $531 and $489.
Disclaimer: The price estimates presented on this page do not represent buy or sell recommendations. They are merely an assessment by the analyst.
The chart images were created using TradingView created.
USD/EUR exchange rate at the time of going to press: EUR 0.98.
Looking to buy Ethereum (ETH)?
This is possible via eToro, among other things. eToro offers investors, from beginners to experts, a comprehensive crypto trading experience on a powerful yet easy-to-use platform. We took a close look at eToro.
To the eToro review