The key crypto currency Bitcoin (BTC) is about to make an important decision in the short term. Bitcoin is currently trading again not far from a massive resistance area. Bitcoin dominance has increased noticeably in the last few days of trading. The first parallels to the situation in 2018 are becoming apparent.
Bitcoin (BTC): Bitcoin price before direction decision
BTC course: 39,109 USD (previous week: 35,100 USD)
Resistance / goals: $ 40,481, $ 41,967, $ 43,030, $ 44,120, $ 44,878, $ 47,070, $ 48,222, $ 51,307 / $ 50,305, $ 53,005, $ 54,077, $ 56,867, $ 58,386, $ 59,527, $ 61,122, $ 61,771, $ 64,896
Supports: $ 39,240, $ 38,383, $ 36,636, $ 34,895, $ 33,419, $ 31,010, $ 30,000, $ 28,716, $ 27,563, $ 25,752, $ 23,887, $ 22,222, $ 21,892, $ 19,884,
After the Bitcoin price had failed several times to overcome the resistance at USD 39,240 per day’s closing price, the bulls managed to break the important price mark at the beginning of the week and let Bitcoin rise to the EMA200 (blue) at USD 40,920. Positive comments from Elon Musk and most recently from Microstrategy CEO Michael Saylor are currently creating a positive mood among investors. Bitcoin is once again on the upper edge of the sideways trend in the area of USD 40,481. Whether the positive news is enough to sustainably overcome the strong resistance area between USD 40,481 and USD 43,030 remains to be seen in the coming trading days. As long as Bitcoin continues to rank below the multiple resistance range of EMA200 (blue), MA200 (green), upper Bollinger Band, Supertrend and EMA50 (orange), renewed price consolidation is not off the table. Today’s central bank meeting of the US Federal Reserve and its assessment of future interest and inflation expectations are highly relevant in this regard.
Bullish scenario (Bitcoin price)
Bitcoin tried several times in the last three days of trading to overcome the EMA200 (blue) at USD 40,920, but bounced down again after another attack attempt on Wednesday morning at the time of this analysis. If the bulls manage to stabilize the BTC price above the EMA20 (red) at USD 38,383, a renewed increase scenario can be expected during the course of the day. If that succeeds and Bitcoin overcomes the 40,920 USD, further strong price-limiting hurdles are already waiting at 41,967 USD and 43,030 USD. Only when Bitcoin can leave this central make-or-break zone well behind by the daily closing price, a subsequent increase in the range between USD 44,120 and USD 44,878 should be planned. If there is a so-called “follow-through” and these resistance levels are also overcome dynamically, the probability of a march through to the next relevant price target at USD 47,070 increases noticeably.
If this resistance level can also be broken without significant resistance, the next price target will be activated at USD 48,222. If the bulls manage to confirm the upward movement in the following days, a price jump up to USD 50,327 should be planned. Then the next strong resistance level moves into focus at USD 51,307. If the BTC rate does not turn significantly to the south here either, the likelihood of a rate increase up to USD 53,005 increases. If this resistance level can also be broken dynamically in the coming trading weeks, further price targets will activate at USD 54,077 and USD 55,817. The maximum price target this week is also USD 57,998. Only when this price level is also pulverized by the daily closing price is an increase to at least 61,000 USD possible. In the medium term, an increase to the all-time high of USD 64,896 would also be increasingly likely.
Bearish scenario (Bitcoin price)
The bears continue to hold out against it, successfully parrying any attempt by the cops to take control again. The longer the BTC rate bounces down in the USD 40,000 range, the more likely it is to setbacks back towards USD 36,636 and USD 34,895. If the seller succeeds in pushing Bitcoin again sustainably below the EMA20 (red) at USD 38,383, the more likely a retest of these support levels becomes. If there is a slide below USD 34,895, the probability of a correction widening increases again. The bears will try again to undercut the support at USD 33,419 a day’s closing price. Giving up this price mark will bring the supports at USD 31,010 and USD 30,000 back into the focus of investors.
Statistically, the probability of a breakthrough continues to increase. If the $ 30,000 is abandoned, the correction expands to at least $ 28,716. If there is no trend reversal at this support level, the downward movement will gain momentum again. The widening of the correction should subsequently push the BTC rate back into the range between USD 27,563 and USD 25,752. If the pressure to sell continues, a correction up to USD 23,887 is possible at any time. It remains to be seen at what level the bulls can hit back. A plunge into the strong support area between USD 22,222 and USD 21,892 would be conceivable. A resumption of the old breakout level at USD 19,884 cannot be ruled out as a result.
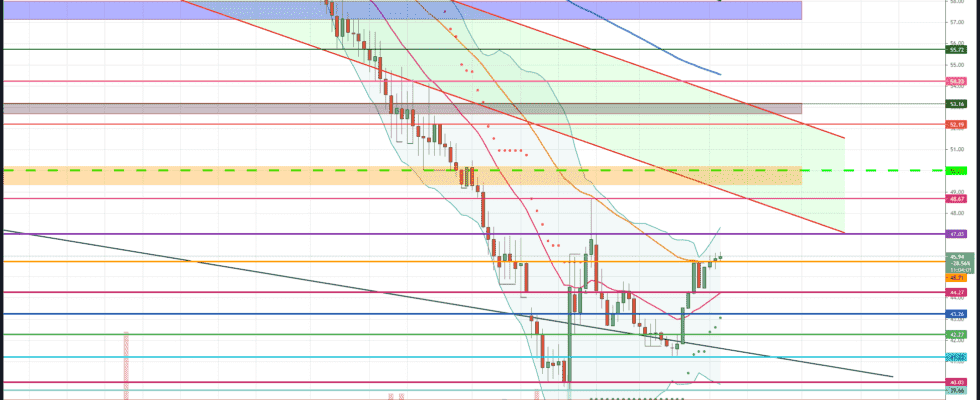
Bitcoin dominance: dominance with a tendency to stabilize
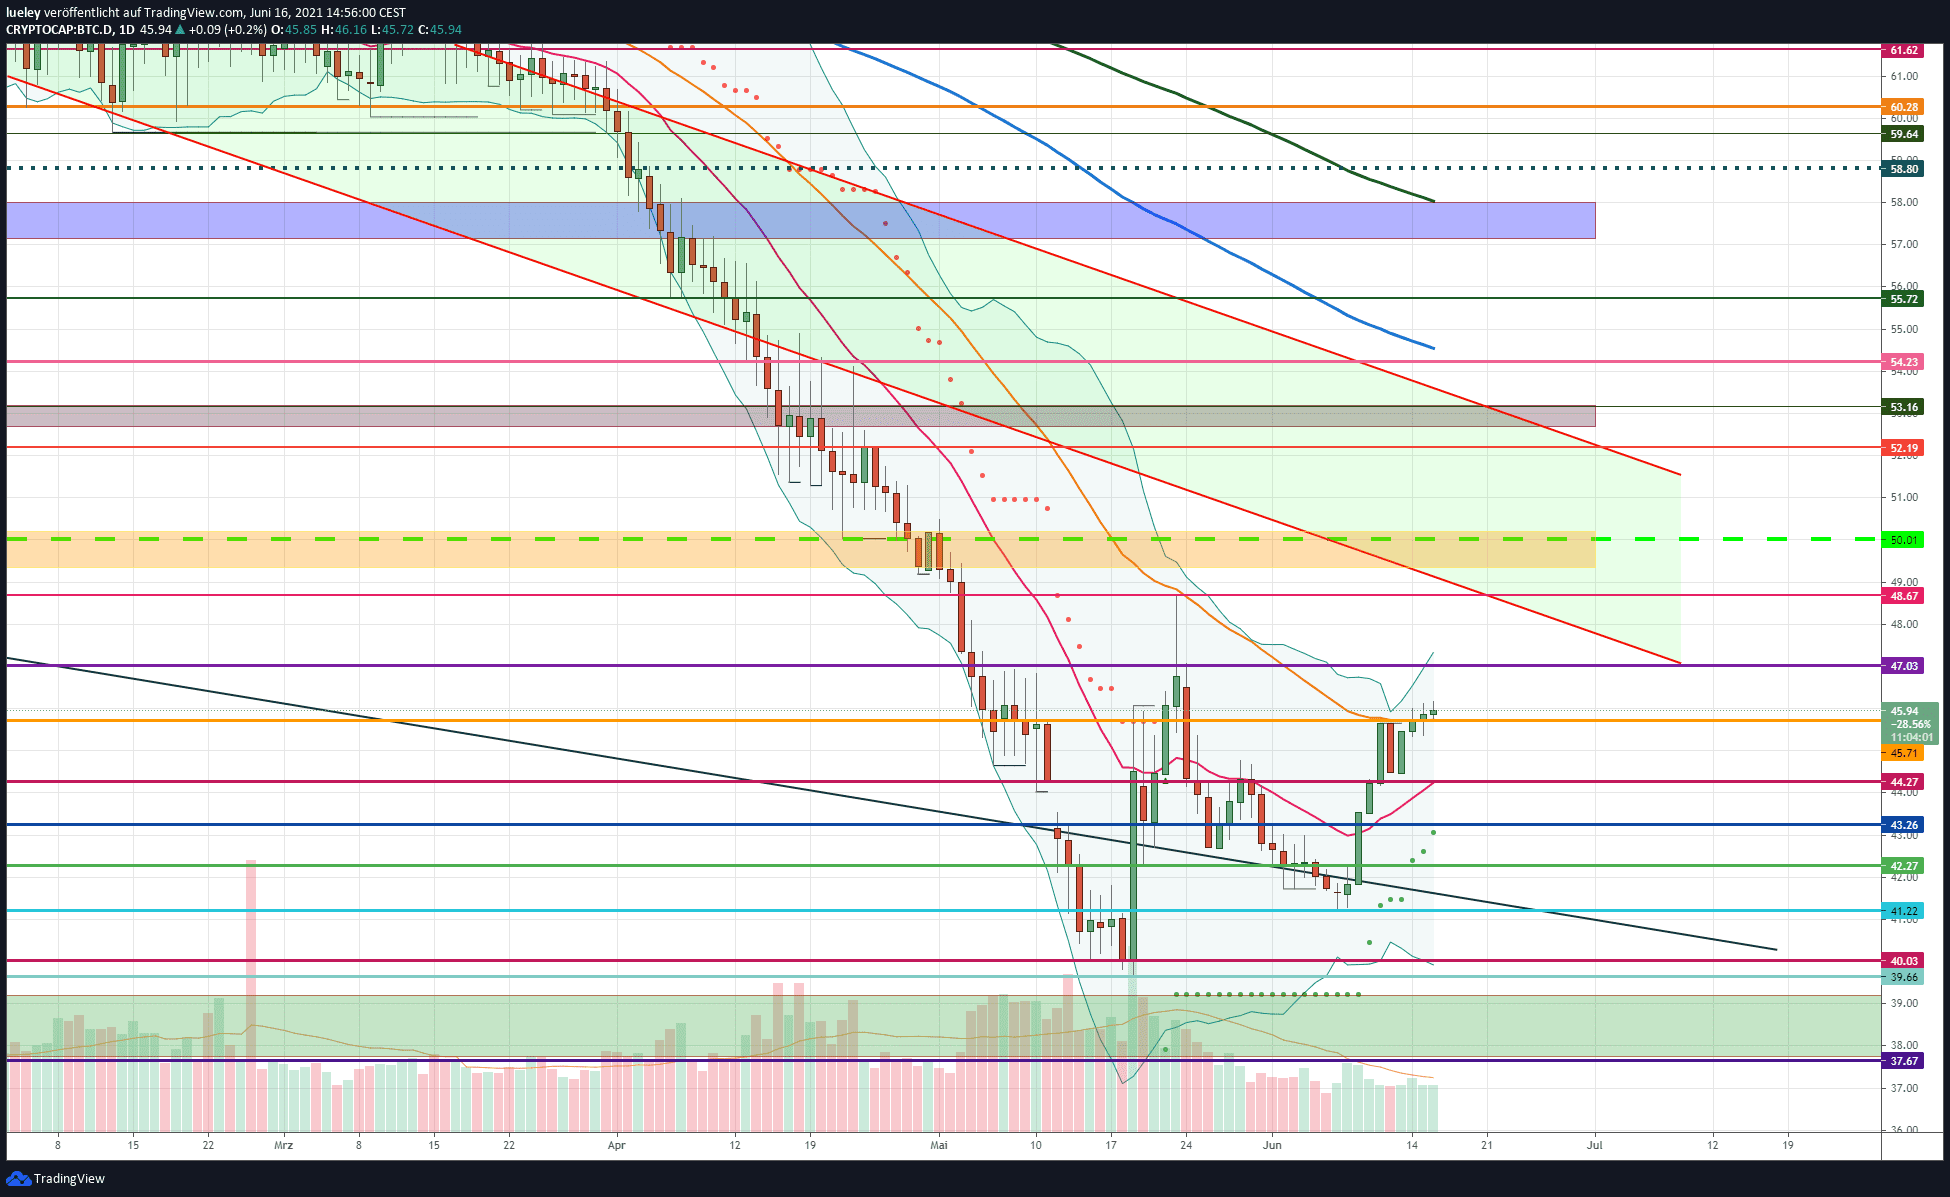
Bitcoin dominance based on values of Cryptocap shown
The market dominance of the crypto reserve currency has continued to gain ground in the last few days of trading and is quoted at 45.94 percent, just above the cross resistance from EMA50 (orange) and horizontal resistance at 45.71 percentage points. This prevented another relapse to the annual low of 39.66 percent for the time being. If the BTC dominance can increase further, the resistance at 47.03 percentage points will come into focus as the first target for the coming trading days.
BTC Dominance: Bullish Scenario
The BTC dominance can gradually break away from its lows and is preparing to jump back into the broken downtrend channel. If the Bitcoin dominance overcomes the resistance at 47.03 percent and stabilizes above it at the daily closing price, the recovery movement will continue to take shape. The high of May 23 at 48.67 percentage points will then come back into the focus of investors. In this context, the recapture of the EMA50 (orange) is relevant. Since the break of this moving average line on January 16, 2021, BTC dominance has not been able to regain the EMA50 on a sustainable basis. This sliding resistance is currently to be assessed as an indicator. A rise above the 48.67 percent should therefore spark further upward momentum and lead the BTC dominance to the upper edge of the orange resistance area at 50.01 percent.
If the march to the psychological 50 percent mark succeeds and the BTC dominance does not fall back again, an increase to the important bullish price target of 52.19 percent is likely. The upper edge of the downtrend channel also runs here. If this cross-resistance is subsequently broken through without any significant setback, the recovery will gain further momentum. A subsequent increase to the resistance at 53.16 percent should be planned. A maximum increase to the horizontal pink resistance line at 54.23 percent is still possible. Since the EMA200 (blue) is also just below the line, a dynamic rise above this resistance level is not to be expected immediately. A sustainable trend change is only conceivable when this chart mark is broken sustainably. The BTC dominance could then march through to 55.72 percent or even into the blue resistance area between 57.12 percent and 58.01 percent. However, as long as the BTC dominance is below the 50 percent mark, this price scenario is still a long way off.
BTC Dominance: Bearish Scenario
If the BTC dominance does not manage to stabilize above the EMA50 and rebounds dynamically down at 47.03 percent at the latest, the area around 44.27 percent comes into focus again. The EMA20 (red) is currently running here. If this support level is broken down again, the downward trend will pick up speed again. A relapse to the cross support from the horizontal support line and the supertrend at 43.26 percent would be likely. If this support level is also abandoned, the downward dynamic increases again. 42.27 percent and the previous week’s low of 41.22 percent would come back into focus as target marks. Should this support level be abandoned, an expansion of the correction back to around 40 percent should be planned.
Again a battle for this important support brand can be expected. If the BTC dominance continues to lose ground and the 40 percent give up, the annual low at 39.66 percent will be retested. If the BTC dominance does not stabilize in this area, a correction expansion into the green support zone is likely. In the medium term, a decline in market dominance to the maximum bearish price target of 37.67 percent would be conceivable. The multi-year low of January 2018 is here. If there is no countermovement here either, a slide to the psychological mark of 30 percent cannot be ruled out. The current price development shows parallels to 2018, which is why Bitcoin is expected to continue to dominate for the time being.
Disclaimer: The price estimates presented on this page do not constitute buy or sell recommendations. They are only an assessment of the analyst.
The chart images were created using TradingView created.
USD / EUR exchange rate at the time of going to press: 0.82 euros.