
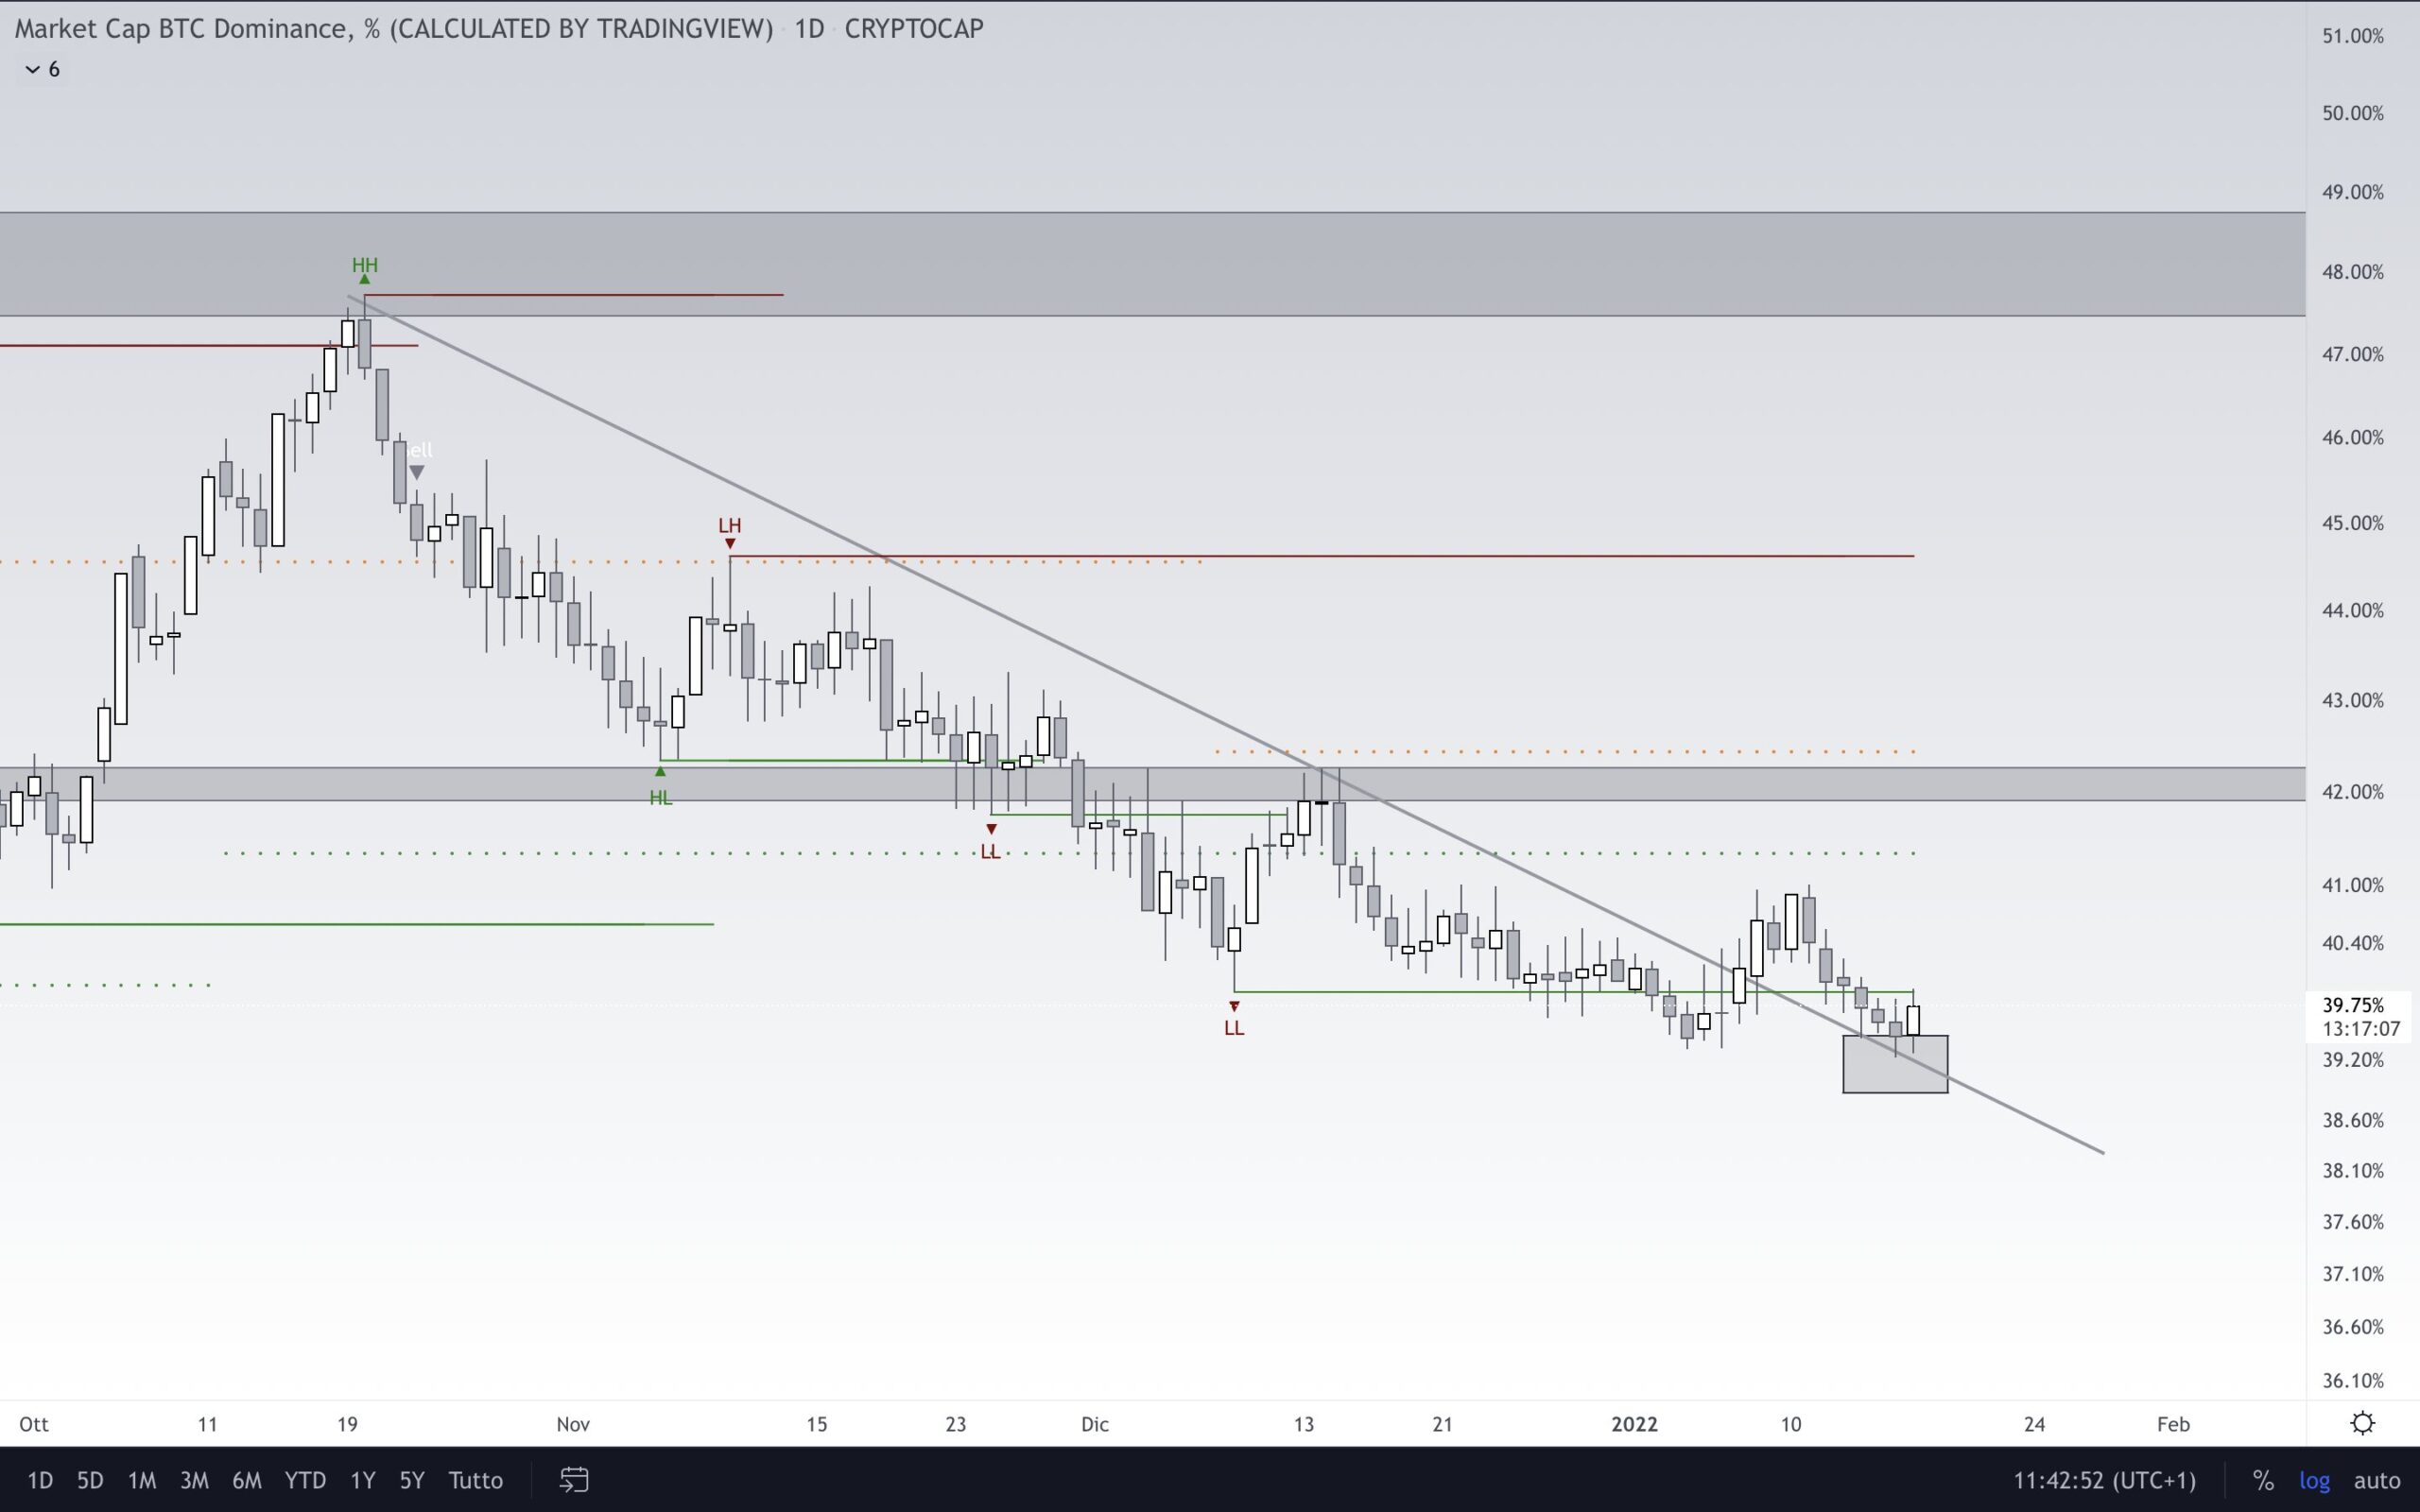
The bitcoin dominance rate (BTCD) has been on the rise since January 16 and has regained a crucial horizontal zone in the process.
Since May 18, 2021, Bitcoin’s dominance rate has been moving above the 40% horizontal support zone. Since then, this zone has supported the BTCD on multiple occasions. A rebound at this support notably led to a local high of 47.7% reached on October 20, 2021, but the price fell again immediately afterwards.
At the beginning of 2022, BTCD deviated slightly below this support zone twice (red circles), before regaining it on January 21.
BTCD’s next move
the crypto trader @eliz883 shared a chart of BTCD on Twitter, saying that the current bounce in the rate could precede a considerable upside move.
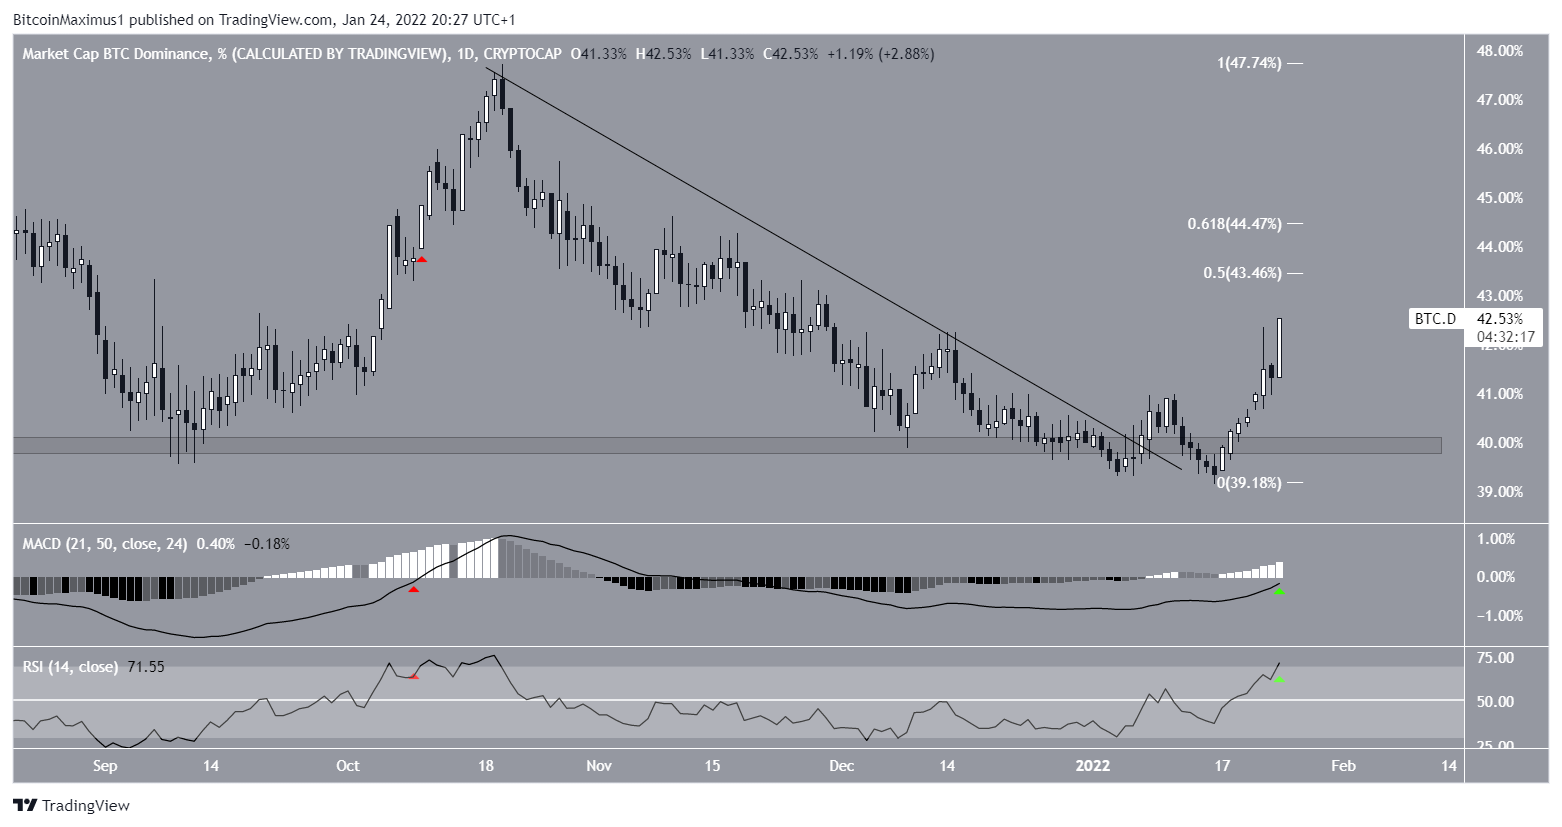
The bounce came after BTCD crossed above a descending resistance line in place from the aforementioned high of 47.72%. This rise accelerated considerably on January 24th, creating a large bullish candlestick.
BTCD is now approaching the resistance of the 0.5-0.618 Fibonacci retracement, located between 43.5% and 44.5%.
The technical indicators are bullish, knowing that both the RSI and the MACD are up (green arrows). The RSI is an indicator of momentum, or momentum, and values above 50 are considered bullish. Currently, the indicator is poised to break above 70. Likewise, the MACD, which is made up of short and long-term moving averages (MAs), is practically positive.
Although both of these signs are considered to be bullish developments, it is worth mentioning that the last time these indicators presented these values (red arrows), BTCD was close to its high at 47.72%, which coincided with the top of the descending resistance line.
So, while it seems plausible that Bitcoin’s dominance rate will manage to climb all the way back to the 43.5%-44.5% zone, it could still face rejection there.
Long-term rate structure
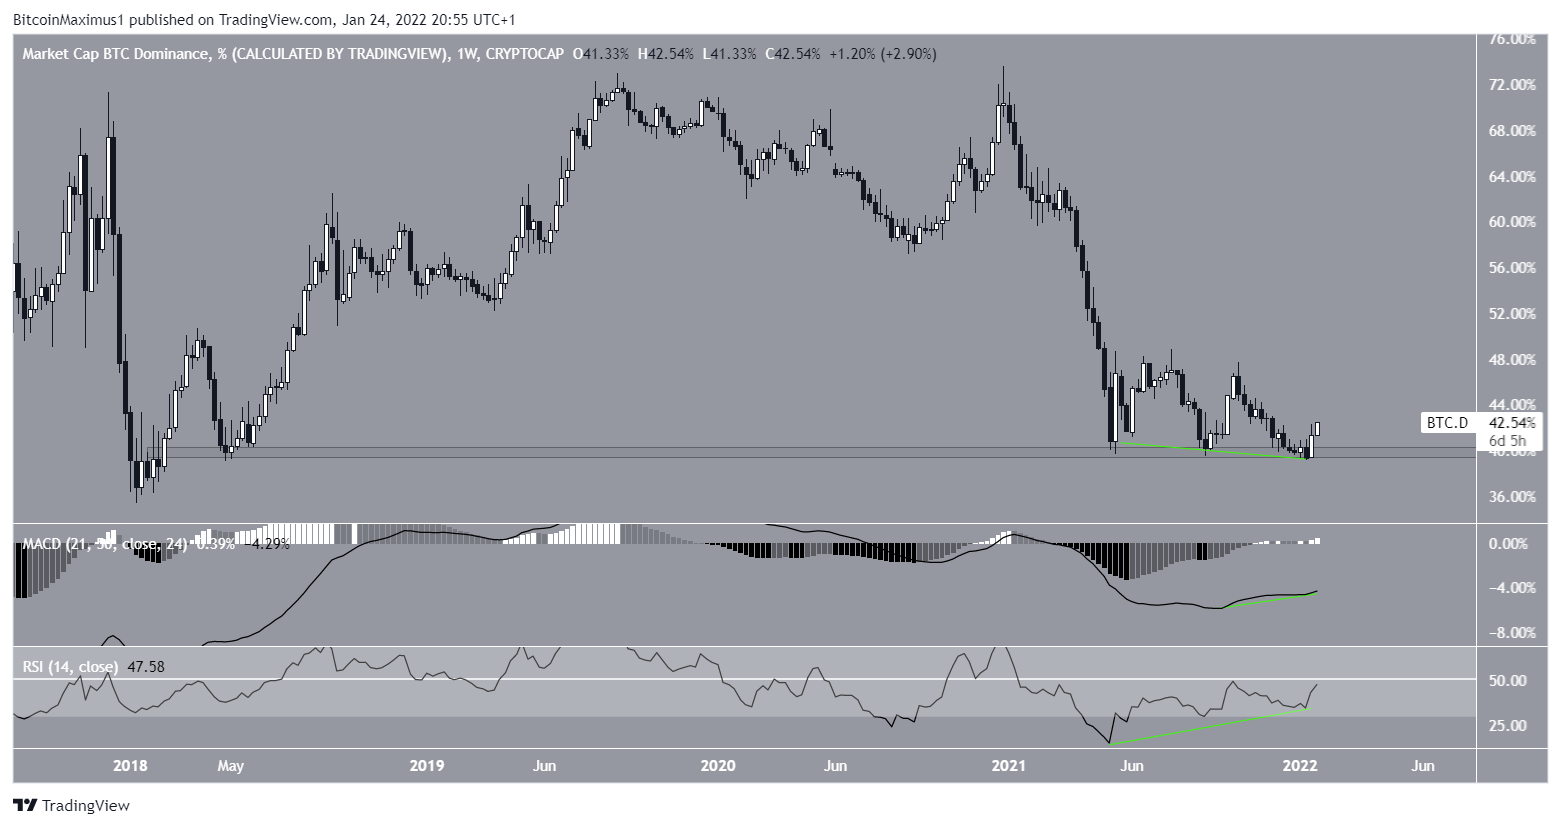
The weekly chart shows that the 40% support zone is the last line of defense before a new potential record low in the rate. A move of the BTCD below this zone could be the catalyst for a sharp decline.
Both the MACD and the RSI have generated considerable bullish divergences (green line). This suggests that an upside move is likely to follow.
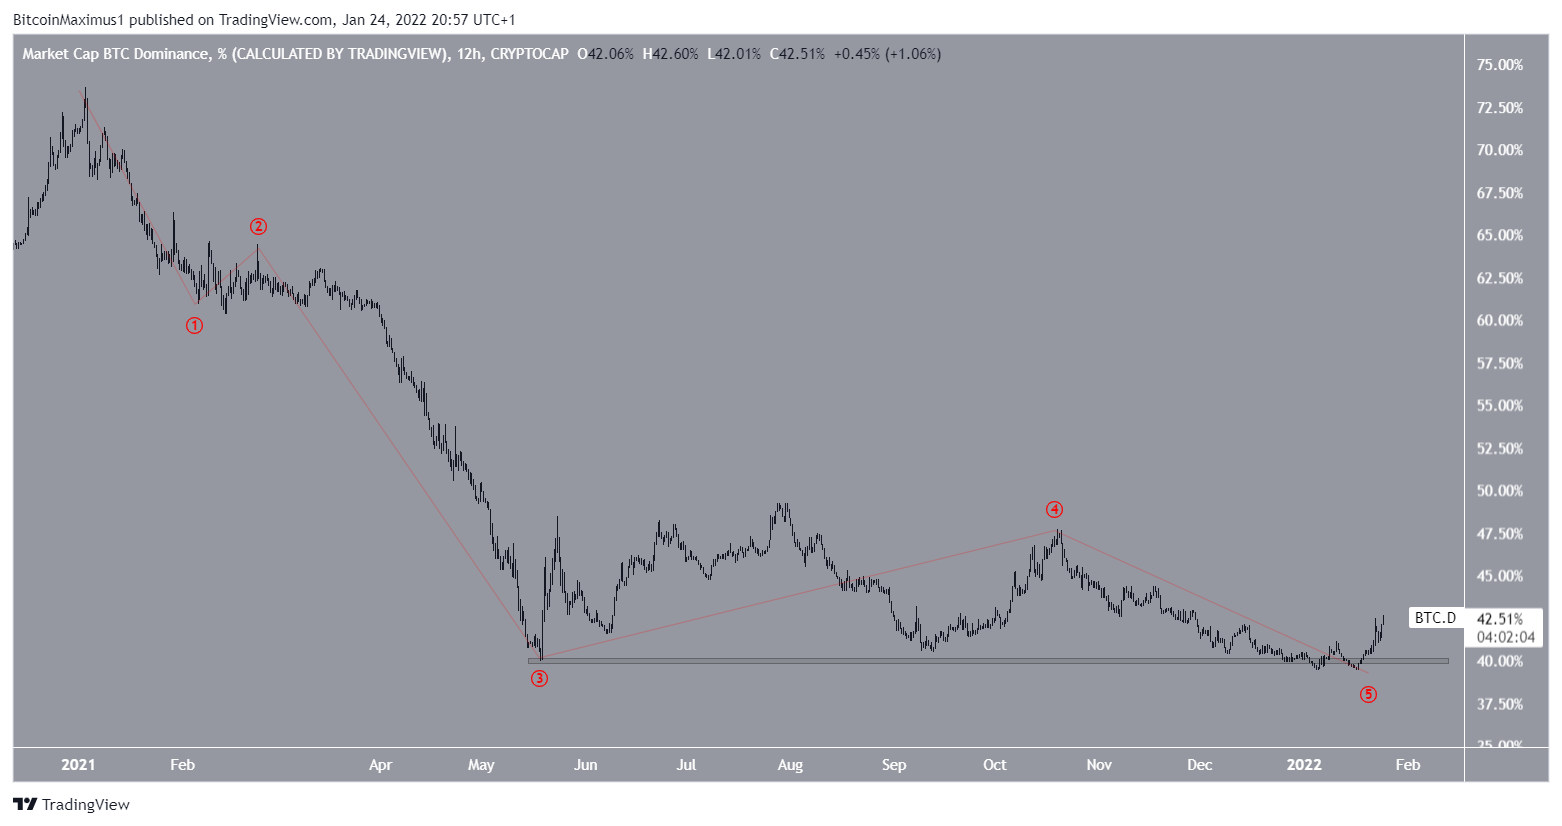
Finally, measuring the move from the 2021 high, we see that a five-wave bearish pattern has already been completed. Although it is possible for the fifth wave to expand, the structure appears complete as is.
Thus, combining this data with that of the daily data, the most plausible scenario seems to be that the BTCD ends up falling below the 43.45% – 44.45% zone.
Disclaimer
All information on our website is published in good faith and for general information purposes only. Any action taken by the reader based on information found on our website is entirely at their own risk.