Bitcoin (BTC): Bitcoin again falls below MA200
BTC course: 46,805 USD (previous week: 47,639 USD)
Resistance / goals: $ 47,070, $ 48,222, $ 49,487, $ 51,307, $ 52,125, $ 53,005, $ 54,077, $ 55,817, $ 56,979, $ 57,901, $ 59,778, $ 61,771, $ 63,189, $ 64,896, $ 66,299, $ 67,416, $ 69,000 $ 70,856, $ 76,472, $ 77,678, $ 85,563, $ 87,090, $ 89,982, $ 100,259, $ 114,961
Supports: $ 45,474, $ 44,851, $ 42,542, $ 40,585, $ 39,581, $ 37,389, $ 36,643, $ 34,899, $ 30,000, $ 28,810, $ 26,170
The Bitcoin course failed to initiate a break free even in the last seven days of trading. The abandonment of the moving average price of the last 200 trading days (MA200) (green) at USD 48,222 caused a further price decline back towards the key support at USD 45,474. At the moment, however, the bulls have been able to defend this price mark. A first sign of stabilization would be a recapture of USD 47,070.
Should the support zone between USD 45,474 and USD 44,851 be abandoned, however, a relapse to the low of USD 42,542 should be planned. Investors should keep an eye on the Nasdaq (NDX) technology index. If the weakness in the technology sector spreads in the coming weeks and months, the crypto sector could also be affected. At the moment, it is also important to continue to monitor closely how the Bitcoin price behaves at the price marks mentioned.
Bullish scenario (Bitcoin price)
The Bitcoin bulls were able to avert a price slide back below USD 45,474 this week as well. The price threatened to drop below USD 45,474 several times, but Bitcoin whales have prevented this so far. For their part, the bulls must now do everything in their power to buy the BTC rate back above USD 47,070 towards USD 48,222. A first directional decision can be expected at this multiple resistance consisting of EMA20 (red), MA200 and horizontal resistance line. Bitcoin has recently failed here again and again. If this price level is regained and a jump back over the broken purple downtrend line is achieved, another strong hurdle awaits at USD 49,487. The EMA200 (blue) is currently running here. Should the buyer be able to break through this resistance as well, a subsequent rise to the zone between USD 50,790 and USD 51,307 is to be expected.
If the Bitcoin price does not rebound dynamically towards the south, the trend high at USD 52,124 will come into focus again. Since the supertrend and the upper Bollinger band also run in this area, a breakthrough is not to be expected at the first attempt. Rather, the BTC price has to bite into it and knock the resistance soft. If the bulls succeed in breaking out of this strong resist, the buying side will have to do everything possible to recapture the orange zone between USD 53,005 and USD 54,077. Only a stabilization above this area brightens the chart in favor of the bulls and activates the next price target at USD 55,817. If the Bitcoin price can also regain this resistance level, price targets at USD 56,979 and USD 57,901 will come into the focus of investors as targets. Here, the BTC rate failed several times in November 2021.
The all-time high again in view
If the bulls can muster enough strength and break through these resistance levels, a medium-term directional decision can be expected at USD 59,778. The bears will do everything in their power to cap the BTC rate here. A daily closing price above the psychologically important USD 60,000 reverses the picture in favor of the buyer. Bitcoin should immediately target USD 61,771 and, if overcome, penetrate directly into the zone between USD 63,189 and USD 64,896. If Bitcoin does not rebound significantly to the south and can also leave the high of November 15 at USD 66,299 behind, a march above USD 67,416 towards the high at USD 69,000 is likely. As long as the USD 60,000 is not recaptured, new sales by the bear camp can be expected at any time.
Bearish scenario (Bitcoin rate)
The bears keep the scepter firmly in their hand. Only the massive resistance from large Bitcoin whales prevented a relapse below the strong support level at USD 45,474. The fact that the last countermovements towards the north are gradually losing momentum currently indicates a breakthrough in this support in the coming days. Investors should, however, wait for a closing price below this support level, not infrequently there was a fake outbreak on the underside to collect stop-loss orders and then head north again. If Bitcoin falls below this support and USD 44,851 is also sustainably undercut, the low of USD 42,542 comes into view as the first target. The bending lower Bollinger Band also indicates increasing volatility on the underside. If the support at USD 42,542 does not stop either, the correction extends immediately to USD 40,585.
From here on it gets tricky
This would put the BTC rate again threateningly close to the trailing edge at USD 39,581. If the bulls do not come back on the floor here either and Bitcoin trades below this support at the weekly closing rate, there is a risk of the trend dynamic accelerating towards the south. A relapse to the 23rd Fibonacci retracement at $ 37,389 is likely. If this support is also abandoned, the sell-off will expand into the turquoise zone between USD 36,643 and USD 34,899. A price recovery is conceivable based on this area, as long as the USD 40,000 is not recaptured, the recovery is purely technical in nature. A break of $ 34,899 extends the sale straight to $ 30,000. If the bulls cannot defend this price level either and the 2021 low of USD 28,795 is abandoned, the sell-off could expand into the light green zone between USD 26,170 and USD 27,562. The expected retest of the outbreak level at USD 20,000 is also conceivable as a result.
Bitcoin dominance: Bitcoin’s market power with a new trend low
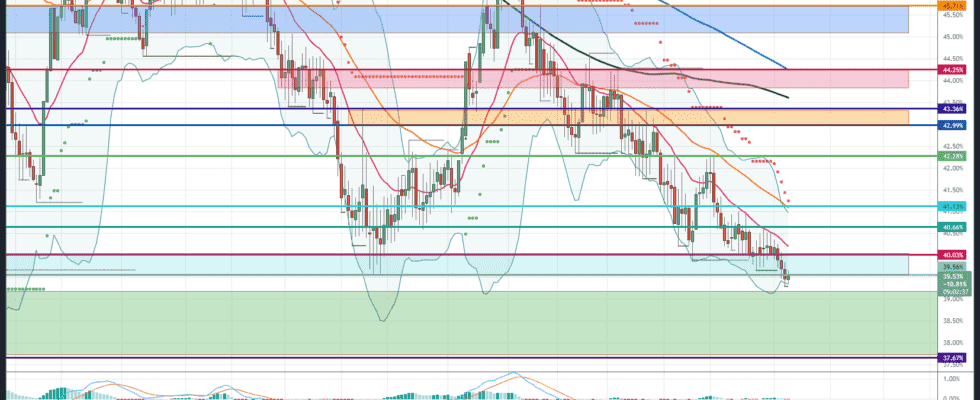
After months of narrow trading range around 40 percent, the dominance formed a new 52-week low on Tuesday, January 4th, 2022. At the time of this writing, the market power of the crypto reserve currency is trading at 39.53 percent, which is just below the previous low of 39.56 percent. So a preliminary decision seems to have been made. If the BTC dominance cannot rise back above 40.03 percent by the end of the week, the bearish scenario of falling market dominance threatens to materialize.
BTC Dominance: Bullish Scenario
The BTC dominance slipped again below 40.03 percent in the past trading days and subsequently also fell below the low from September 2021 at 39.56 percent. In order to prevent further slipping, it is now imperative to regain this mark and ideally also to rise back above 40.03 percent. Just above the EMA20 (red) is the next hurdle. Only when the EMA20 can be broken should a subsequent increase of up to 40.66 percent be planned.
If this resist is then also overcome, the multiple resistance at 41.13 percent comes into focus. The EMA50 (orange), the upper Bollinger band and the supertrend in the daily chart run here. Here the dominance will very likely bounce off again towards the south. For the time being, this chart mark represents the make-or-break level. If, contrary to expectations, the BTC dominance should be able to overcome this strong resistance at the daily closing price in the coming weeks, the target is 42.28 percent. From the current perspective, this price level also represents the maximum medium-term bullish price target.
BTC Dominance: Bearish Scenario
As already suspected in the previous week’s analysis, the 39.56 percent could not be defended by the cops forever. The break in this strong support should have a signaling effect. In the last few days of trading, the outperformance of many Altcoins compared to Bitcoin could be well observed. While the crypto reserve currency is around 33 percent below its peak, several Altcoins have made new all-time highs in the past few days. Even the second largest cryptocurrency, Ethereum (ETH), is trading only 22 percent below its all-time high, despite a price correction.
If the BTC dominance cannot turn back to the north in a timely manner, and also gives up 39.56 percent at the weekly closing rate, the trend movement threatens to expand immediately to 37.67 percent. A last attempt should be made here to avert the final fall in BTC dominance towards 30 percent. If there is no dynamic upward movement in this area towards 40 percent and above, a relapse to the psychologically important 30 percent mark is only a matter of time. This development is to be welcomed, especially for the independence of alternative crypto currencies. Project- and development-related positive price development of Altcoins are then no longer downright choked by a weakness of Bitcoin.
Disclaimer: The price estimates presented on this page do not constitute buy or sell recommendations. They are only an assessment of the analyst.
The chart images were created using TradingView created.
USD / EUR exchange rate at the time of going to press: 0.88 euros.