The bears appear to have taken the helm at Solana for now. The Sol price corrected by 16 percent following the recent SEC designation as an unregistered security. This means that the high-speed blockchain, like Cardano (ADA) and the Binance Coin (BNB), is in a short-term course correction. The upward trend discussed in the last price analysis on April 25 has thus been resolved in a bearish way for the time being. Due to the price slump in the last few trading days, the SOL price slipped below the moving average of the last 200 days (MA200) (blue) after having defended it several times in the previous months. The task of the turquoise chart area now puts the focus on the orange support zone between US$17.78 and US$16.96. The last time buyers were able to defend this area was in March on a daily basis. An initial brightening of the chart image is only given when the horizontal resist is recaptured at US$ 22.23.
Solana: Bullish price targets for the next few weeks
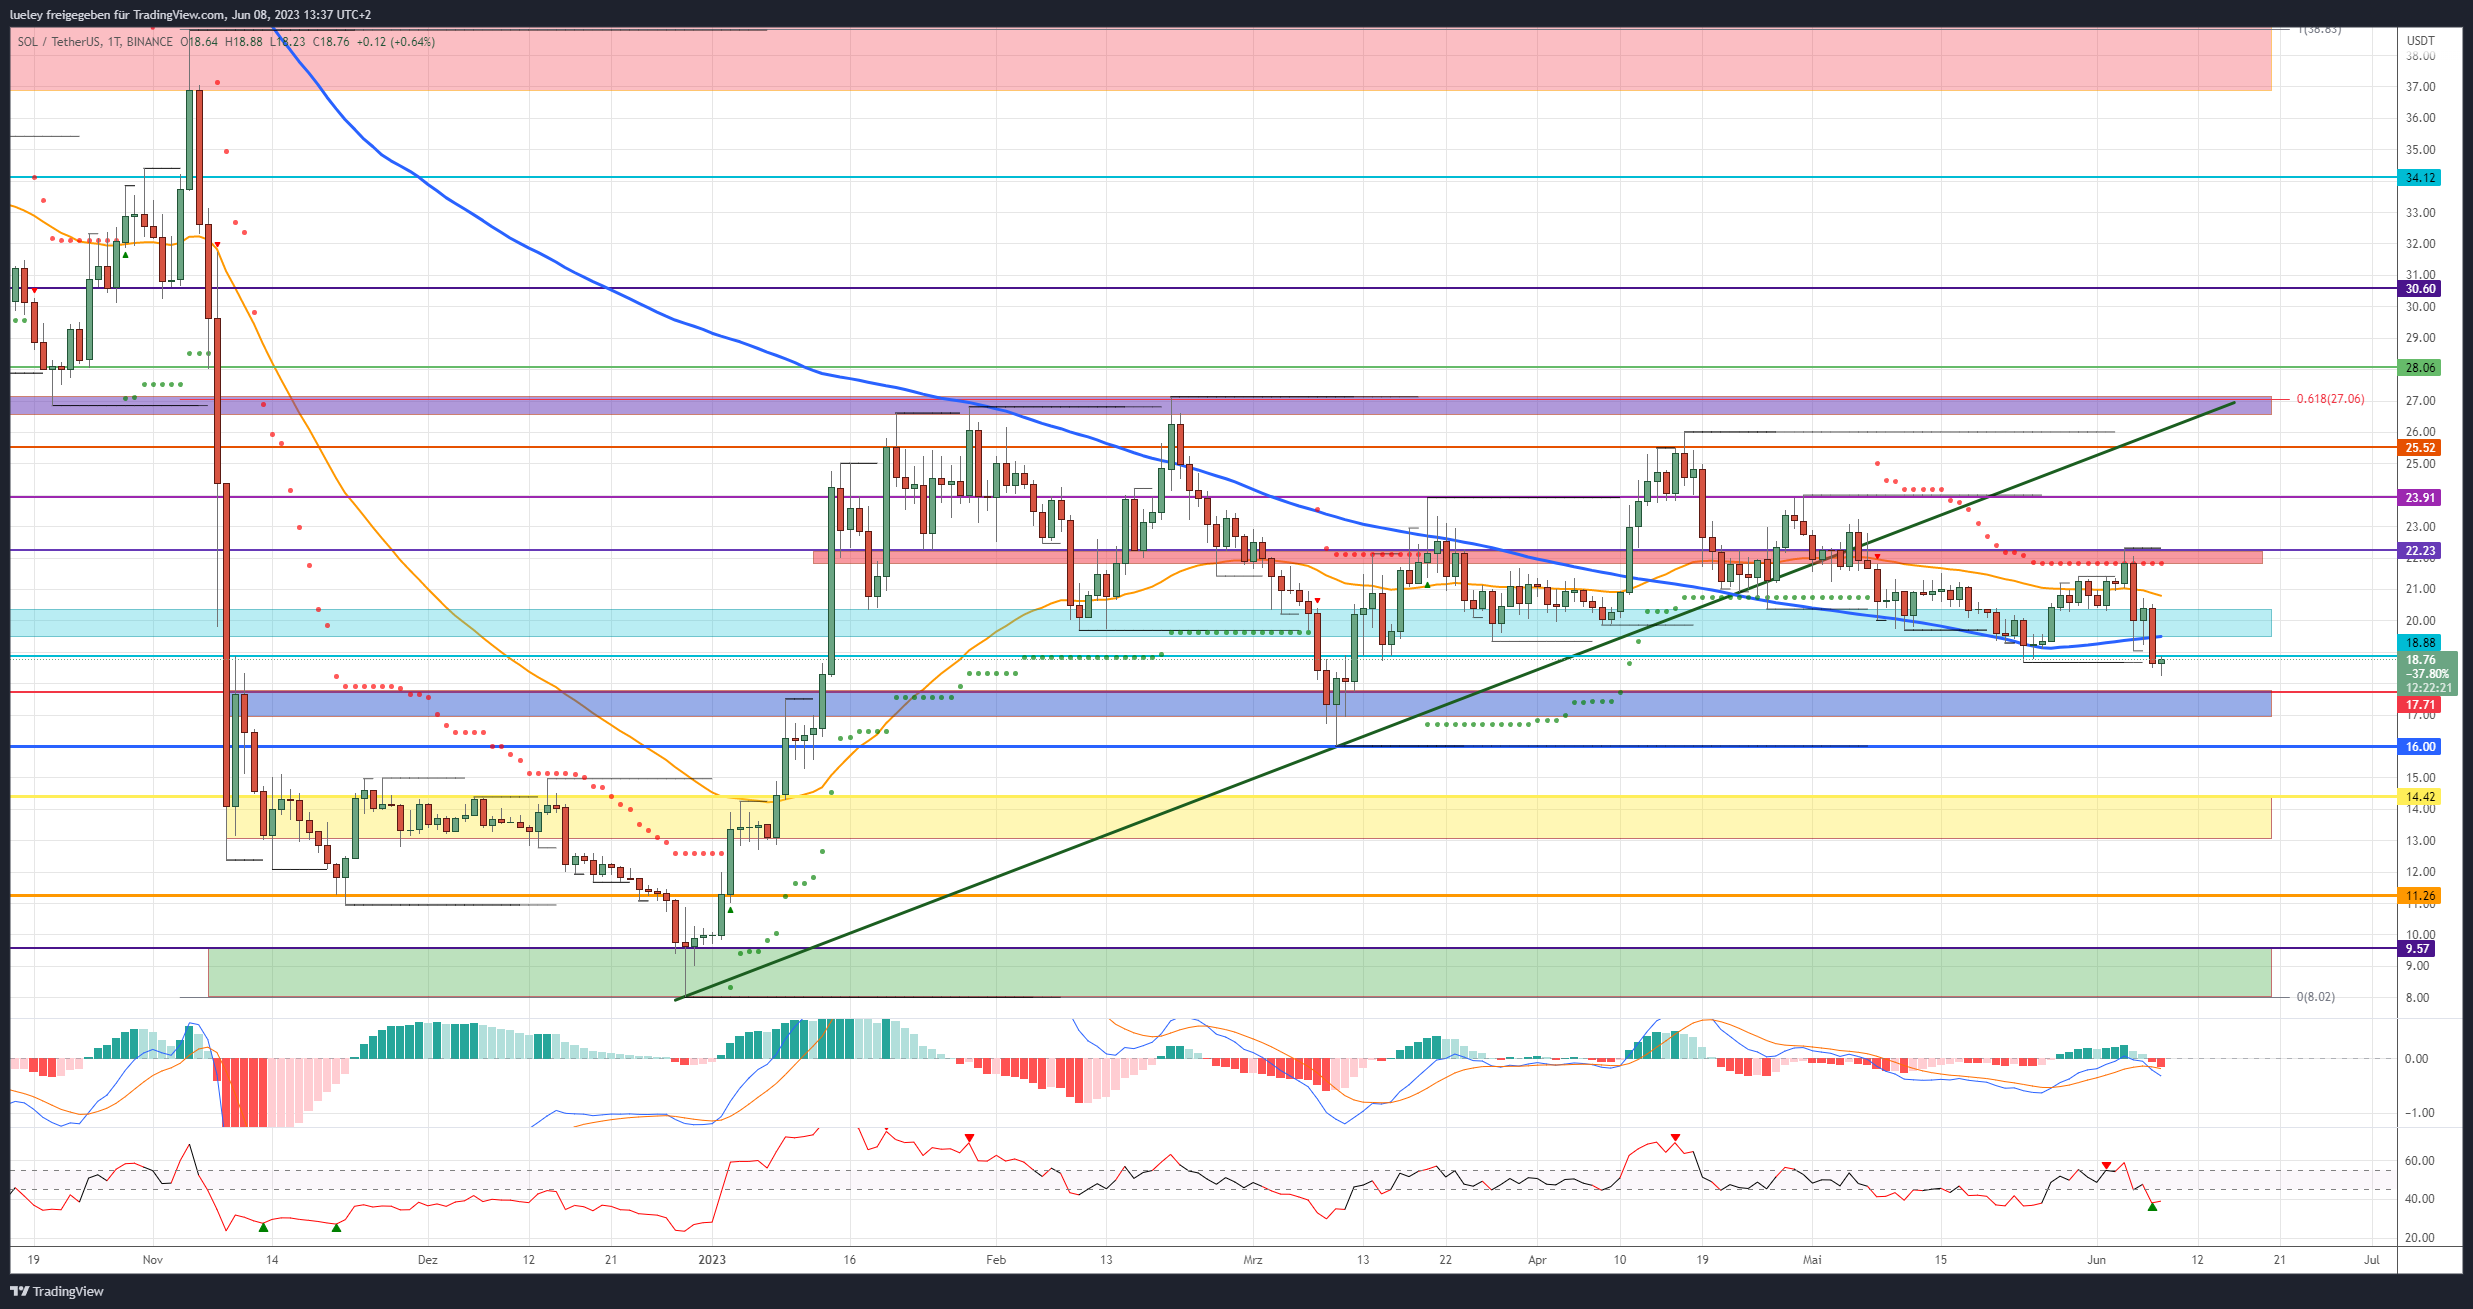
Bullish price targets: $18.88, $19.52/20.38, $22.23, $23.91, $25.52, 26.58/27.12 USD, 28.06 USD, 30.60 USD, 34.12 USD, 36.87/39.01 USD
Solana has since corrected to a new 10-week low of $18.23 in the last few hours of trading. In order to prevent a sustained sell-off in the coming days, the buyer side must promptly heave the SOL price back above the price mark of USD 18.88 in the direction of the MA-200 at USD 19.52. A preliminary decision can be expected here. Only if Solana overcomes this price mark at the end of the day does the upper edge of the turquoise zone at 20.38 US dollars come into focus as the first target mark.
If the bulls succeed in this price recovery and the SOL price can subsequently save itself above this resistance, that would be a first partial success. If Solana then also overcomes the EMA50 (orange), currently at $20.79, the red resist zone around the monthly high will come into focus again. The super trend in the daily chart is also currently running here. However, given the current news situation and the bearish chart picture, a direct price breakout seems unlikely.
If, contrary to expectations, the buyer side manages to pulverize the resist level at 22.23 US dollars, the chance of a recovery to the horizontal resistance at 23.91 US dollars increases noticeably. This is where Solana last failed at the end of April. Profit-taking must therefore be planned for at this price level. Only if the SOL price can stabilize above this resistance mark will the area around the April high of 25.09 US dollars return to the attention of investors.
That would put Solana back within striking distance of its highs for the year of between $26.58 and $27.12. In addition to the Golden Pocket, the recently abandoned green uptrend line can also be found here. From the current perspective, this area represents the maximum price target that can be expected for the coming trading weeks.
Solana: Bearish price targets for the next few weeks
Bearish price targets: $17.71/16.96, 16.00 USD, $14.42, 13.08 $11.26, $10.94, $9.57, $8.01
As long as the SOL course remains capped below the turquoise zone, the view should be directed further south for the time being. A price drop to at least 17.71 US dollars must be planned for. If Solana shows no reaction at the top of the blue support zone, the correction will extend to the bottom of this support area at $16.96. Here, the buyer side last stabilized the SOL price in March 2023. A retest of the low on March 10 at US$ 16.00 would also be conceivable.
A preliminary decision for the coming weeks of trading should be expected at the latest. If Solana falls below this support at the end of the day, follow-up charges can be expected. Solana should then break to the top of the yellow support area at $14.42. Here is the breakout level from the beginning of the year. In the first touch, the SOL course should initially bounce off this mark to the north. If the SOL price falls below this level, the lower edge of the yellow support zone at $13.08 will come into focus. Here it is up to the cops to fly the flag at the latest.
If this support breaks in the coming months, a retest of the horizontal support line at $11.26 becomes increasingly likely. Solana would have given back all profits from 2023. If the SOL course does not clearly turn north here and then continues to tend to be weak, a fall back into the green support zone between USD 9.57 and the previous year’s low of USD 8.02 could no longer be ruled out. However, such a strong price slump would only be conceivable if the key cryptocurrency Bitcoin were to sell back towards its historical low of 15,460 US dollars.
Looking at the indicators
In the shorter time periods, the RSI already reached an oversold state and already formed a bullish divergence in the hourly chart. In the short term, this could have a stabilizing effect on Solana’s price. However, on a daily basis, both indicators, RSI and MACD are showing a sell-signal. However, at 38, the RSI is also hovering near an overbought status. In the weekly chart, however, the RSI generated a fresh sell signal with the fall below the neutral zone, which the buyer side should negate as soon as possible. The MACD is also increasingly turning south in the weekly chart, but has so far still shown a weak buy signal.
Disclaimer: The price estimates presented on this page do not represent buy or sell recommendations. They are merely an assessment by the analyst.
The chart images were created using TradingView created.
USD/EUR exchange rate at the time of going to press: EUR 0.93.
The latest issues of BTC-ECHO Magazine
You might also be interested in this