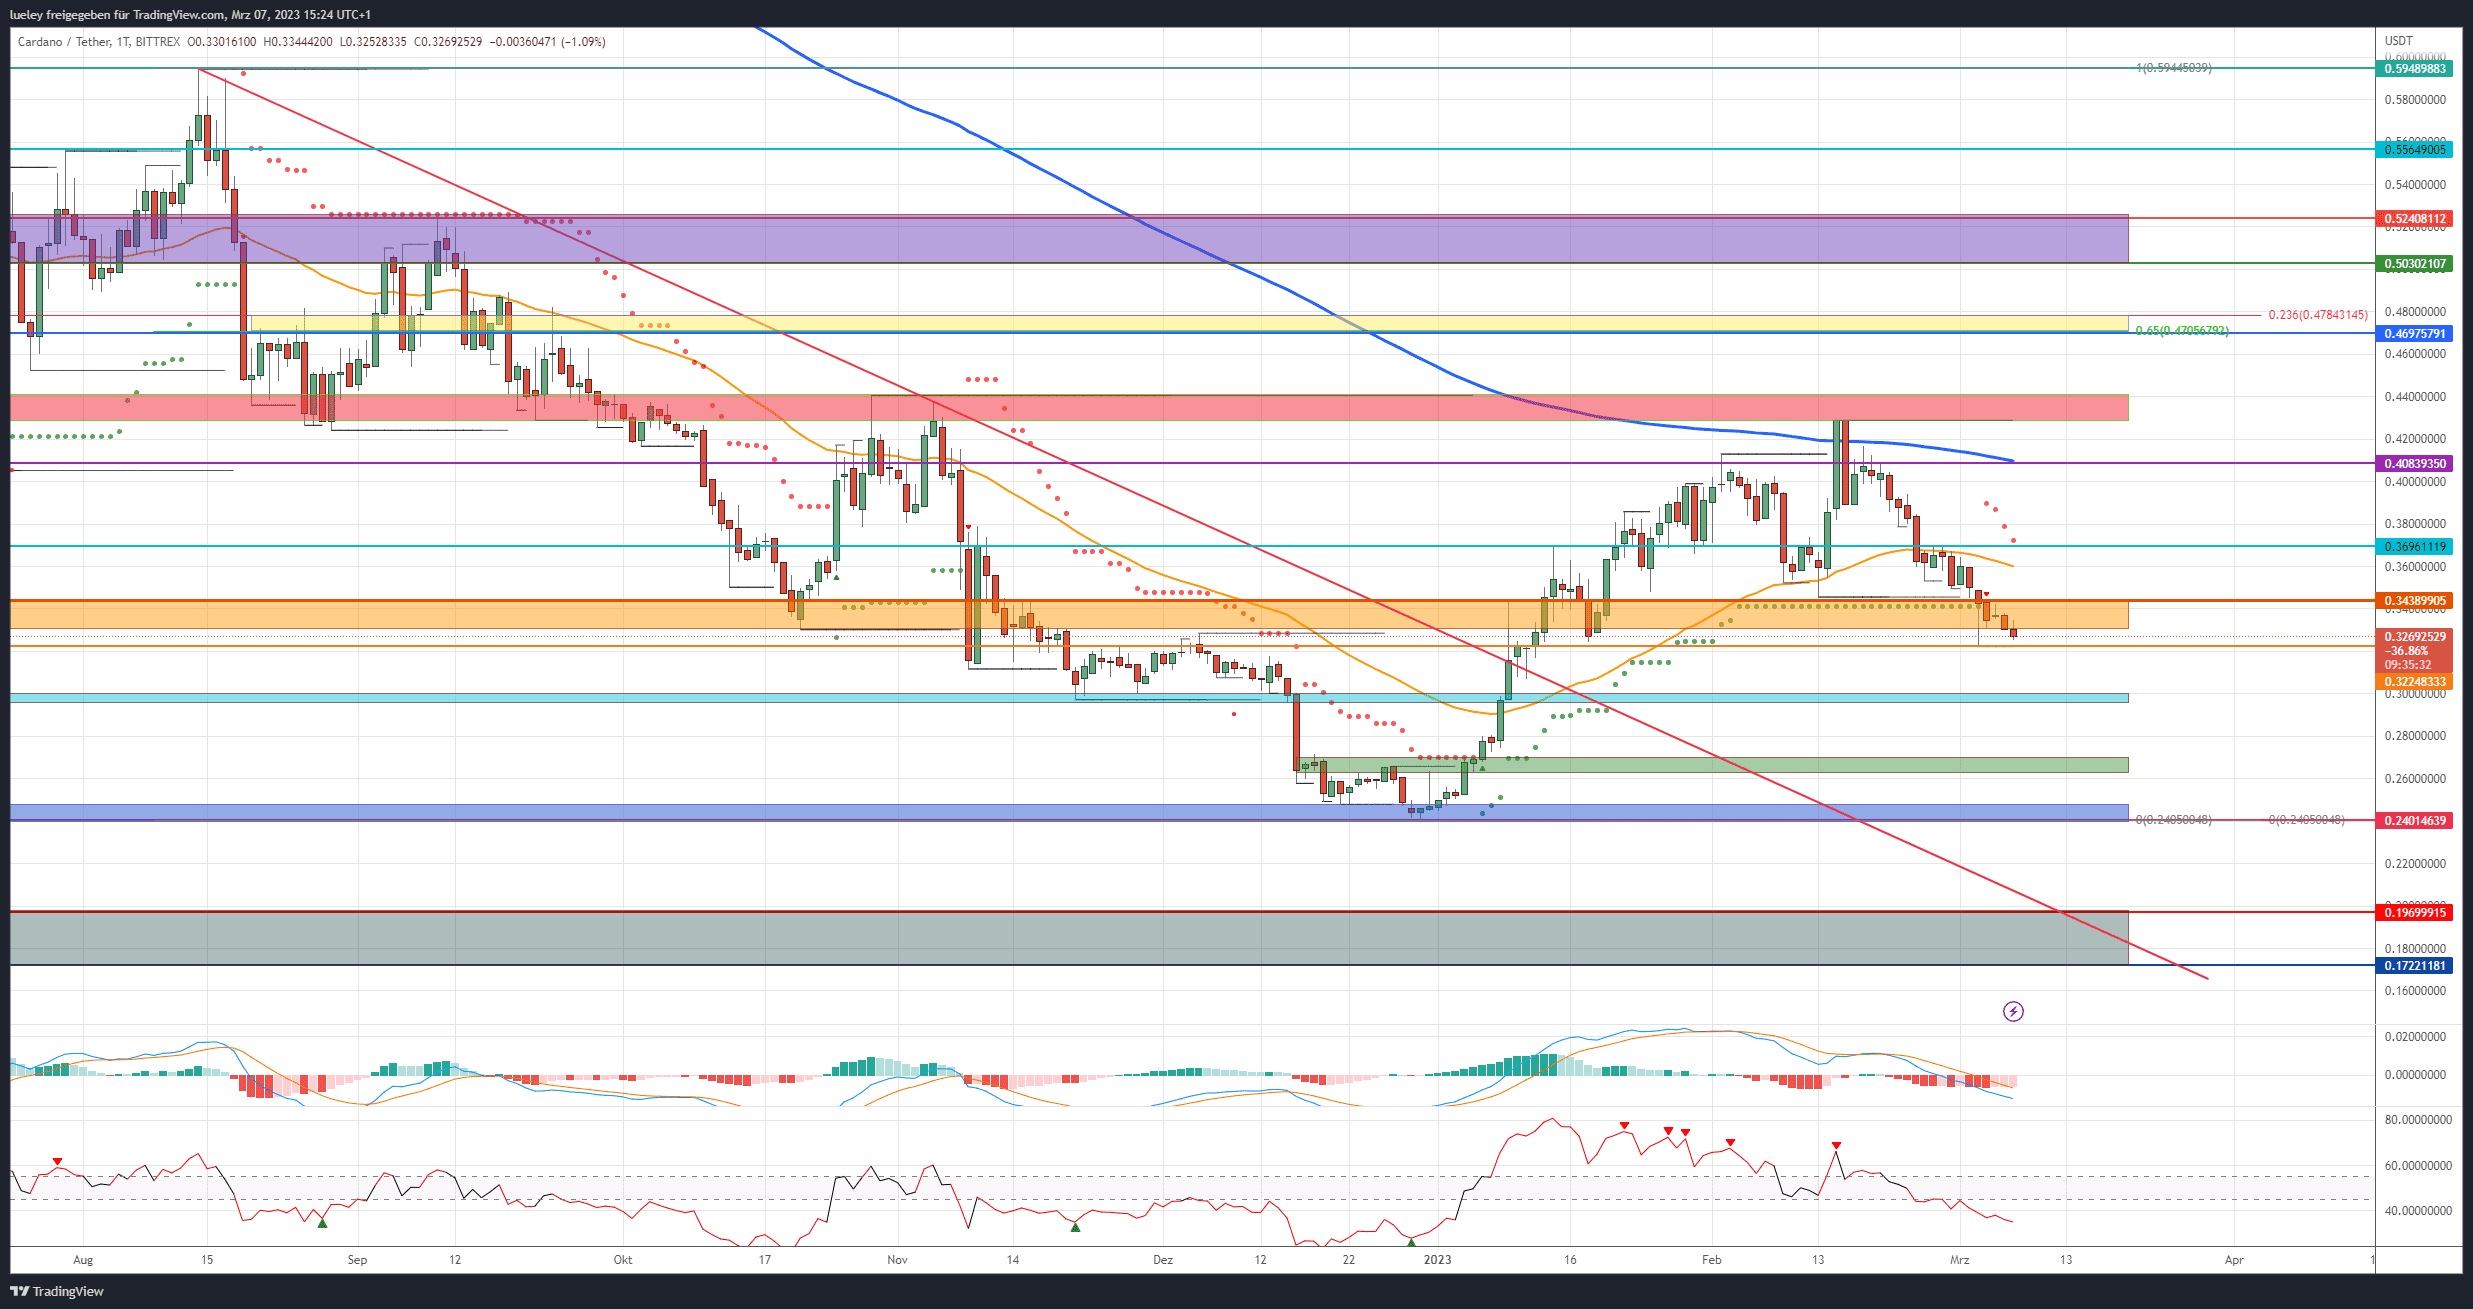
Cardano clearly failed in mid-February due to the strong cross-resistance of horizontal resist and the moving average of the last 200 days (EMA200) (blue). Since this trend reversal, the bulls have not been able to stabilize the ADA rate. Cardano slid back below the EMA50 (orange) and also recently gave up the supertrend at $0.34. The ADA price is currently trading again at the lower edge of the orange support area around 0.32 US dollars. If there is a sustained pullback below the previous week’s low, an expansion of the correction in the direction of US$ 0.29 should be planned. Only a reconquest of 0.37 US dollars would brighten the chart image again. A directional decision can already be expected in the next two trading days. This Tuesday afternoon and tomorrow, Wednesday afternoon, Fed Chairman Jerome Powell has to answer questions from the US Senate and Congress on the US Federal Reserve’s current monetary policy. The expected increase in volatility is also likely to impact the crypto market.
Cardano: Bullish price targets for the next few weeks
Bullish price targets: $0.34, $0.37, $0.41, $0.43/0.44, $0.47, $0.50/0.52, $0.55, $0.59
- The bulls have looked the other way for the past two weeks of trading. A first ray of hope would be the recapture of 0.34 US dollars. Then, Cardano is likely to extend its recovery towards $0.37. This resistance level must be dynamically recaptured by the buyer side.
- A breakout above the cross resist of the supertrend and horizontal resistance line at $0.37 should then give Cardano new impetus. The purple resistance line around $0.41 comes into view as the first target. The EMA200 is currently also running here. If this price level is recaptured, Cardano should target the red resistance area. The ADA course last failed here on February 15, 2023.
- If the buyer side succeeds in breaking through this resistance with increasing trading volume, the bullish break in the market structure will gain momentum. The focus then shifts to the Golden Pocket at USD 0.47. The higher-level 23 Fibonacci retracement also runs here. A recapture of this price level brings the interim high from September 2022 into the focus of investors. The purple zone between USD 0.50 and USD 0.52 should be viewed as a medium-term upside target.
- Only if the overall market also recovers could Cardano then march through the USD 0.55 to the last significant high from August of the previous year at USD 0.59. This course level is to be regarded as the maximum level of increase.
Cardano: Bearish price targets for the next few weeks
Bearish price targets: $0.29, $0.26, $0.24, $0.20, $0.17
- If Cardano does not find a bottom in the area of 0.32 US dollars, an expansion of the correction towards 0.30 US dollars should first be planned. If this area is undercut by the daily closing price, the breakout level from the beginning of the year in the area of 0.26 US dollars comes into focus.
- If the green support zone fails, a retest of the sell low at $0.24 can be expected. At this price level, a bullish countermovement is to be planned. However, if Cardano cannot form a sustainable double bottom here and the ADA price slips dynamically below the blue support area, the chart picture will become even cloudier.
- A further sell-off into the gray zone between US$0.20 and US$0.17 should be planned. This chart area is derived from the December 2020 breakout zone. In addition, the overriding red downward trend line is currently running here. For the time being, this support level should be seen as the maximum bearish price target.
Looking at the indicators
On a daily basis, the two indicators RSI and MACD show active sell signals. With shows a slight sell-signal. However, the RSI is now slowly trading in the oversold territory at the 35 level, hence a recovery move is conceivable. In the weekly chart, the RSI was not able to recapture the neutral zone between 45 and 55 for the time being and is trending south again. Although the MACD has activated a weak buy-signal, it is appraising below the 0-line. A new impulse to buy would only be generated if the limit were exceeded.
Disclaimer: The price estimates presented on this page do not represent buy or sell recommendations. They are merely an assessment by the analyst.
The chart images were created using TradingView created.
USD/EUR exchange rate at the time of going to press: EUR 0.94.
Do you want to buy cryptocurrencies?
Trade the most popular cryptocurrencies like Bitcoin and Ethereum with leverage on Plus500, the leading platform for trading CFDs (86 percent of retail accounts lose money with the provider).
The latest issues of BTC-ECHO Magazine
You might also be interested in this