Have the bears taken over? – Cryptocurrencies had an interesting start to the year. The price of Bitcoin went from $15,500 to $31,000 in a few months. For its part, Ethereum rose from $880 to $2,150, an increase of 144%. During this period, some altcoins have managed to stand out, but most have struggled to express themselves. Indeed, BTC attracts capital, and the alts only get the crumbs. With this downward movement, are the bears regaining control? Will altcoins experience another wave of declines? Let’s look immediately at the clues left by the graphs.
A bearish signal appears on the capitalization of altcoins
The capitalization of altcoins has succeeded in break the downward trendline initiated at the end of 2021but the course was rejected at the level of the weekly resistance located at $670 billion. Since then, capitalization has fallen by 15%. If the close is confirmed below the last low marked at $575 billionthe price would change dynamics in the medium term:
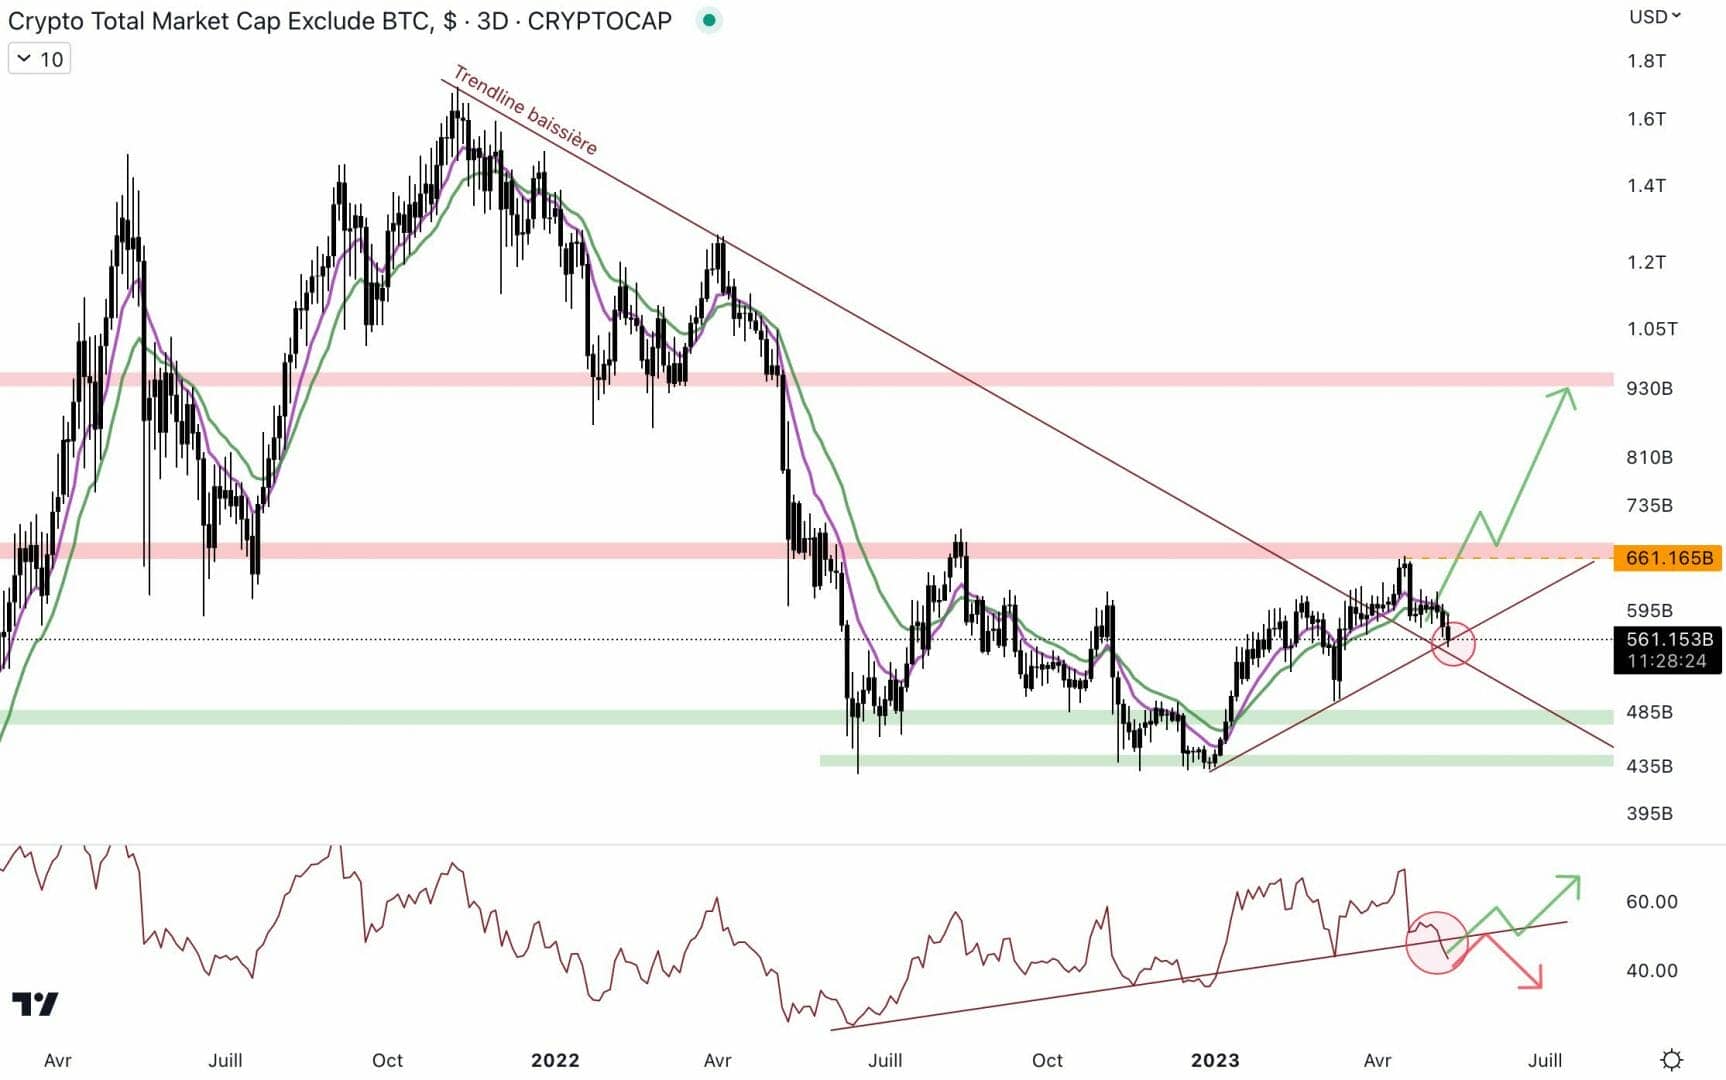
The course is currently at the level of the bullish trendline initiated at the beginning of 2023. In the event of a rebound, the capitalization of altcoins could perform a second resistance test. If the resistance were to give way, the next objective is at the level of the resistance at $950 billion. For this, it will be necessary to close above the last peak marked at $661 billion.
On the other hand, if the price breaks the bullish trendlineit could reach the next support zone located around 15% lower around $480 billion. The RSI is breaking the bullish trendline. This is a first signal of weakness on the side of altcoins. A rebound must take place quickly to avoid losing the bearish trendline. In the event of a breakout, the sellers would take over the momentum.
Bitcoin Dominance Leaves Dim Hope for Altcoins
Bitcoin dominance has been on the rise for several months, but it seems to slow down since a few weeks :
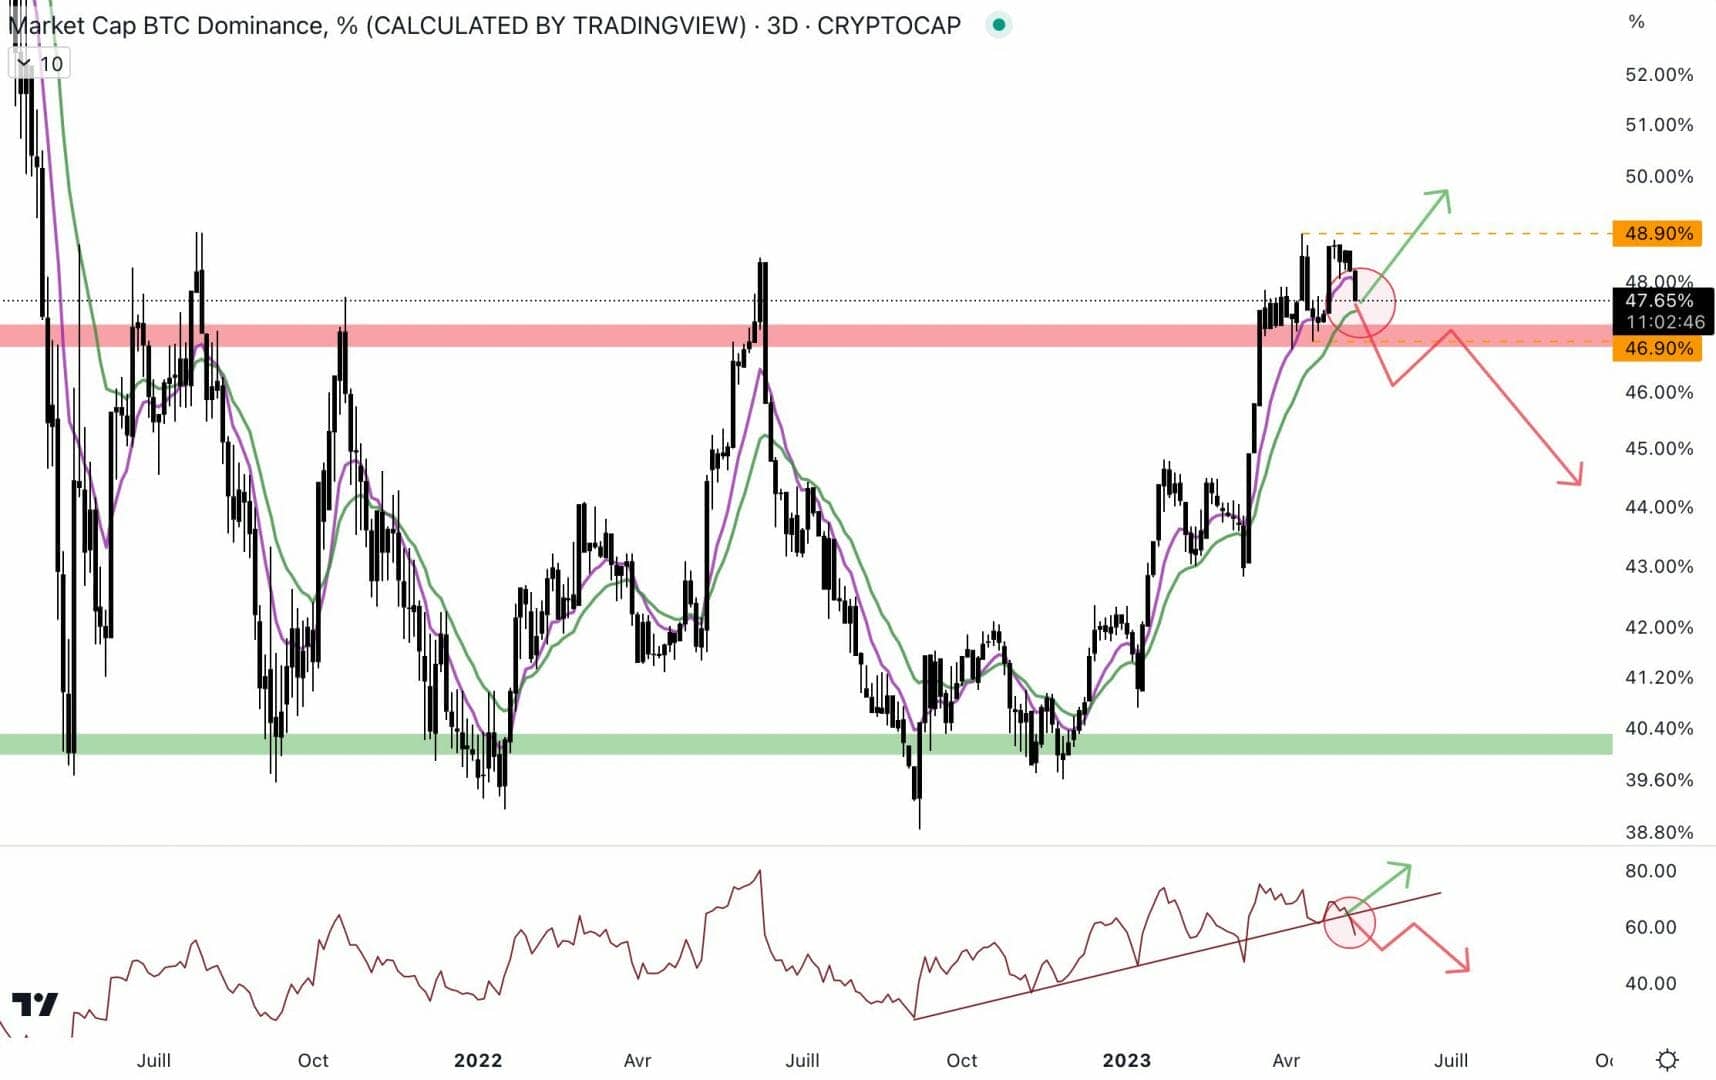
If the price was close to relaunch the bullish momentumat the moment it failed to close above 48.9%. The course is located at the institutional bias (EMA 9/EMA 18) bullish, it could act as dynamic support. Also, the area around 47% of dominance could provide support. On the other hand, if these levels do not hold, and the price is rejected below 47% of dominance, altcoins could take advantage of capital rotation (Red Arrow). In 2022, the altcoins had taken advantage of the summer to regain color.
The RSI is breaking the bearish trendline. If the signal is confirmed, it could show a shortness of breath at the momentum level.
Is Ethereum price changing momentum?
Since the beginning of 2023, ETH has been chaining troughs and ascending peaks. However, the price is falling to the height of almost 20%. A fence below $1,790 would mark a change in dynamics:
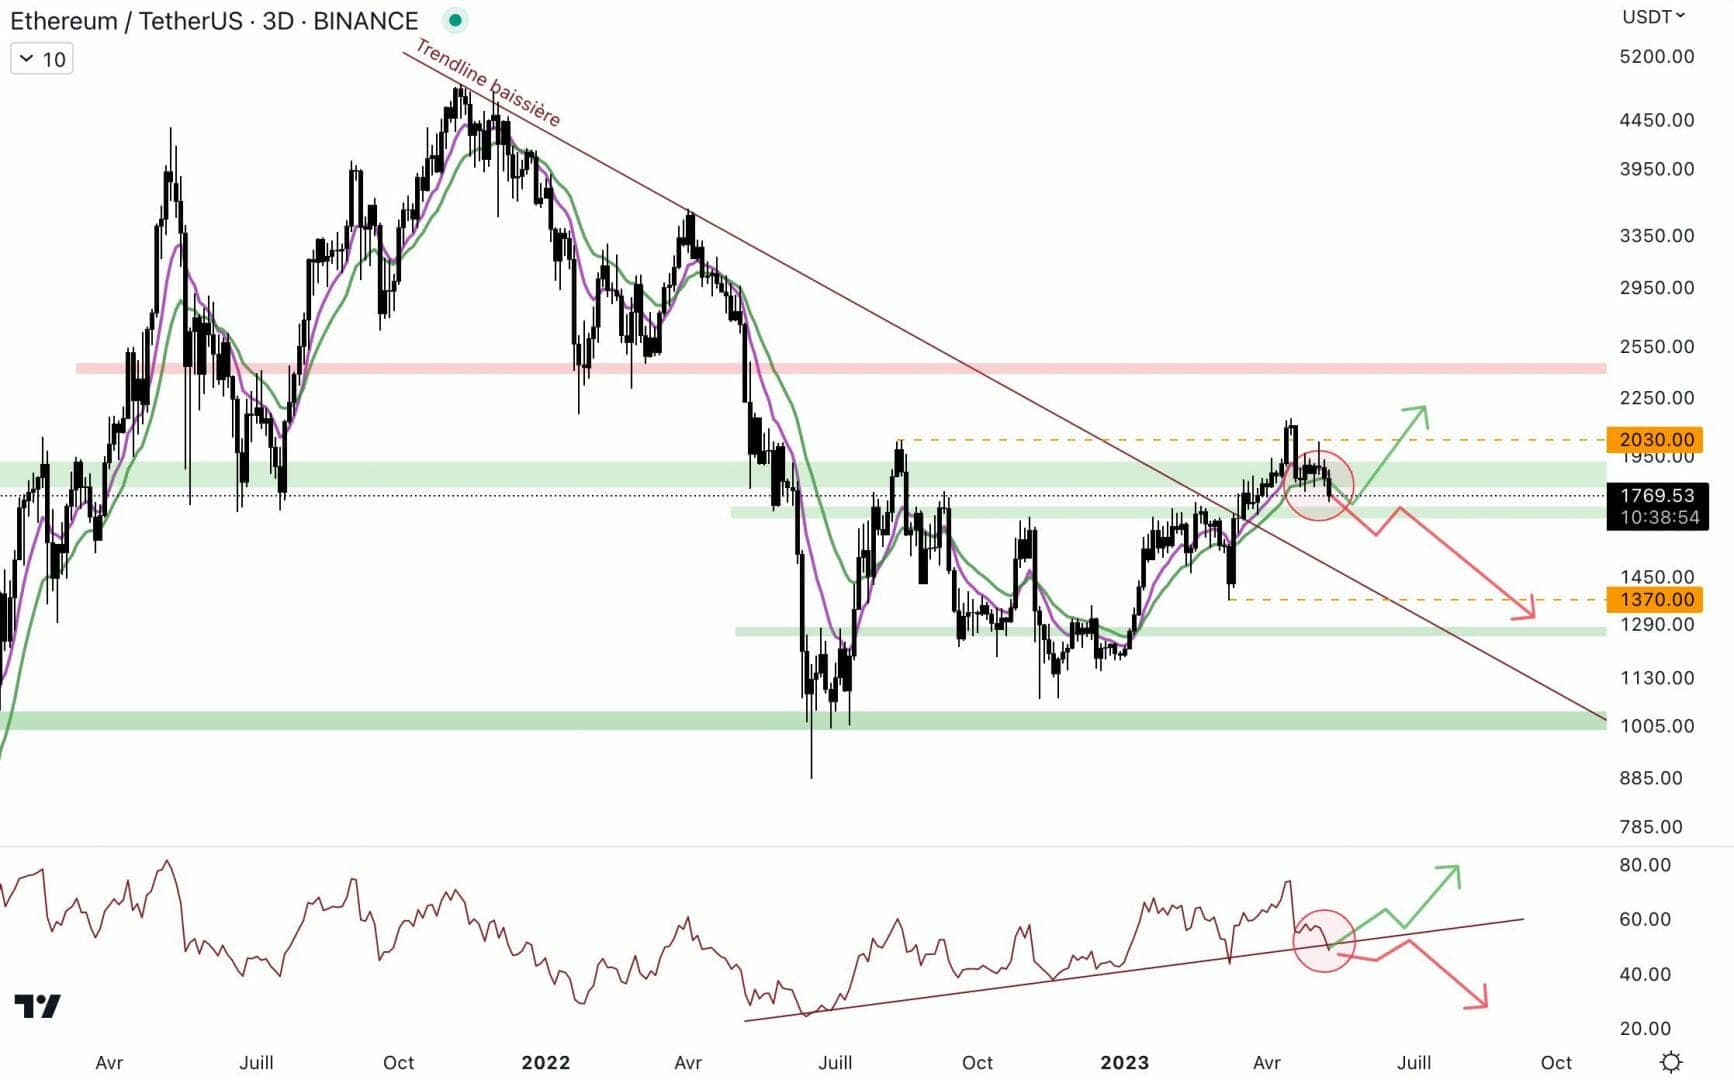
The course is moving towards a support zone located around $1,700. An area that could allow a buying reaction. If the buyers show up, it will take a sharp rebound, capable of breaking the last high at $2,140. This would probably allow the price to return to the level of the next resistance at $2,400. On the other hand, if the support does not allow a rebound, the price could then fall towards the next bracket at $1,270.
For its part, the RSI evolves at the level of the bullish trendline. A rebound is quite possible here, and this would allow maintain momentum. Buyers have the opportunity to react and keep the momentum.
Towards an outperformance of Ethereum against Bitcoin?
It is interesting to watch the ETH/BTC pair, because it allows to measure the strength of the altcoin leader against Bitcoin. We have seen it, for several months now, BTC attracts capital :
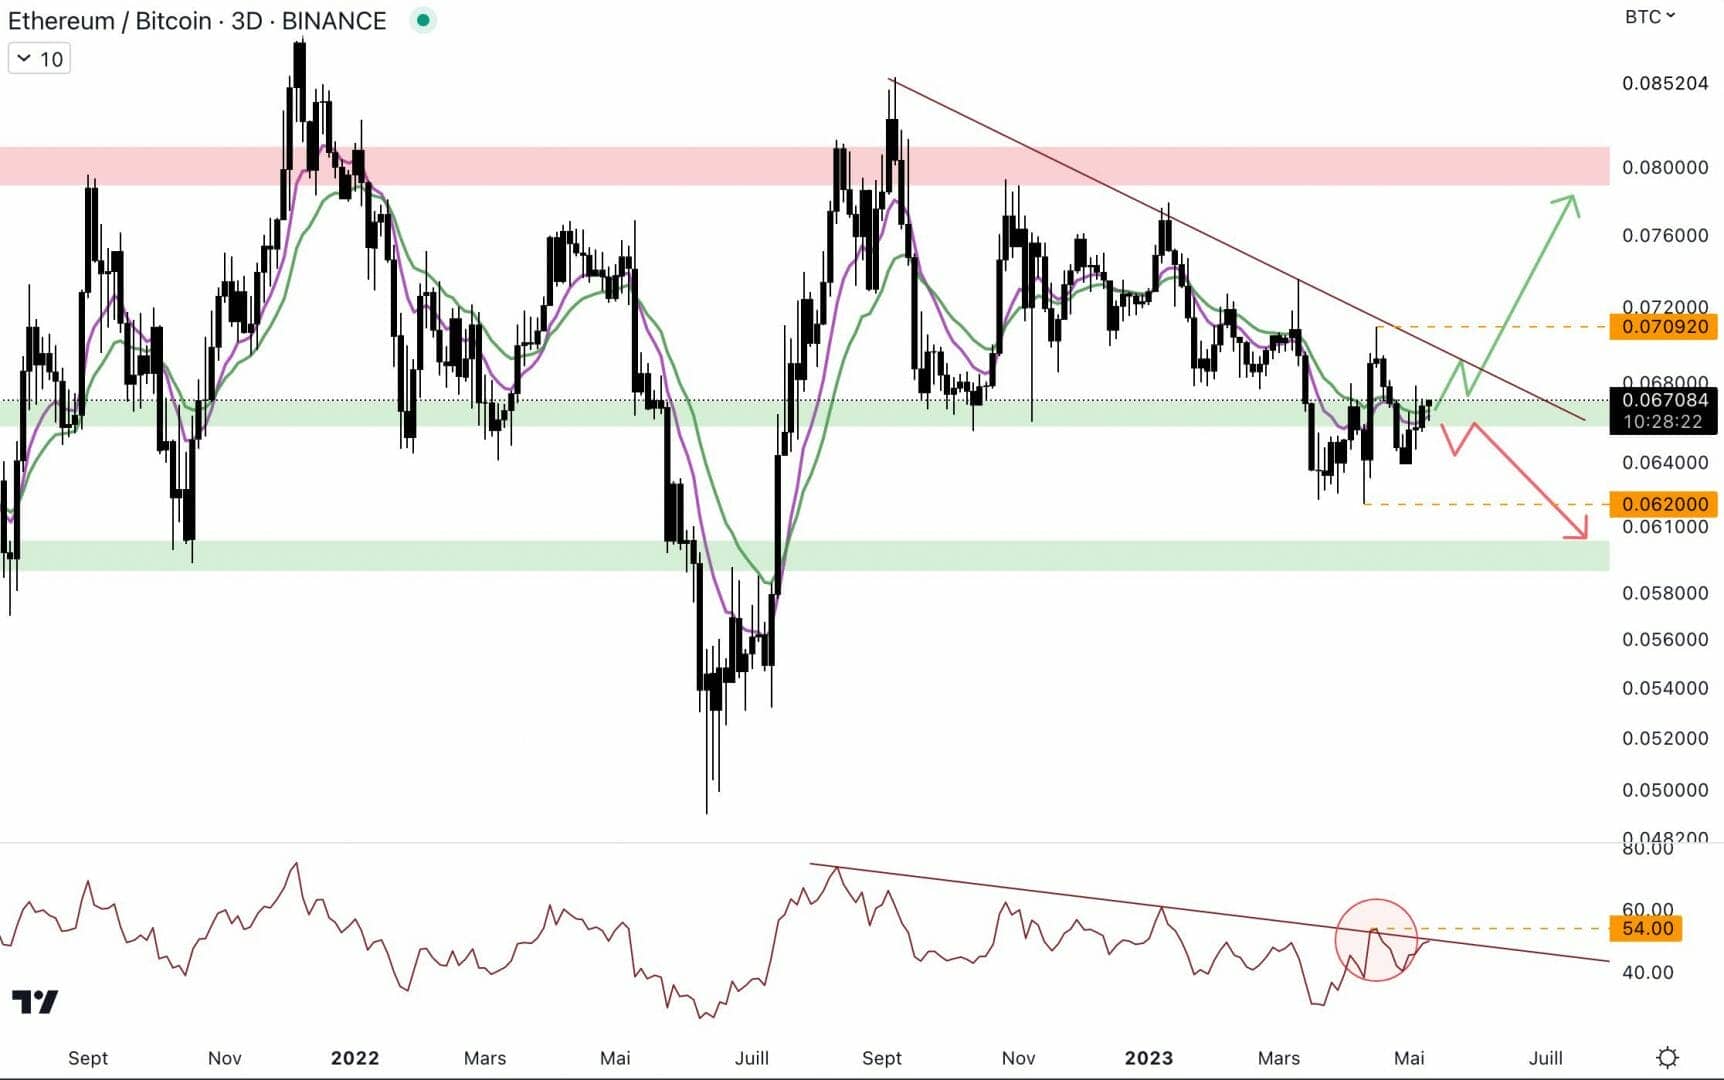
As long as the pair’s price is between the last high at 0.0709 BTC and the last hollow at 0.0602 BTC, the situation is unclear. In effect, the price oscillates at the level of the intermediate zone of the range. If the price goes up again and breaks the last peak, it could head to the level of the resistance. In this case, altcoins could benefit. However, if the price falls and closes below the last low, the price could reach the bottom of range. In this case, altcoins would continue to suffer.
The RSI is trying to start rising again. A fence above 54 would allow to find a dynamic with troughs and ascending peaks, and to break the bearish trendline. A breakout of the trendline could lead to bullish volatility on the ETH/BTC pair.
Technical analysis of the altcoin of the week: Kava (KAVA)
Currently, Kava is the 82nd cryptocurrencies in terms of capitalization. It is also one of the few altcoins that has been in the green for a week in the top 100. Indeed, Kava is posting a increase of more than 16% in one weekit climbs almost 6% in 24 hours. Let’s take a look at the situation of this altcoin on a weekly basis:
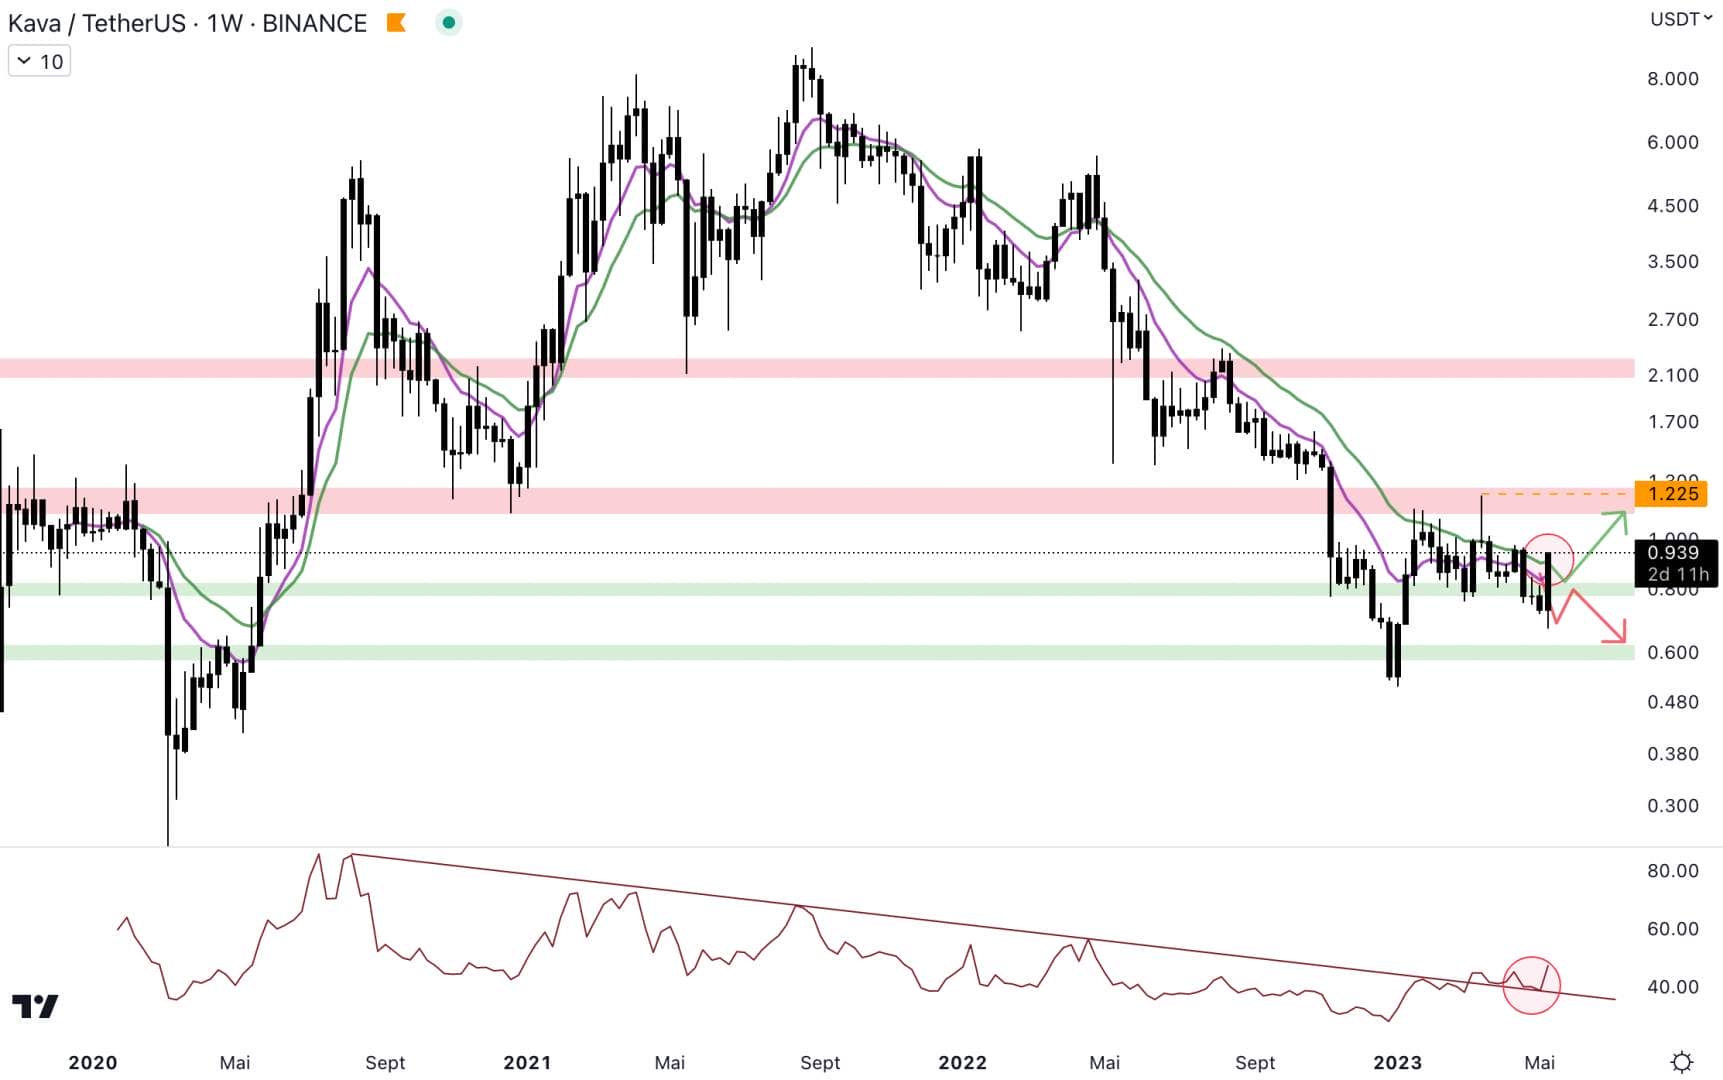
The price reacted at the level of the bracket at $0.8but he must now face the bearish institutional bias. These moving averages have rejected the price several times since the beginning of 2022, it could act as a dynamic resistance one more time. If the buyers react here, the price could join the next resistance around $1.2. Whatever happens, it will be necessary to close above the last high at $1.225 weekly to find a bullish momentum. In the event of a fall, the price could reach the bracket at $0.6.
The RSI sends a bullish signal interesting. Indeed, the bearish trendline initiated in August 2020 is giving way. This could bring bullish volatility if the Bitcoin price stabilizes. The RSI should continue to show bottoms and rising tops.
In the end, the capitalization of altcoins has the possibility to rebound at the level of the bullish trendline, otherwise, the price could fall towards the support at $480 billion. Despite the recent fall, the dominance of altcoins does not confirm at this time. A rejection below 47% dominance would be attractive for altcoins. For its part, Ethereum must react quickly to avoid losing support at $1,700. The buyers’ goal is to get back above $1,900 and break the last high marked at $2,140. The ETH/BTC pair is still in indecision, it would take buyers showing up to get back to the weekly resistance level around 0.08 BTC. If the intermediate range support breaks down, the altcoins could suffer.
The altcoin of the week is Kava, it has climbed more than 16% for the past week. Attention, the price is at the level of a resistance zone with the presence of the bearish institutional bias, the price could fall towards the support at $0.8. Will Ethereum and altcoins rebound, or is the fall just beginning?