
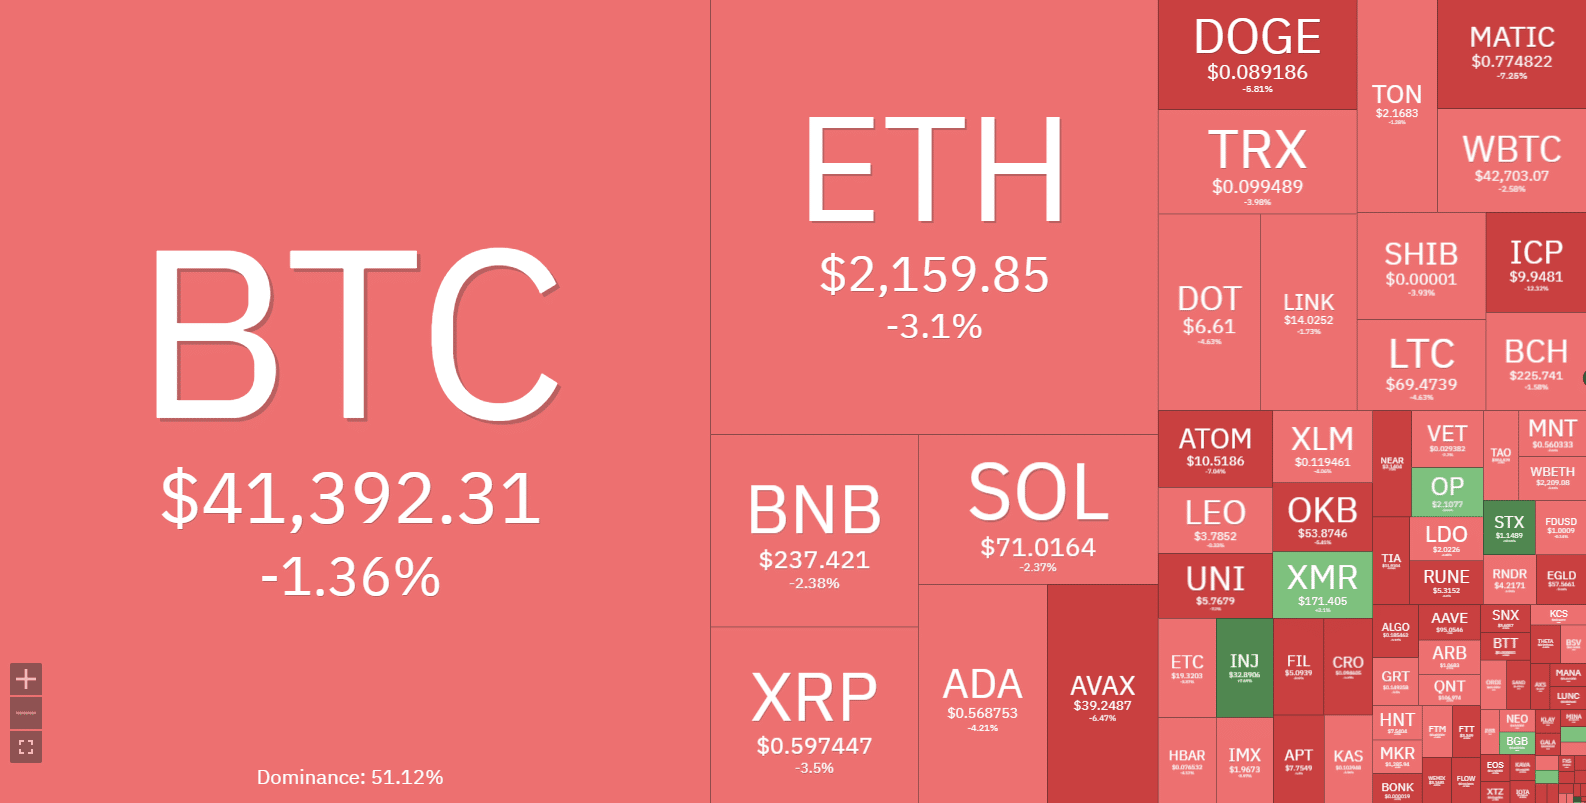
On December 18, 2023, the cryptocurrency market, including Bitcoin (BTC), experienced a significant down day. After nine consecutive weeks of increases, Bitcoin closed a week in the red, trading around $41,200. This drop comes following a rejection below the critical $45,000 zone, marking a short-term trend reversal. Bitcoin also fell below the $42,000 support level, with analysis suggesting it could further move down to lower support levels such as $40,000 or even $38,400 if the trend continues bearish.
Bitcoin spot ETFs and Monetary Policy
The recent meeting between BlackRock and the SEC regarding a Bitcoin spot ETF shows growing institutional interest in cryptocurrencies. Approval of such an ETF would provide institutional investors with a regulated and secure way to invest in Bitcoin, potentially opening the market to a new flow of capital. At the same time, VanEck CEO predicted that all spot Bitcoin ETFs could be approved simultaneously by the SEC, anticipating a significant rise in the price of Bitcoin in the next 12 months, surpassing its previous record of $69,000.
VanEck CEO @JanvanEck3 expect Bitcoin all-time-high in the next 12 months. “It’s an asset that’s growing up in front of our eyes.” Also some good notes on the spot Bitcoin ETF effort and macro cycle. pic.twitter.com/02qZOVBPyx
— Gabor Gurbacs (@gaborgurbacs) December 16, 2023
Concerning the American Federal Reserve (FED) and the fall in rates, it is recognized that fluctuations in interest rates have a significant impact on the cryptocurrency markets. A fall in rates makes traditional investments less attractive, which can push capital toward riskier assets like Bitcoin. The FED’s interest rate decisions are therefore closely followed by cryptocurrency market participants, as they can influence the price direction of Bitcoin and other cryptocurrencies.
The rise in Bitcoin transaction fees
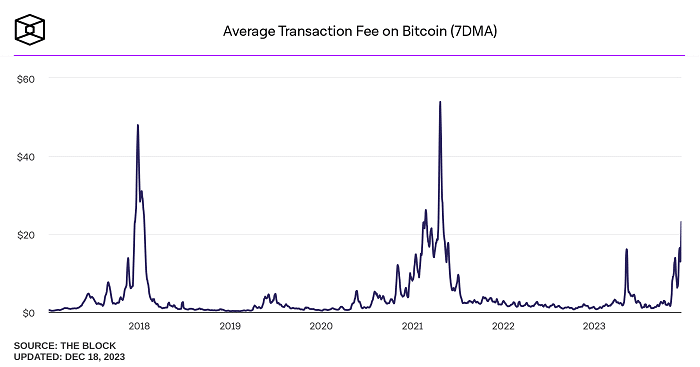
Average Bitcoin transaction fees recently reached almost 40 dollars, a high level since April 2021. This increase is partly due to the growing popularity of Bitcoin Ordinals, a form of “Bitcoin NFTs,” which has led to rising fees. Currently, the Bitcoin network is experiencing a significant volume of pending transactions, highlighting the need for Layer 2 solutions, like the Lightning Network, to effectively manage the growing demand.
Analysis of Bitcoin Supports and Resistances
- Current trend: Bitcoin is currently experiencing a short-term bearish dynamic, having suffered a trend reversal after nine weeks of consecutive increases.
- Resistance level: A key near-term resistance for Bitcoin lies around $41,390, with immediate resistance near the $41,700 level. If BTC manages to break through these resistances, it could target higher levels, including $42,250 and potentially $42,800.
- Support level: The main support levels for Bitcoin can be found around $40,600 and $40,000. A break below these levels could take Bitcoin towards lower supports, such as $38,477 and $38,029.
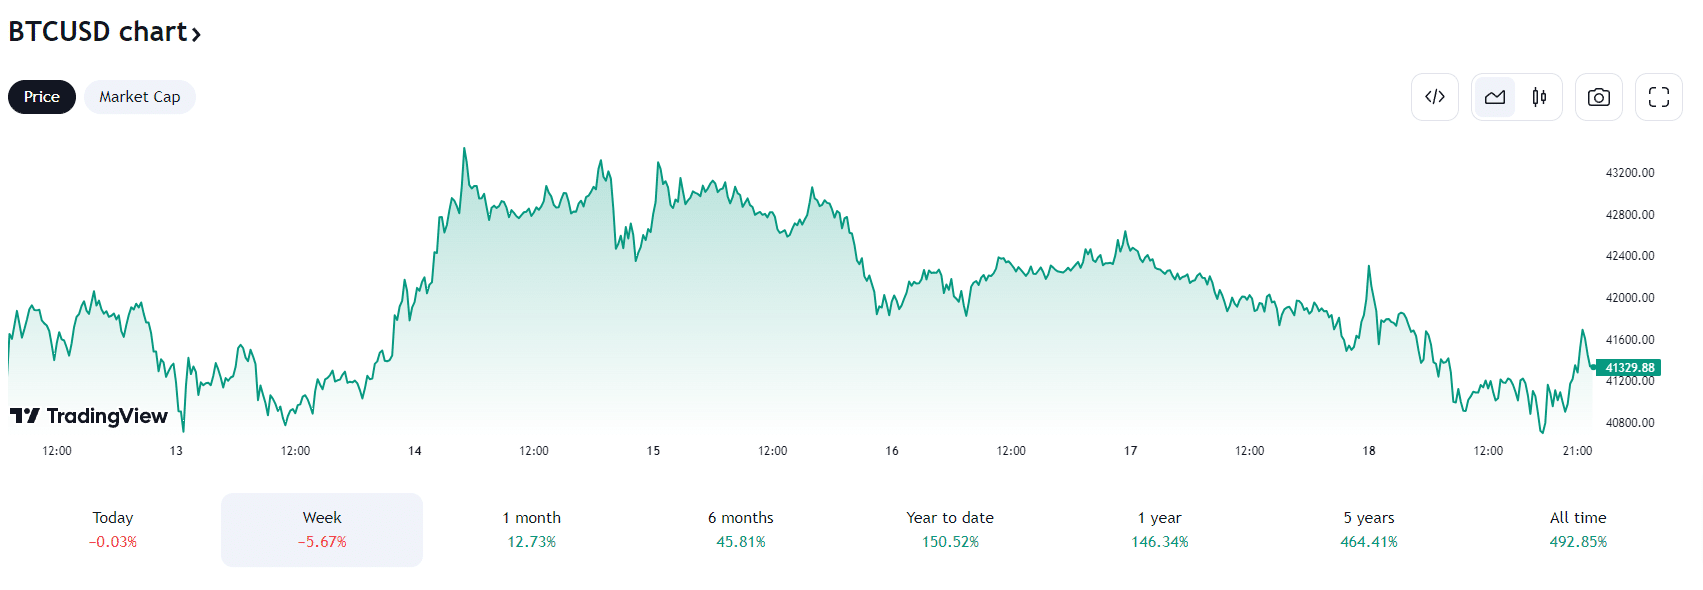
- Recent Performance: Over the past week, Bitcoin has seen a decline of approximately 5%, fluctuating between prices of $43,400 and $41,300, reflecting the current market volatility.
Technical analysis in daily BTC/USD
After an impressive nine-week bull run, where Bitcoin experienced an increase of 57%, BTC/USD is currently trading around $41,446. The 9-day exponential moving average (EMA) indicator is at $42,007, suggesting a medium-term uptrend.
The 9 EMA, by closely following price movements, indicates the direction of the current trend and can be interpreted as a signal of support or resistance in the current market cycle. The fact that the 9 EMA is above the current price may indicate possible upward resistance in Bitcoin price.
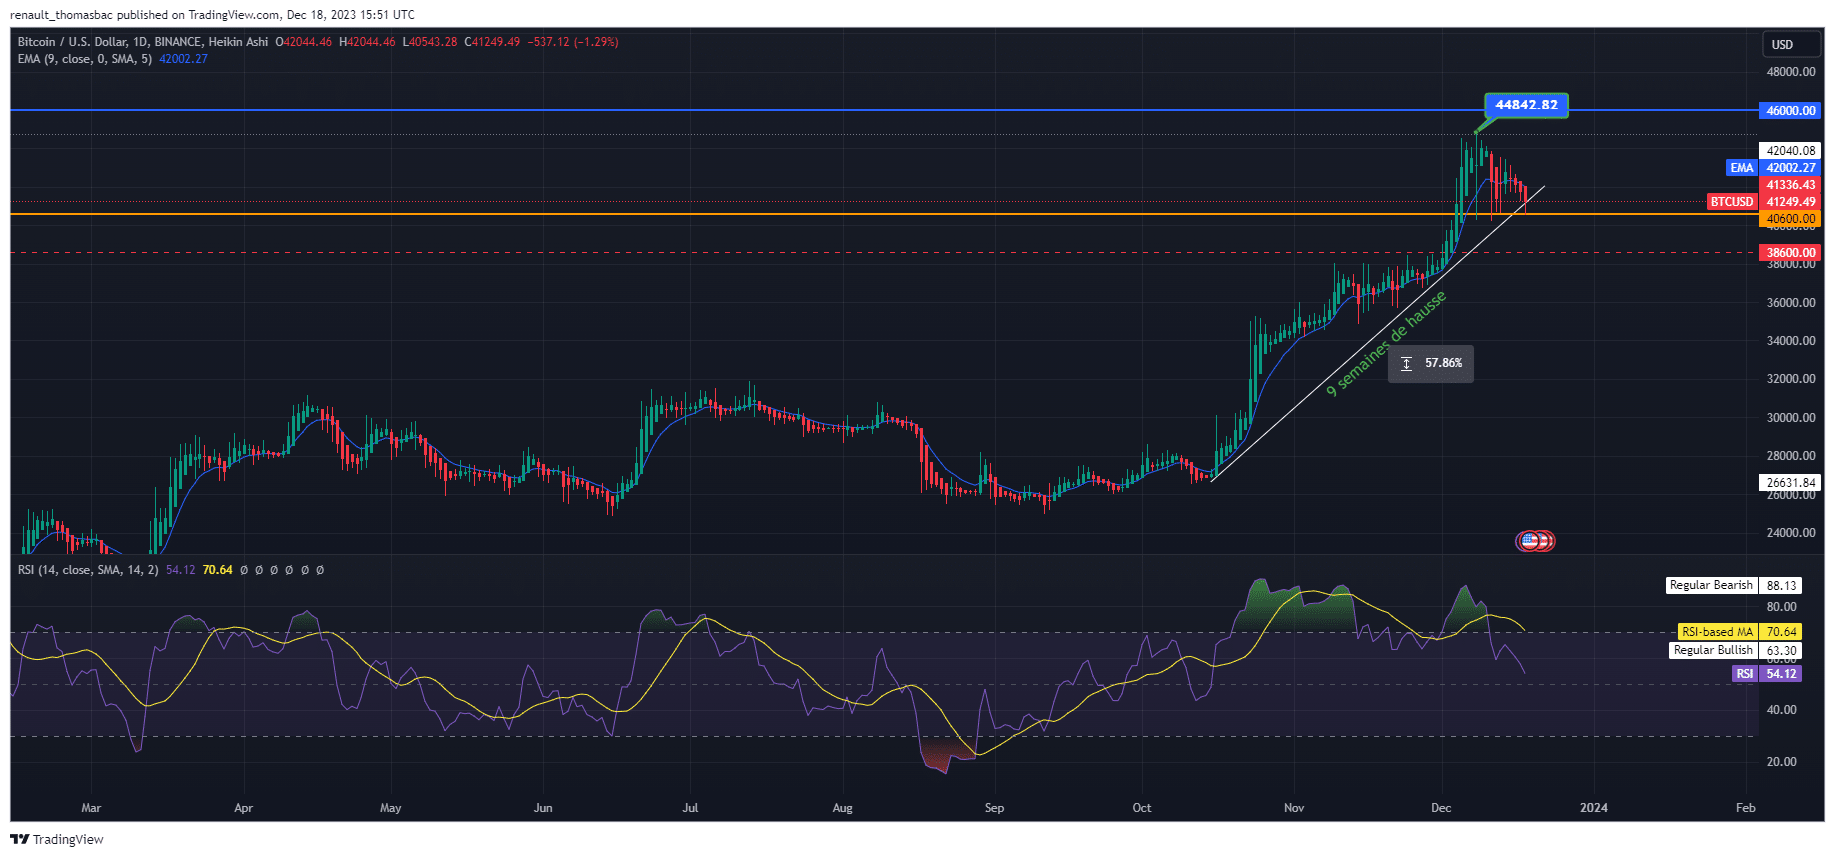
Bitcoin has decreased by 1% over the last day, approaching the critical zone of $41,000. This level is crucial, because it represents important support; Bitcoin must maintain this level to hope for a rebound. Concerning the relative strength index (RSI), it shows a score of 54 on the daily chart, signifying a position neither overbought nor oversold. This contrasts with recent RSI spikes to 87, indicating market overheating.
An RSI around 54 means the market is not in an extreme state, which could provide relative stability in the short termbut this requires continuous monitoring to detect any potential trend changes.
What to expect from the price of Bitcoin (BTC) for the end of the year?
If Bitcoin maintains its support around $41,000, this could signal a positive dynamic. A breach of the 9 EMA at $42,007 would reinforce this trend, paving the way for new highs like $46,000 and above. Indicators like a stable RSI would support this rise.
![]()
In the event of a break below $41,000, Bitcoin could head lower, testing lower supports around $40,000 or $38,000. An RSI falling below 50 would confirm this downtrend, requiring careful monitoring of key support levels.
Imminent end of Bitcoin ETF Token presale
The Bitcoin ETF Token ($BTCETC) pre-sale is coming to an end, with an amount already raised more than $4.7 million. There is only $500,000 left to raise to reach the goal. This final step provides investors with the final opportunity to purchase $BTCETC tokens before the presale closes.
The much-anticipated beginning of a #Bitcoin #AND F by @BlackRock might reshape the #Crypto landscape, drawing in institutional interest and sparking a fresh chapter in the market. 🌟📊
The last phase of #BitcoinETF is currently in full swing!
Keep an eye out for further news! 📰 pic.twitter.com/trfcw39aoU
— BTCETF_Token (@BTCETF_Token) December 18, 2023
The Bitcoin ETF Token ($BTCETC) is benefiting from the growing interest in Bitcoin ETFs, increasing its potential. This project has been audited to ensure investor safety. To purchase $BTCETC tokens, investors can use ETH, USDT or BNB and even a credit card. Currently, the price of the token is set at an attractive rate of $0.0068providing a unique opportunity for investors to participate before the pre-sale closes.
On the same subject :
This article does not constitute investment advice in any way. The information provided here should not be used as a basis for making financial decisions. Cryptocurrency investments involve risks and may result in significant losses. You should only invest what you can afford to lose and carry out your own research before making any investment decisions.