The battle for $ 30,000 continues to intensify. So far the cops have been able to parry any attempt to sell off. The dominance of the reserve currency could increase further in the coming trading days.
Bitcoin (BTC): Another false outbreak on the bottom
BTC course: 31,517 USD (previous week: 32,595 USD)
Resistance / goals: $ 31,603, $ 32,718, $ 33,335 $ 34,899, $ 36,643, $ 38,108, $ 39,240, $ 40,585, $ 41,321, $ 43,030, $ 44,147, $ 44,878, $ 47,070, $ 48,222, $ 51,307 / 50,305, $ 53,005, 54,077 USD, USD 55,817, USD 57,998, USD 59,470, USD 61,771, USD 64,896
Supports: $ 31,010, $ 30,000, $ 29,300, $ 28,716, $ 27,563, $ 26,404, $ 23,887, $ 22,222, $ 21,892, $ 19,884,
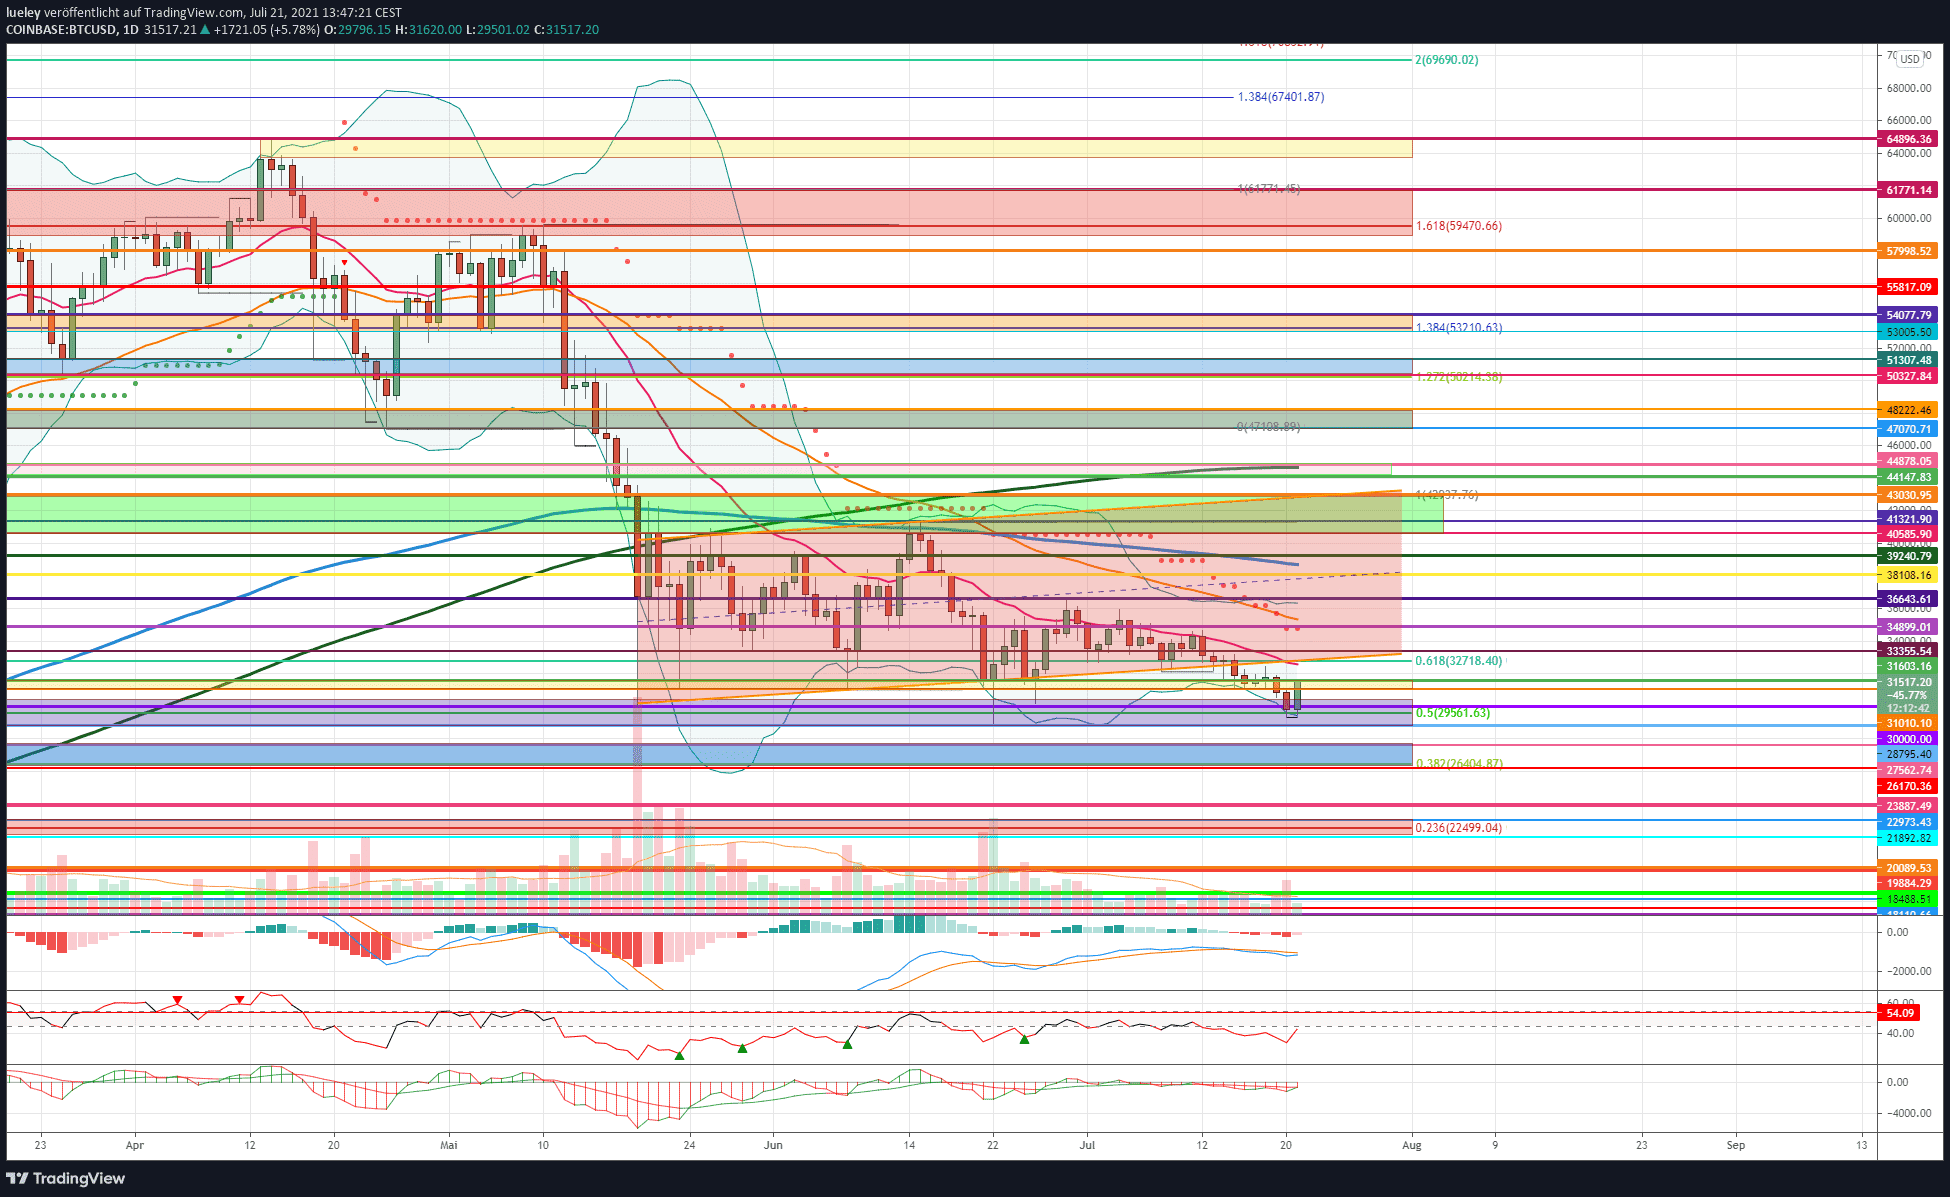
Bitcoin can noticeably recover from yesterday’s price weakness on Wednesday morning and rise back to currently USD 31,412. The bulls were able to avert a sustained breach of the psychological USD 30,000 mark again for the time being. Although the crypto reserve currency is trading around 3 percentage points lower than a week, today’s symposium with Elon Musk, Jack Dorsey and Cathie Woods could give the BTC rate a further boost. If it is also possible to win back the 31,603 USD, a preliminary decision can be expected in the area of the 32,718 USD.
Bullish scenario (Bitcoin price)
Bitcoin’s price action could take a decisive turn in favor of buyers as of today, Wednesday, July 21st. If the bulls manage to lift the BTC price back above USD 31,603 in a timely manner, the cross resistance consisting of EMA20 (red), 61 Fibonacci retracement and the lower edge of the trend channel at USD 32,716 will come into focus again. A dynamic recapture of this strong resistance zone should quickly lead the BTC price towards USD 33,355. If the jump above this price level succeeds, a march through to the 34,899 USD is likely. In addition to the supertrend and horizontal resistance level, the EMA50 (orange) is also just above it. If this resistance area is also overcome by the daily closing price, the area around USD 36,643 moves into focus as a price target.
In addition to the course high of June 29, the upper Bollinger Band can also be found here. This strong resist is not expected to be overcome at the first attempt. Only when the BTC price breaks dynamically above this resistance level at the daily closing price, the next relevant price target is activated at USD 38,108. The EMA200 (blue) runs in the zone between USD 38,108 and USD 39,240. Accordingly, the buyer’s warehouse must generate enough buying momentum to initiate a walk-through to USD 40,585. If this price level is also broken through permanently and the high of June 15 at USD 41,321 is pulverized as a result, a subsequent rise towards USD 43,030 is conceivable. Here is the upper edge of the bearish flag formation. Some investors will realize profits at this price mark.
Flag burst as a buy signal
An upward break out of the flag would be a strong bullish signal and make a move into the range between $ 44,147 and $ 44,878 likely. In addition to several lows from the first quarter of this year, the MA200 (green) also runs here. Once again, the bull camp has to exert itself in order to break through this area of resistance. A dynamic breakout above USD 44,878 would open up further price potential up to USD 47,070. The trailing edge of the current correction movement runs here. The recapture of USD 47,070 activates the next price target at USD 48,222. If this resistance level is also broken, a march back above the psychological USD 50,000 mark to USD 50,327 is conceivable.
The chart image would brighten up significantly. If Bitcoin marches further north in the direction of the strong resistance level at USD 51,307, further profit-taking is to be planned here. If the Bitcoin price subsequently stabilizes above USD 50,000, a price increase of up to USD 53,005 and USD 53,210 can be expected in the medium term. A walk-through to USD 54,077 or even USD 55,817 would then be conceivable. The current attempt by the bulls to stabilize the BTC price above USD 30,000 does not change the maximum price target for the coming period. Furthermore, USD 57,998 should be mentioned as the maximum increase target. Profit-taking across the board would not be surprising. Only when the BTC price can break out dynamically above this resistance level will the next higher-level price target be activated at USD 61,771. Reaching this price level increases the chances of a subsequent increase up to the all-time high of 64,896 USD noticeably.
Bearish scenario (Bitcoin price)
The last 24 hours have impressively shown how close the battle between buyers and sellers is at present. Once again, the bears failed to generate what is known as a “follow-through”. Once again, the BTC rate dynamically reversed north in the purple support area. However, as long as the bears can keep the BTC rate below USD 32,718, a new wave of sell-offs must be expected at any time. If Bitcoin falls back below the support level at USD 31,010, a further drop in the price of up to USD 30,000 must be expected. The lower Bollinger Band was used yesterday Tuesday by brave buyers for long entries, but it bends further south. On the one hand, an increasing volatility can be derived from this. On the other hand, this development offers further opportunities for the bear camp to sell off the BTC price again towards the low at USD 28,716.
If Bitcoin again falls below USD 30,000 in the coming trading days, the probability of a relapse increases to at least USD 28,716. If there is a sustained break in this support level, the next price target is activated at USD 27,563. If this price mark is also dynamically undershot, an expansion of the correction up to the 38 Fibonacci retracement at USD 26,404 should be planned. A countermovement back towards USD 30,000 should not come as a surprise based on this support. However, if this support is broken significantly on the first try, the correction extends to around USD 23,887. If the bulls do not come back on the floor here either, the likelihood of an extension of the downward movement into the support area between USD 22,222 and USD 21,892 increases. A consistency test of the old all-time high of $ 19,884 would be within reach.
Bitcoin Dominance: Back on the downtrend channel
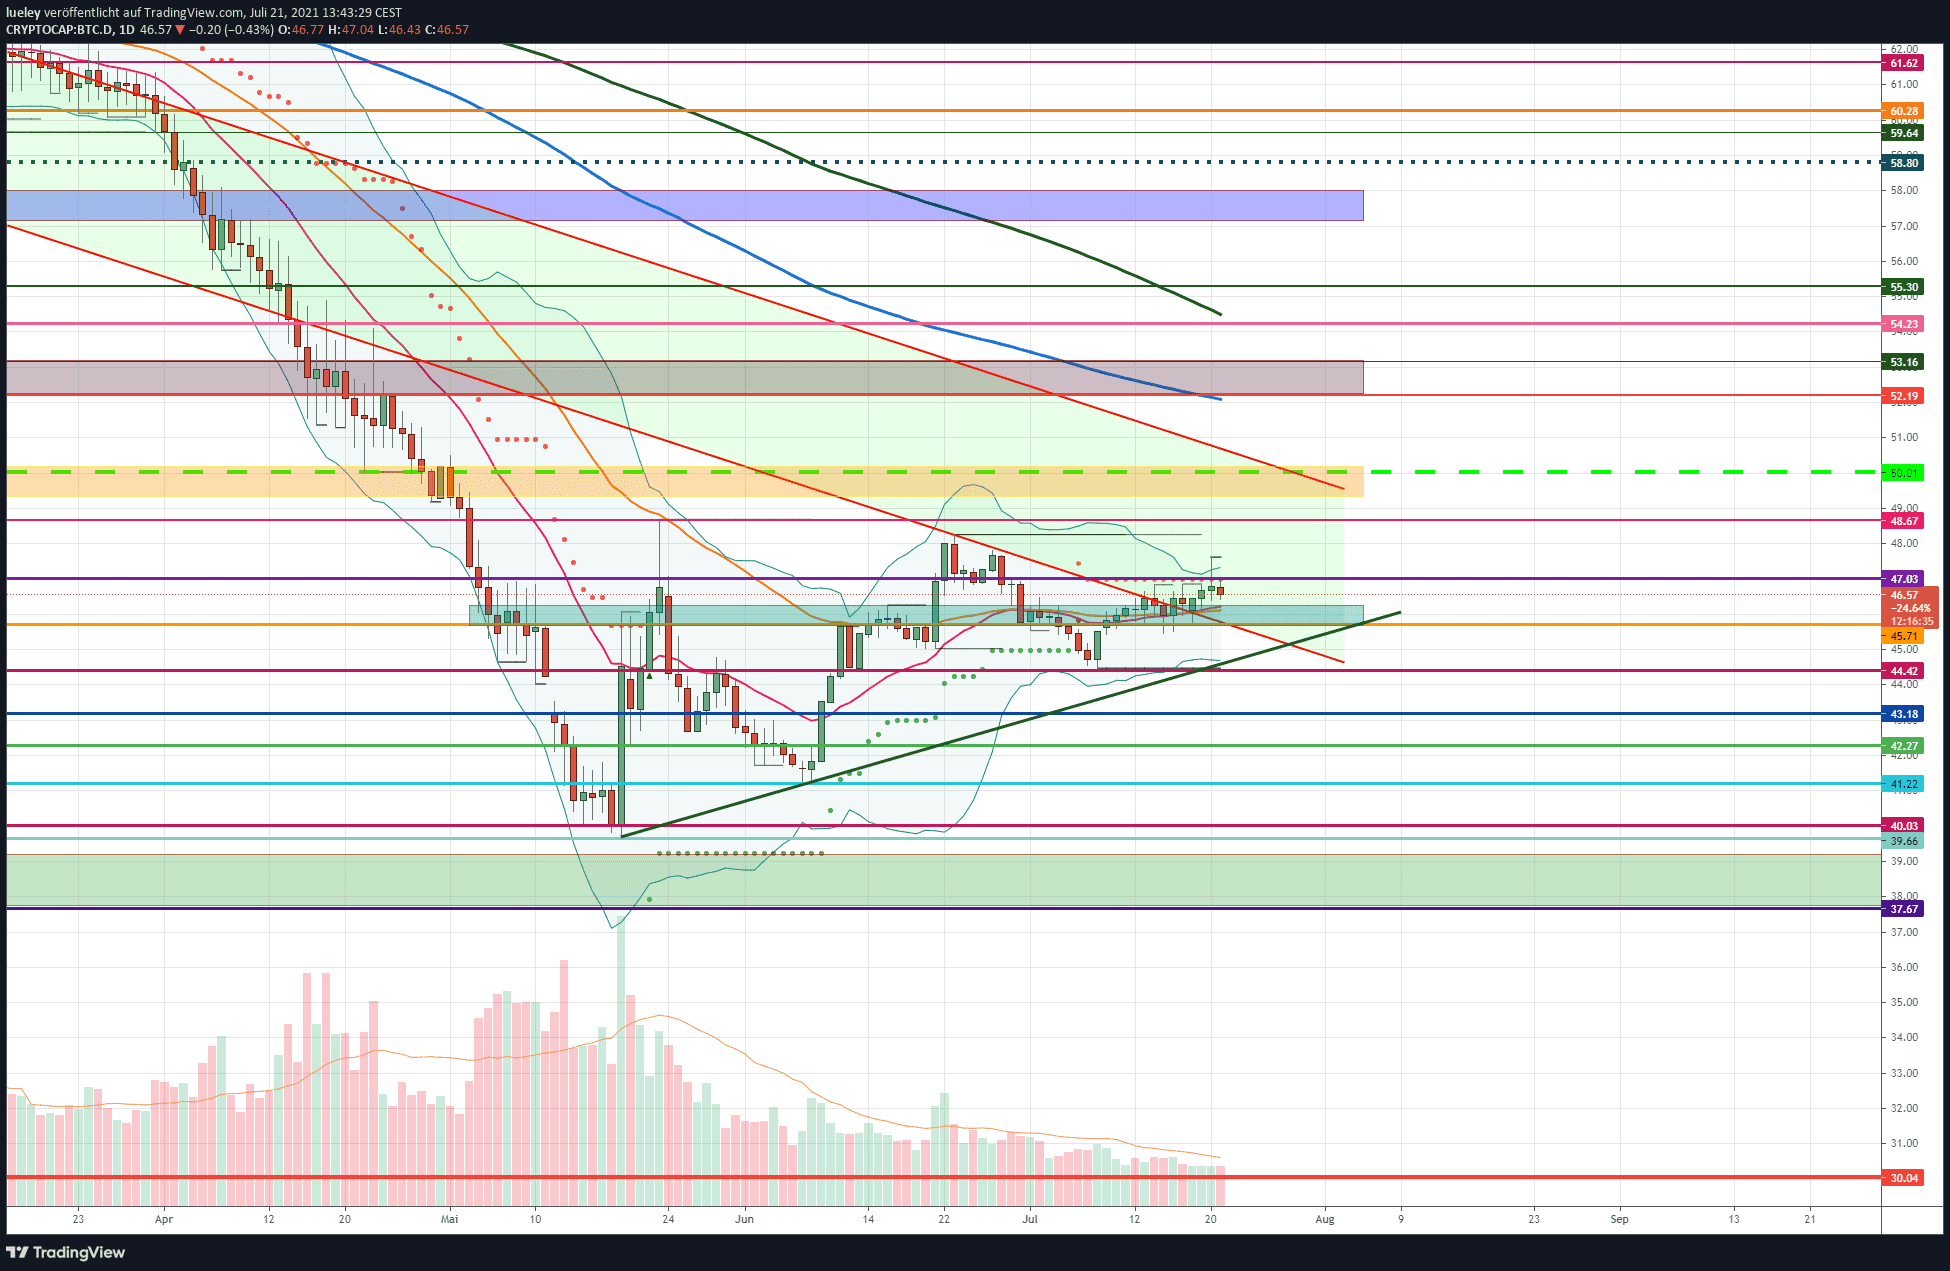
Since the last analysis on July 14th, BTC dominance has remained in a narrow trading range. Yesterday, Tuesday, July 20, the dominance of the reserve currency failed to overcome the strong resistance at 47.03 percent per day’s closing price. The temporary increase to a weekly high of 47.62 percent could not be confirmed for the time being. As long as the cross support from the lower edge of the trend channel and the horizontal support line is not sustainably undercut at 45.71 percent, the chance for a further price increase in the coming trading days will prevail.
BTC Dominance: Bullish Scenario
If the BTC dominance succeeds in breaking through the area of 47.03 percent at the daily closing price and thus overcoming the supertrend, a subsequent increase of up to 48.25 percent or even 48.67 percent is likely. If the dominance of the crypto reserve currency continues to stabilize and the resistance at 48.67 percent is broken at the daily closing price, the orange resistance area at 50.01 percent comes into focus as the price target. This is where the next relevant resistance cluster runs from the upper edge of the trend channel and the horizontal resistance line. If this area is also recaptured, the next important price target will be activated at 52.19 percent.
In addition to the horizontal resistance, the EMA200 (blue) runs just below the gray resistance area. A downward ricochet is therefore very likely on the first attempt. If it is possible to break through this sliding resistance sustainably and also to overcome the 53.16 percent, the chances of a further increase in BTC dominance increase. A rise to the horizontal pink resistance line at 54.23 percent should be planned for as a result. The MA200 (green) is currently just above it at 54.50 percent. Only when this resist level is overcome by the daily closing price, the maximum price target of 55.30 percentage points moves into the focus of investors.
BTC Dominance: Bearish Scenario
However, if the BTC dominance again does not manage to leave the 47.03 percent behind in the long term, a directional decision will be made at the 45.71 percent. If this price mark does not hold, the Bitcoin dominance should immediately give way back to 44.42 percentage points. If this key level is broken through dynamically, further significant levies are likely. The first price target would be the blue horizontal support line at 43.18 percent. If the BTC dominance subsequently falls back below this support, the correction expands to at least 42.27 percent. A decline to the monthly low of 41.22 percent cannot be ruled out either. In order to avert another setback to the annual low, a clear countermovement to the north is required.
On the other hand, if Bitcoin dominance continues to lose momentum, it is likely that the 40 percent mark will be approached again. If there is a retest of the annual low at 39.66 percent, the price development for the coming weeks will be decided here. A dynamic fall below the annual low should result in a correction widening in the direction of the green support zone. A price slide to the maximum bearish price target of 37.67 percent must be planned at all times. If there is no clear reversal at this central support, a reduction in Bitcoin dominance towards the psychological 30 percent mark is even conceivable by the end of the year.
Disclaimer: The price estimates presented on this page do not constitute buy or sell recommendations. They are only an assessment of the analyst.
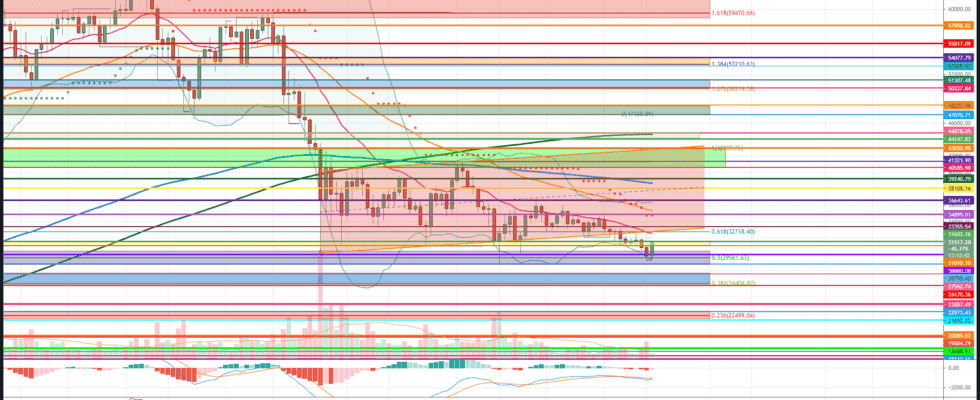
The chart images were created using TradingView created.
USD / EUR exchange rate at the time of going to press: 0.84 euros.