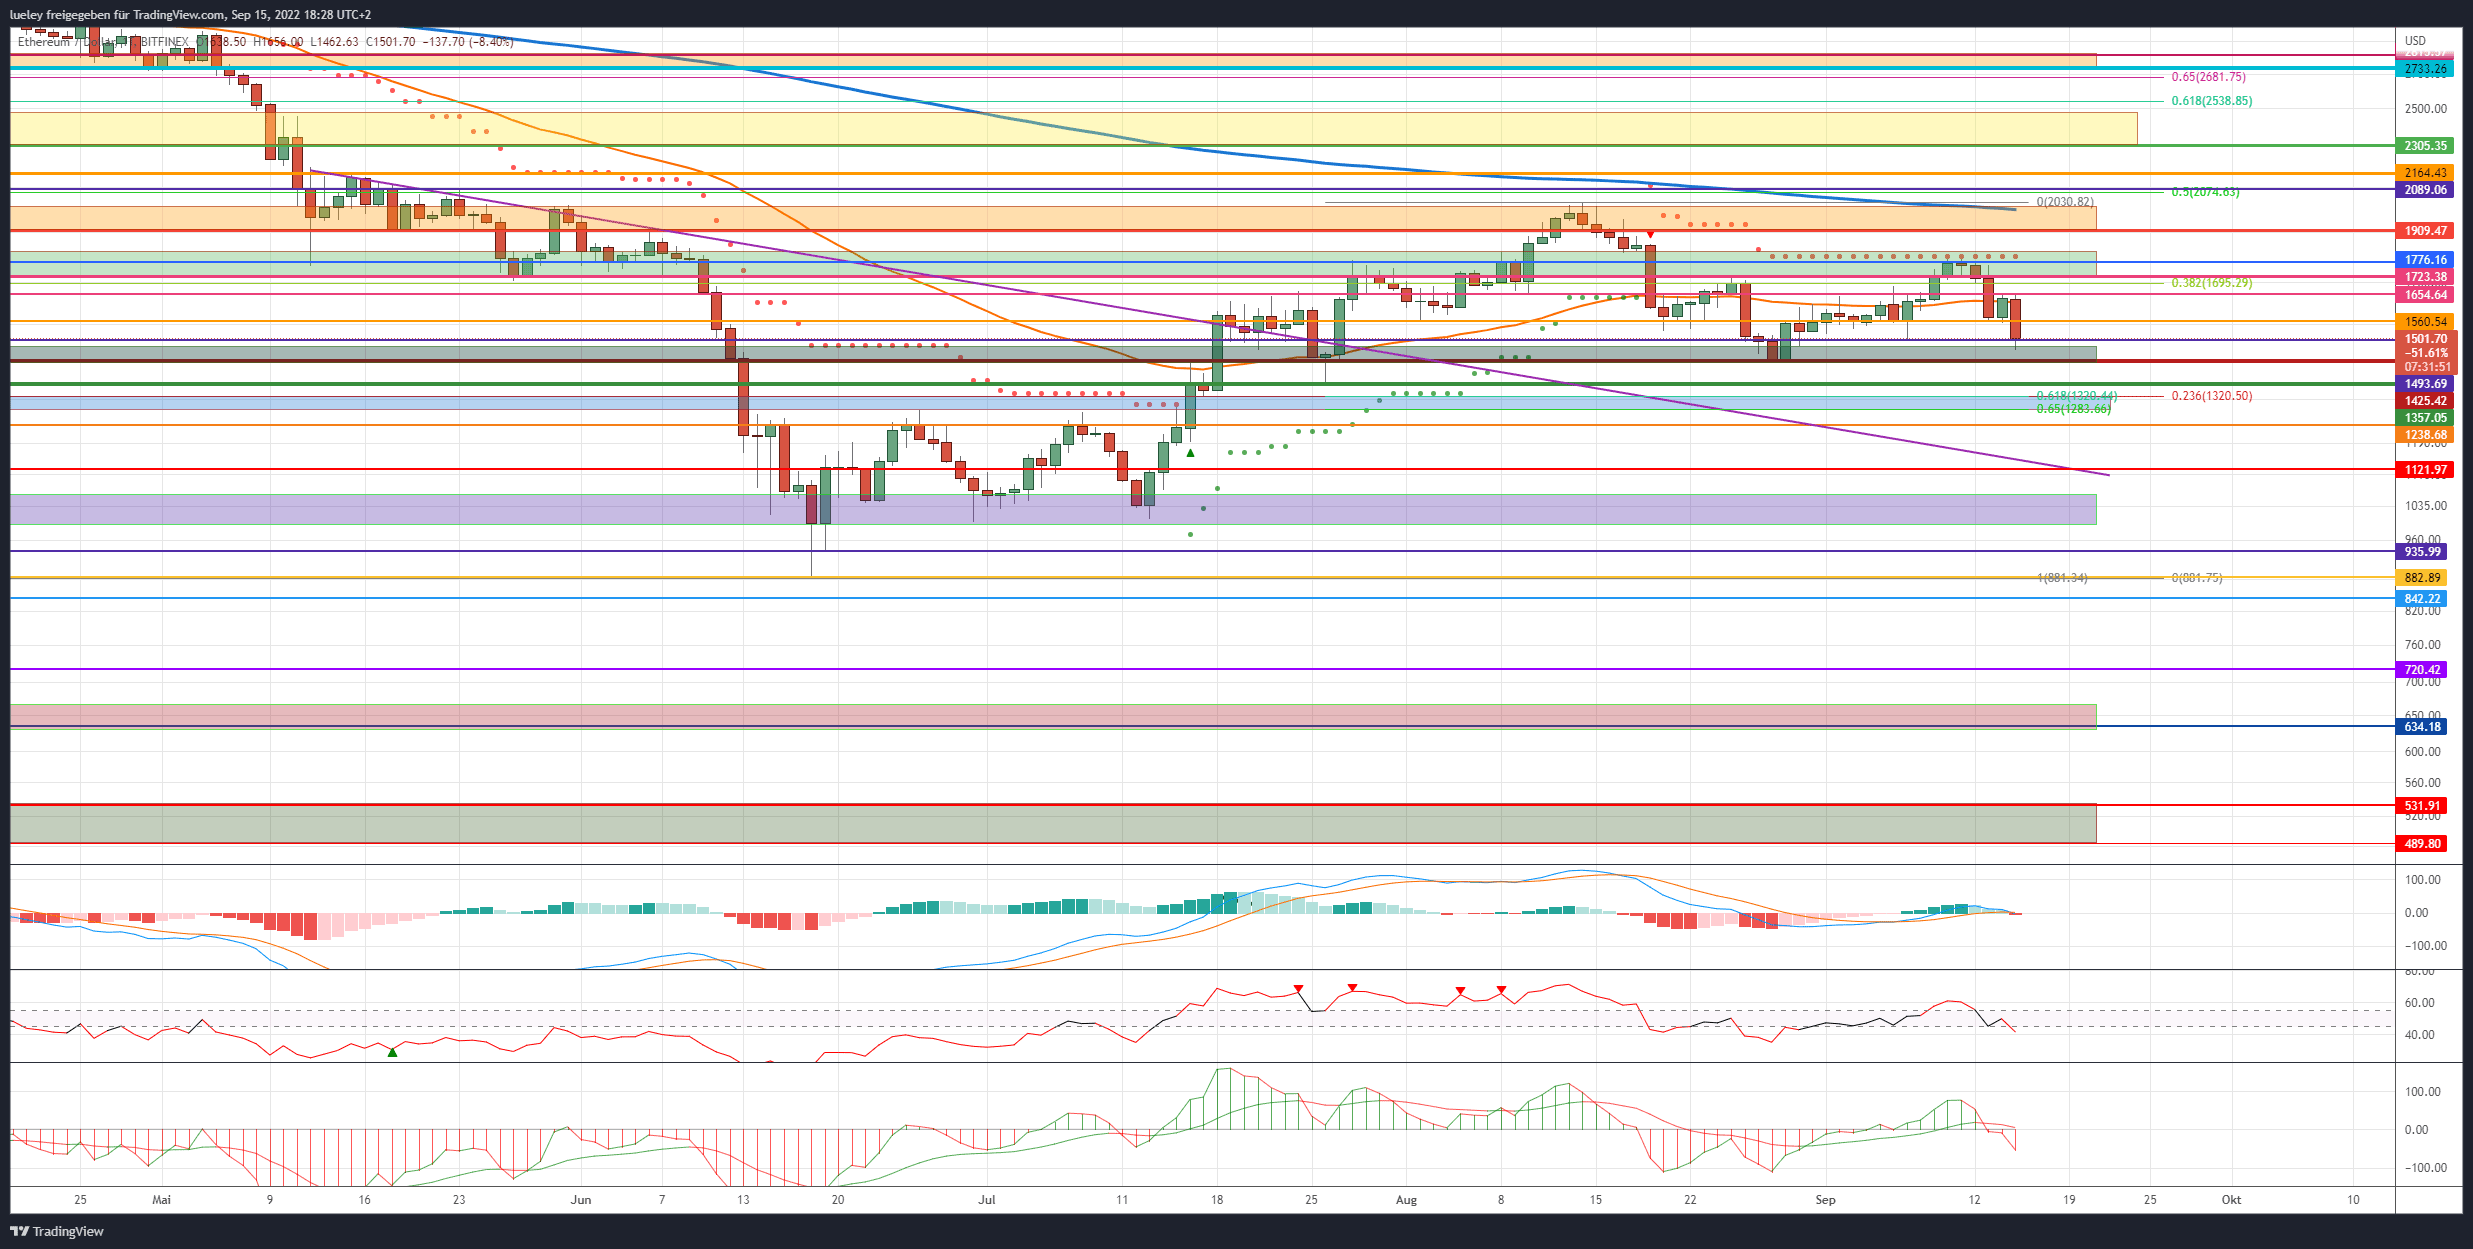
- Course (ETH): $1,492 (previous week: $1,716)
- Short-term resistances/goals: $1,560, $1,655, $1,723, $1,776, $1,825, $1,909, $2,013, $2,089, $2,164, $2,305, $2,448/$2,485, $2,733
- Short-term supports: $1,493, $1,477/1,425, $1,357, $1,320/1,238, $1,121, $1,063, $992, $935, $882, $720, $663/634, $531/489
Ethereum Recap
- The wait is finally over! In the early morning hours of this Thursday, September 15th, the conversion of the Ethereum blockchain from Proof-of-Work (POW) to Proof-of-Stake (POS) as “The Merge” entering the cryptocurrency was successfully implemented.
- In the run-up, there had been plenty of speculation and theories on the part of investors as to whether and how much this historic event could affect the price development of the second largest cryptocurrency.
- Around eight hours after the update to the now POS-based Ethereum blockchain, it can be seen that the bears are relying on an impulse from the classic US stock markets to initiate a “sell the fact” movement.
- The bear camp waited with its sell-off until the historically negative “funding rates” of leveraged bets on the ether course turned back into positive territory. This is based on the funding rates of the highest-volume crypto exchange Binance.com.
read too

Ethereum: Today’s course of the day
- Immediately after the end of the merge, the ether price rose to the previous day’s high of USD 1,655 in a first bullish reaction and attempted to break out of the horizontal resistance.
- Starting from this price level, the ether price slipped in the last few minutes of trading to the previous week’s low of USD 1,493 and threatens to break through this support.
- At the time of writing this article, the ether price is around 10 percentage points lower than the day before.
The weakness on the stock markets is a burden
- The renewed price weakness of the Nasdaq technology index in the late afternoon hours again caused a significant price correction for the second largest cryptocurrency.
- Although the US Dollar Index (DXY) has also shown a slight price consolidation in the last few trading days, which has actually had a positive effect on the crypto market, the prices of Bitcoin (BTC), Ethereum and Co. continue to appear primarily in the direction of the US – To orient stock indices.
- In the short term, Ethereum seems to be out of breath after the strong performance in the last few months of trading.
- Although Ethereum is well supported on the underside in the area of USD 1,425, a fall below the previous month’s low would increasingly cloud the chart picture again.
Looking at the indicators
- The sell-off in the last few hours caused the 4-hour chart’s RSI to correct back to oversold status. On the other hand, the MACD has now generated a fresh sell signal in this time unit.
- However, since both indicators RSI and MACD in the daily chart have now also formed new short signals, it should become increasingly difficult for the buyer side to climb back towards the last high at USD 1,776.
- Should the ether price sell below USD 1,425 at the daily closing price, a continuation of the trend up to the support at USD 1,357 should be planned immediately.
Bullish Scenario (Ethereum)
- The Ethereum bulls seem to have run out of steam for now. The buyer side failed several times over the weekend and at the start of the week to overcome the resistance at USD 1,776 at the end of the day.
- Then, the massive sell-off on Tuesday, September 13th caused a pullback to the $1,560 support. The fact that this support level was dynamically broken down on the day of the merge is also to be rated bearish in the short term.
- However, as long as the ether price can form a higher low on a daily basis, the chances of a fresh attempt to increase in the coming days are still there.
- If the buyer camp manages to send Ethereum back north in a timely manner above the cross resistance of EMA50 (orange) and horizontal resist at USD 1,654, there are still chances of an attack in the direction of the important resistance level at USD 1,723.
- If this mark is overcome without another price setback, and ideally the weekly high in the area of USD 1,776 is reached and broken upwards, a preliminary decision can be expected at USD 1,825.
The chart image brightens
- Only when this resistance level has also been overcome will the chart image continue to brighten for a short time and Ethereum should take off directly in the direction of the orange resistance zone.
- If there is no dynamic price reversal to the south at USD 1,909 either, the bulls will do everything possible to start the high of August 14 at USD 2,031. In this area there is another strong resistance line with the EMA200 (blue) in the daily chart.
- Once again, the bears will be there to avert another breakout.
- However, if the bulls win the fight, the recovery move will immediately extend to $2,089.
- This would also put the medium-term target price of USD 2,164 within reach. This is where the striking price low of January 24, 2022 runs.
- If Ethereum also overcomes this resist without significant setbacks, the next targets for increases will be activated at USD 2,305 and USD 2,485.
- If the crypto market continues to be bullish as a result, a direct increase up to the 61 Fibonacci retracement of the overriding downward movement at USD 2,538 is also conceivable.
- Ethereum could then even target the old tear-off edge at USD 2,733 as a result.
Bearish Scenario (Ethereum)
- The bears appear to be executing their plan to send Ether price south again after the merge.
- If the seller succeeds in selling Ethereum below the strong support at USD 1,425 in the coming trading days, a downward movement to USD 1,357 can be expected as a result.
- A daily close below USD 1,493 would be a first indication of an attack on USD 1,425.
- If the ether price slips below this important support at the end of the day, and the USD 1,357 is also sustainably undercut, the next relevant target zone between USD 1,320 and USD 1,283 moves into the focus of investors.
- This is where the golden pocket of current price action runs. In particular, the bulls must defend the price mark of USD 1,283 in order to avert a crash towards USD 1,121.
- If this mark is also subsequently undercut, a fall back to the old support zone between USD 1,062 and USD 999 should be planned for.
A directional decision is approaching
- As mentioned several times in the last Ethereum price analysis, this support area represents the make-or-break level on the underside.
- If the bears succeed in selling below the purple support zone, the correction will initially extend to USD 935.
- However, a direct retest of the annual low at USD 881 is also conceivable. If USD 881 is broken through without any real resistance from the buyer side, the corrective movement can be expected to extend into the range between USD 842 and USD 720.
- Persistent price weakness on the classic financial market in the coming months increases the likelihood of a sell-off to the breakout level from December 2020 between USD 663 and USD 634.
- The bears are likely to use the strong selling momentum to target the maximum price target on the downside between USD 531 and USD 489.
Disclaimer: The price estimates presented on this page do not represent buy or sell recommendations. They are merely an assessment by the analyst.
The chart images were created using TradingView created.
USD/EUR exchange rate at the time of going to press: EUR 1.00.
Do you want to buy cryptocurrencies?
Trade the most popular cryptocurrencies like Bitcoin and Ethereum with leverage on Plus500, the leading CFD trading platform (77 percent of retail accounts lose money with the provider).