
Altcoins are lagging – The price of Bitcoin has been stagnating for a few weeks, and altcoins are struggling to express themselves. Indeed, operators are looking towards the PEPE Coin, but other altcoins are struggling to express themselves. Ethereum is also stagnating, and is trying to hold the level at $1,900. Can altcoins rebound and benefit from capital turnover? Let’s look at the clues left by the charts.
This market analysis is brought to you in collaboration with CryptoTrader and its algorithmic trading solution finally accessible to individuals.
Can altcoins resume bullish momentum?
As explained in the introduction, altcoins remain shy Currently. The capitalization of altcoins has stalled at the level of the weekly resistance at $670 billion :
The capitalization of altcoins has been on the rise since the beginning of 2023. However, since the rejection at the resistance level, altcoins are struggling to recover. The institutional bias (EMA 9/EMA 18) is pointing upwards, it could act as a dynamic support. A close beyond the last high at $661 billion could allow the capitalization of altcoins to join the next resistance located at 950 billion dollars. As long as the price is moving below the resistance at $670 billion, altcoins will struggle to express themselves.
The RSI retains the bullish trendline for the moment, a rebound could occur at the level of the trendline. If the trendline were to give way, the momentum would send a signal that it was running out of steam.
Could altcoins continue to suffer?
The year 2023 is the year of Bitcoin at the moment. The graph of Bitcoin dominance has been on the rise since the start of the year, going from 40% to 49% dominance in the space of a few months. As dominance climbs, capital flows to the king of cryptocurrencies:
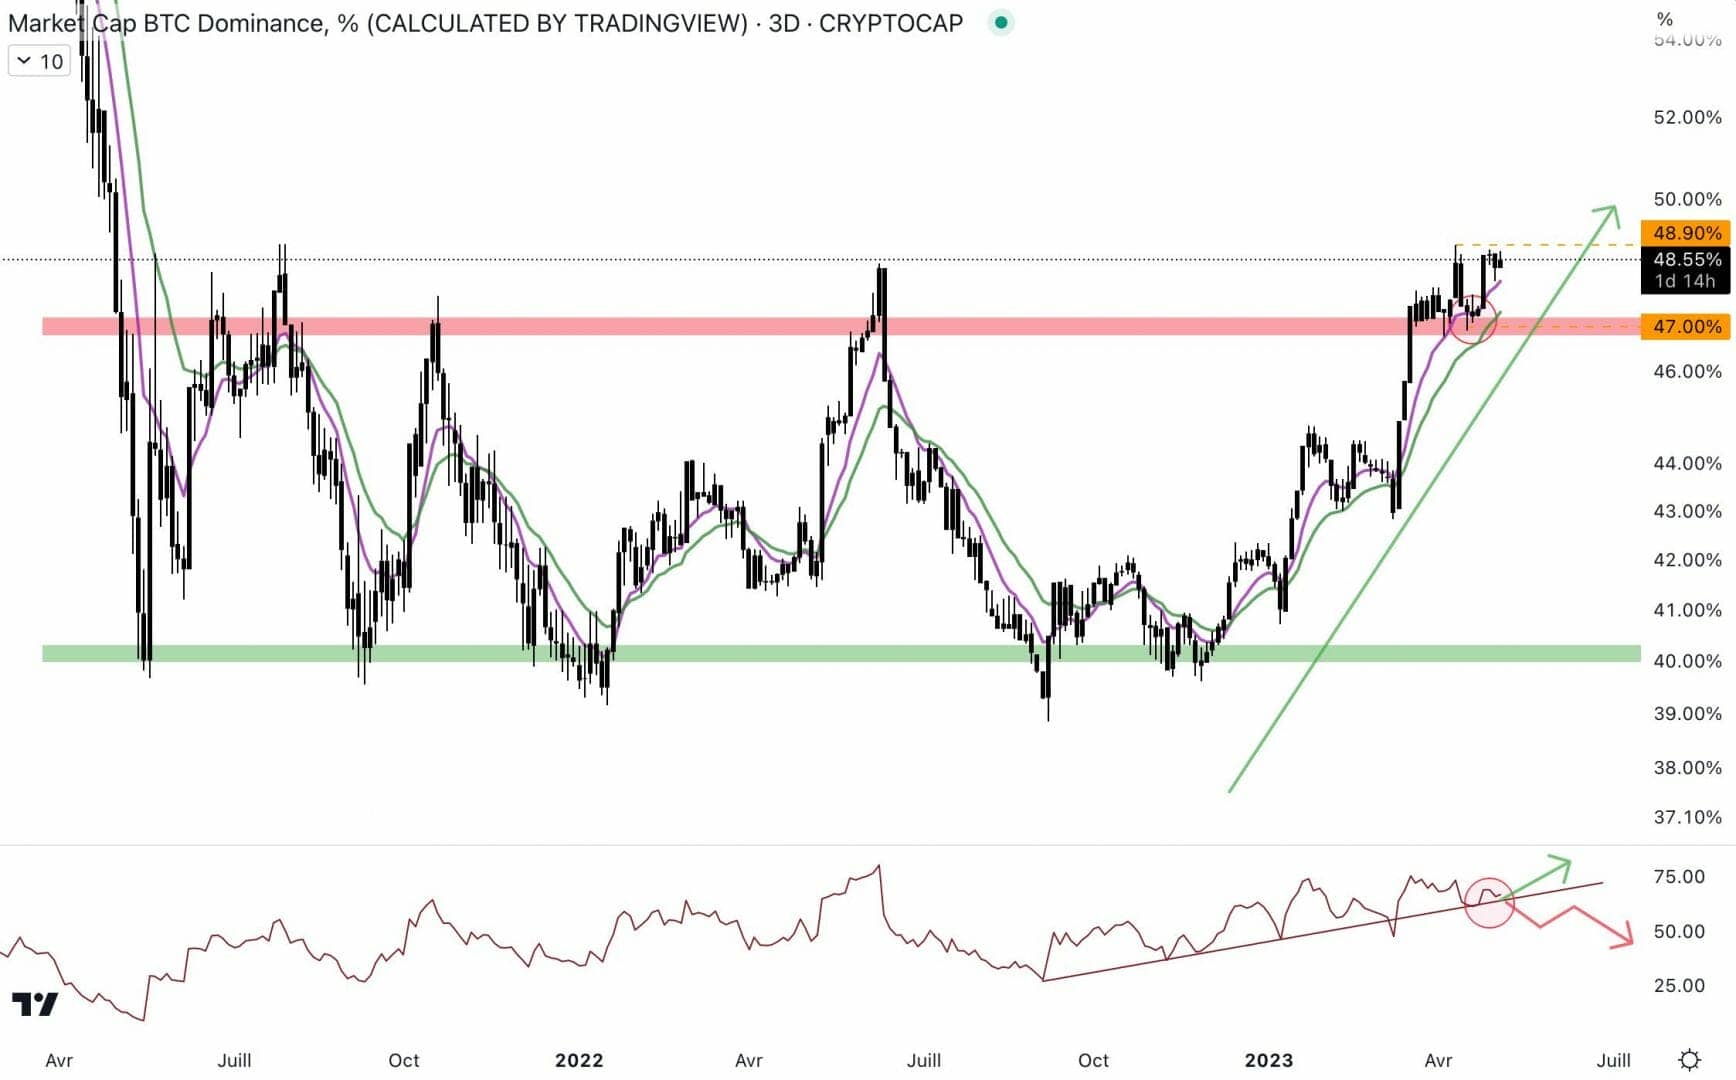
The institutional bias is still largely on the upside, it could act as a dynamic support. A fence beyond 49% could revive the bullish momentumand maybe, break the monthly resistance. If the breakout is confirmed, capital would continue to flow into Bitcoin, and altcoins would continue to be feverish.
The RSI is encouraging, it remains above the bullish trendline. As long as this is the case, the buyers have their hands on the momentum. A breakout of this trendline would be a first signal that the trend is running out of steam.
Ethereum needs to rekindle bullish momentum
Despite the recent drop, Ethereum’s price remains solid. Indeed, the price evolves at the level of the weekly support at $1,850 :
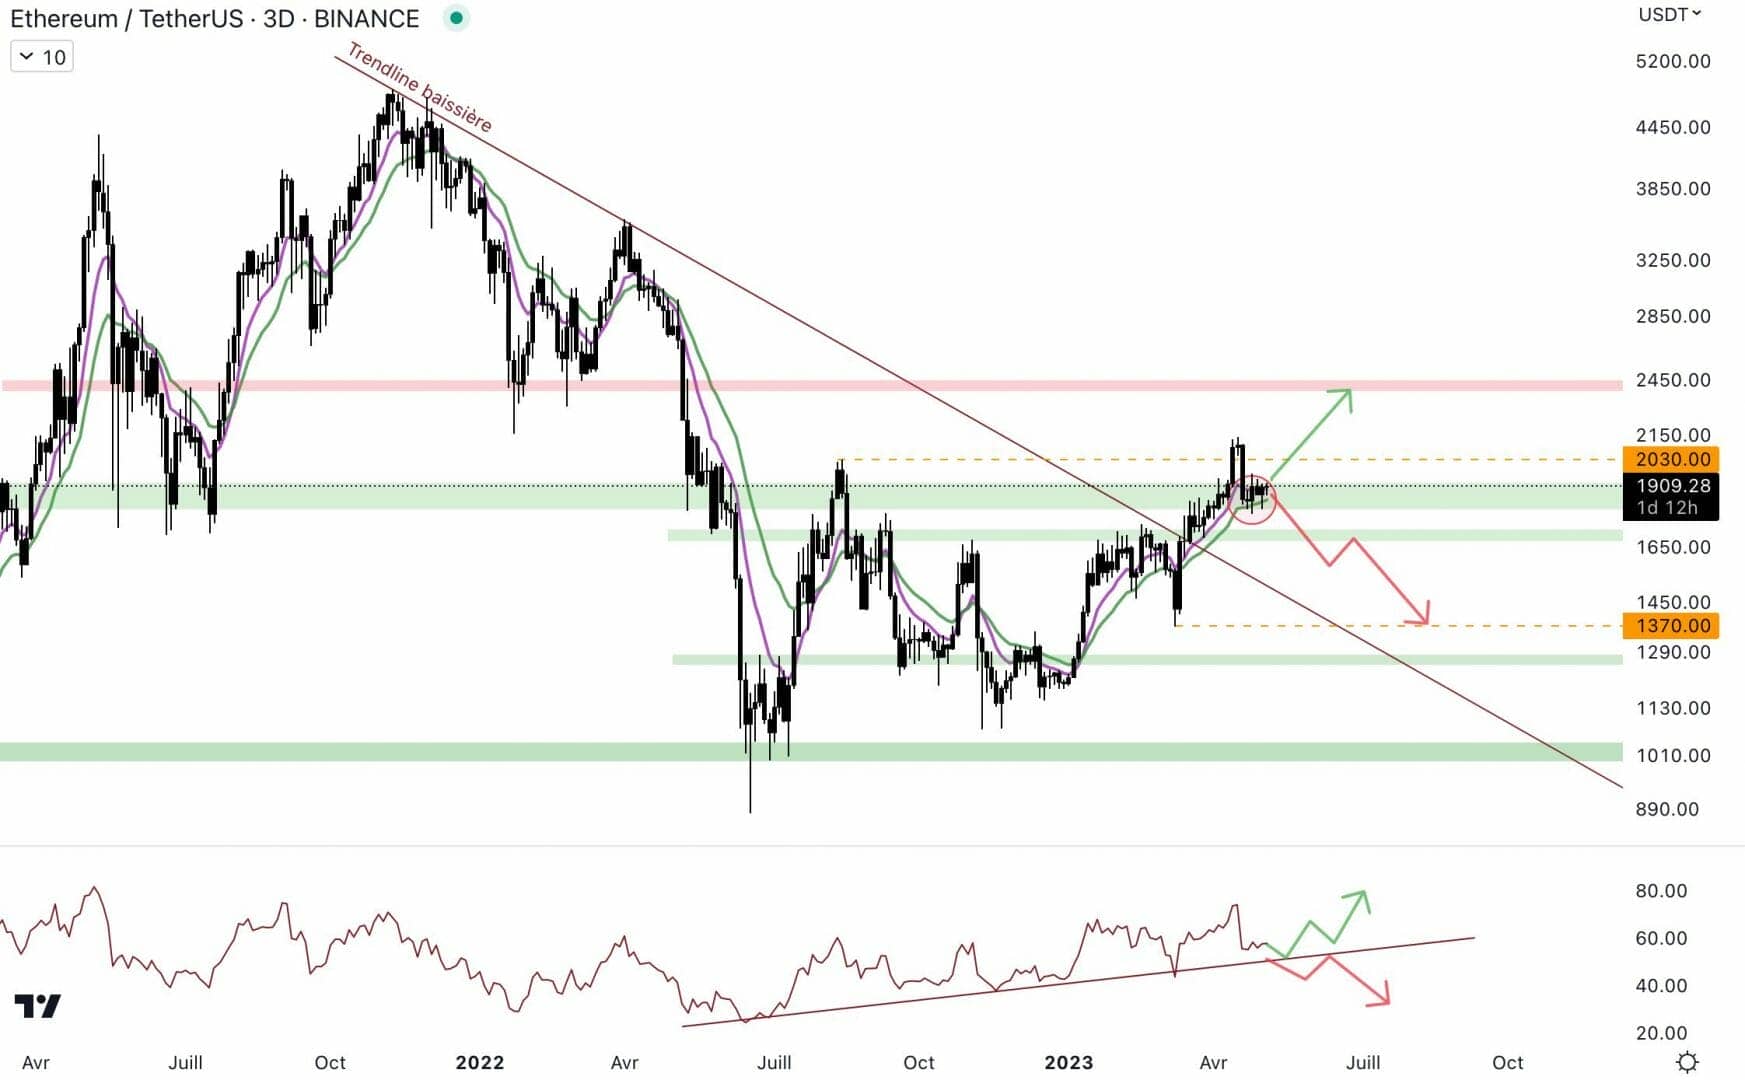
Ethereum is Weekly bullish since close above $2,030. To restart the momentum, the price must close above the last high at $2,140. A close like this would allow the price to reach the next resistance at $2,400. Could the price reach this level before the next Cancun update? Whatever happens, we should avoid losing supportas sellers might push to the next bracket at $1,270.
The RSI is moving above the bullish trendline, buyers still have their hands on the momentum. If the RSI bounces off the bullish trendline, the price could reach the level at $2,400. Attention, a break of this trendline would be a bad sign.
The ETH/BTC pair remains in indecision
The ETH/BTC pair allows you to compare the strength of Ethereum to the strength of Bitcoin. The course is in a tidy for nearly two years:
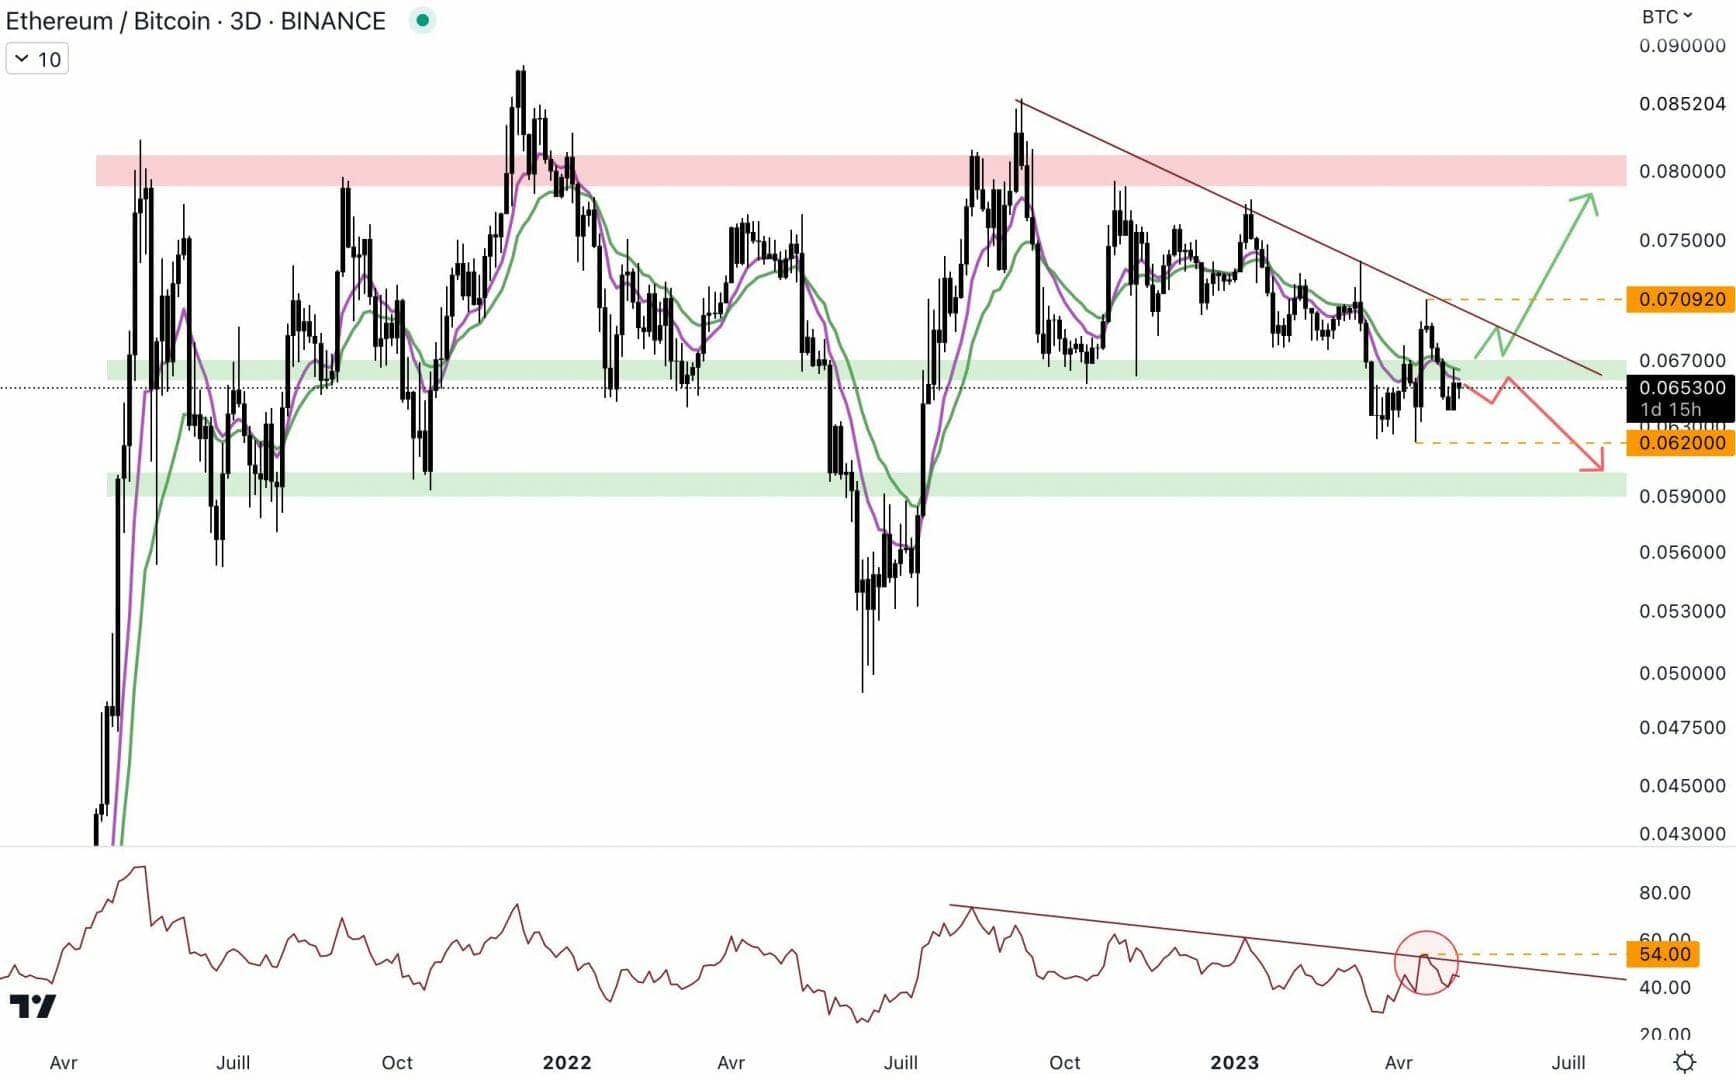
The price always evolves under the bearish trendline. As long as this is the case, the price will remain fragile. Currently, the ETH/BTC pair is moving between the last high at 0.0709 BTC and the last low at 0.062 BTC. If the price closes above the last peak, it could break the bearish trendline and join the resistance at 0.08 BTC. On the other hand, if the price closes below the last trough, the price could reach the bottom of the range. For altcoin enthusiasts, it would be positive to once again return to the level of monthly resistance.
The RSI is always fragile, it is moving below the bearish trendline. A fence above 54 could allow buyers to regain control of the momentum.
Technical analysis of the altcoin of the week: the Casper (CSPR)
THE CSPR is the altcoin of the week, as it is one of the assets that performed this week. Indeed, this week, Casper’s course is up more than 10%. After a decline of almost 98% since May 2021, can the price go up again? Let’s analyze the chart of this altcoin:
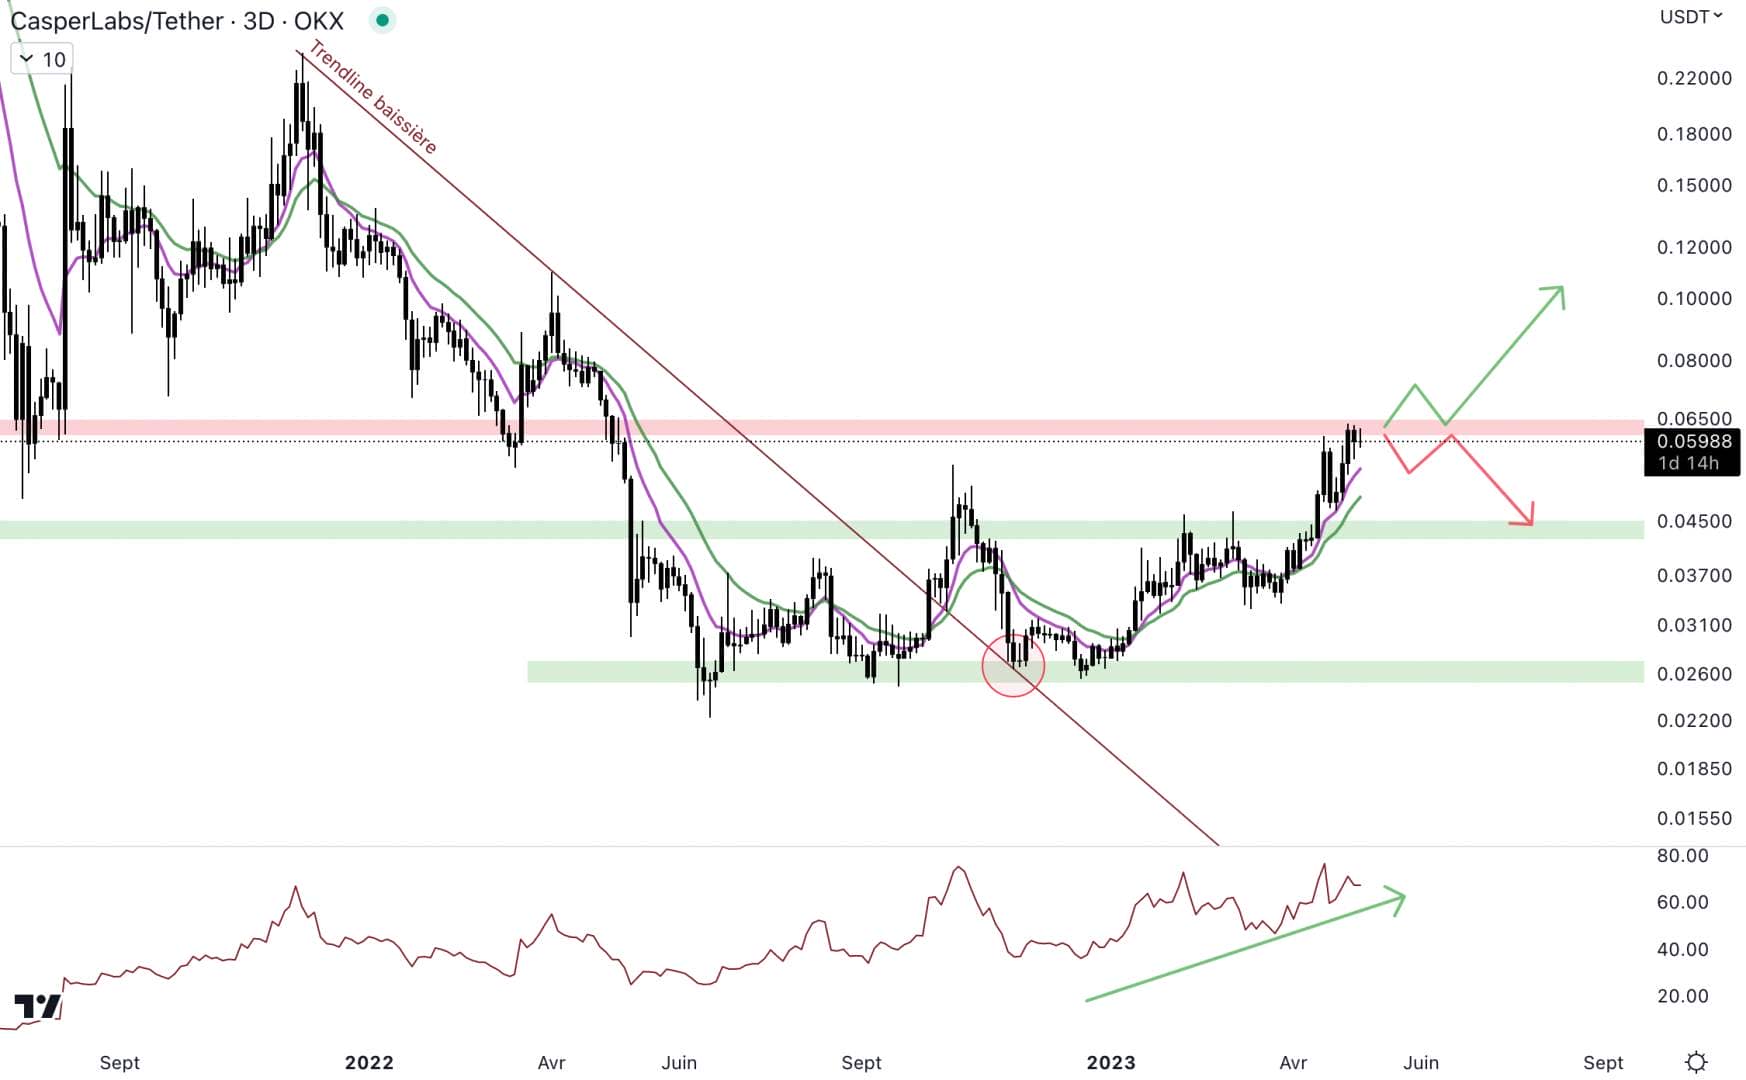
During the bearmarket, the price broke the level of support at $0.062. Then the price fell until it found buyers around $0.026. The course has set up a ranges between $0.026 and $0.044. At the end of 2022, the bearish trendline was broken, and the price broke the upper limit of the range at $0.044. Following this breakout, the price joined the resistance at $0.062. Concretely, the price is up by 140% since January 2023. Here are the two scenarios which can be considered at this stage:
- Breakout of resistance at $0.062 : a break of the resistance would allow the price to continue on the bullish momentum. For the moment the price shows a dynamic with bottoms and ascending tops, the buyers have the hand on the price. Moreover, the institutional bias is bullishit could act as dynamic support. The price could then return to $0.095.
- Rejection at the resistance level at $0.062 : if the buyers weaken, the price could be rejected. In this case, a return to the level of the next support at $0.044 is possible. Buyers will then have to defend this level to avoid re-entering the range.
On the other hand, the RSI is bullish, it continues to show a trend with ascending lows and highs. For the moment, buyers have their hands on the momentum.
Amid the banking crisis, Bitcoin continues to be strong, but altcoins are struggling to express themselves. In 2023, altcoins are on the rise, but the capitalization of altcoins has been rejected at the resistance level at $670 billion. This resistance will have to give way if we want to see the altcoins perform again.
For now, the dominance of bitcoin continues to trend upward. Bitcoin is attracting capital, and a close above 49% would be a sign of bullish continuation. The ETH/BTC pair is still fragile, it will be necessary to wait for the price to break the bearish trendline to regain color. If the altcoin leader becomes strong against Bitcoin again, altcoins could benefit. Casper is the altcoin of the week, it is up more than 10% in one week. It has been showing bullish momentum since January 2023, but it is moving at an important resistance level. If it gives way, the price could rise towards the next resistance at $0.095.
Do you want to delegate the trading of some of your cryptocurrencies? Through his optimized trading serviceCryptoTrader allows you to maximize your profits in a simple, diversified, and fully automated way.