Both analyzed cryptocurrencies Ethereum (ETH) and Cardano (ADA) follow Bitcoin (BTC) north and are breaking away from their previous week’s lows for the time being.
Ethereum (ETH): Ether course can defend key support
- Course (ETH): 3,120 US dollars (USD) (Previous week: 2,793 USD)
- Resistance / goals: $ 3,114, $ 3,446 / $ 3,361, $ 3,597, $ 3,807, $ 3,976, $ 4,374, $ 5,073, $ 5,393, $ 6,014, $ 7,027, $ 8,666
- Supports: US $ 2,956, US $ 2,733, US $ 2,659, US $ 2,611 / US $ 2,540, US $ 2,447, US $ 2,344, US $ 2,280, US $ 2,174, US $ 2,022 / US $ 2,050, US $ 1,930, US $ 1,792, US $ 1,713, US $ 1,664, US $ 1,545, US $ 1,489, US $ 1,425 USD, 1,359 USD
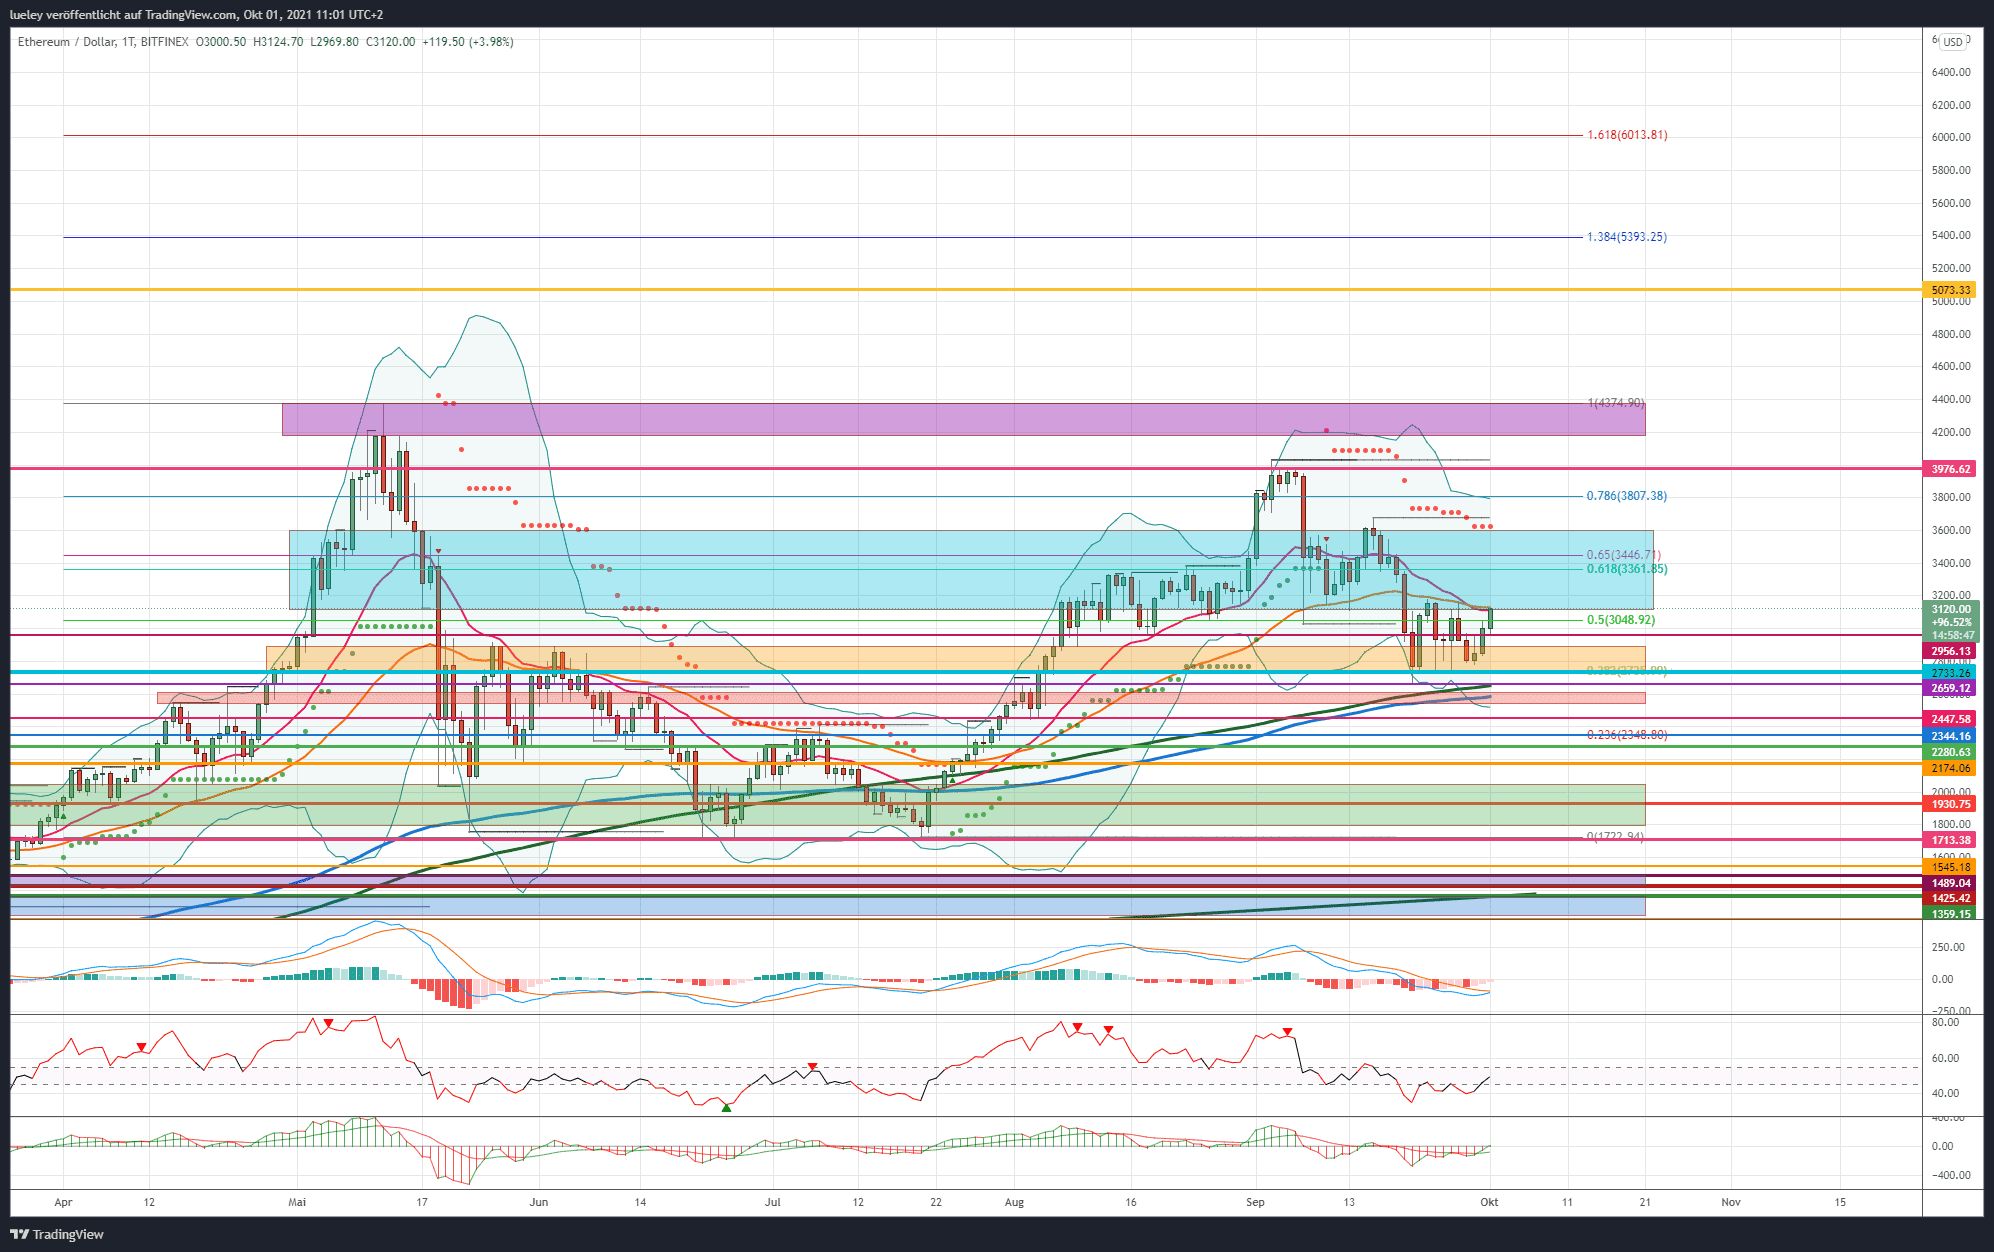
Price analysis based on the value pair ETH / USD on Bitfinex
- Ethereum back at key resistance at $ 3,114.
- First major price target at USD 3,597.
- $ 2,733 acts as the central support level.
The ether price managed to defend the make-or-break level at USD 2,733 again this week. The previous week’s low of USD 2,659 was not restarted, which is bullish. Now the buyer side has to do everything possible to jump back above USD 3,114 at the daily closing price in order to spark further price potential in the direction of USD 3,446.
Bullish variant (Ethereum):
After a breather, the bulls have returned in the last few days of trading. The recapture of the USD 2,956 resulted in a significant increase to the current USD 3,113. This means that Ethereum is again at the strong resistance from EMA20 (red) and EMA50 (orange). If this price mark is regained, targets at USD 3,361 and USD 3,446 will come back into focus. If the bulls manage to stabilize the ether price above USD 3,446, a march through to the top of the blue zone at USD 3,597 is likely. The first profit-taking is likely to occur again here. If this resistance level is also broken at the daily closing price, the next price target is activated in the form of the Fibonacci 78 retracement at USD 3,807. A breakout above this resistance brings the high at USD 3,976 back into focus. Only when this strong resistance is sustainably overcome, should Ethereum target the purple resistance zone between USD 4,185 and the previous all-time high of USD 4,374.
The way towards the all-time high
A ricochet at USD 4,374 is likely on the first attempt. If this chart mark can also be broken sustainably in the medium term, a march through to the next price target of USD 5,073 is conceivable. If Ethereum stabilizes above USD 5,000, a subsequent increase to the 138 Fibonacci extension at USD 5,393 should be planned. In the medium term, an increase of up to USD 6,014 would not be ruled out. This is where the 161 Fibonacci extension of the current trend movement runs, an important resistance level. An increase of up to USD 7,027 would then be conceivable for the coming months. The maximum price target remains at USD 8,666. The Fibonacci extension of the overriding upward movement runs here.
Bearish variant (Ethereum)
The bears once again missed their chance to break key support at $ 2,733. Precisely in the last week of trading, the ether price bounced off this key support mentioned several times. The bears must now try to keep the ether price below USD 3,151. If this endeavor is crowned with success, Ethereum must be sold immediately back below USD 2,956. This is the only way for the seller’s warehouse to approach USD 2,733 again and also target the low of USD 2,659. However, the MA200 (green) is currently also running here, which should have a supportive effect. A fall below the daily closing price of USD 2,659 would have a corresponding signal effect. Then the red support area would come into focus. The EMA200 (blue) can currently be found in this area of the chart.
If this support zone is subsequently abandoned, the correction extends to USD 2,447 or even USD 2,344. Here the 23rd Fibonacci retracement runs paired with the breakout level of the price rally on July 29, 2021. Falling below this chart area would extend the correction to at least USD 2,174. In the medium term, Ethereum could even target the green support area. In particular, the USD 1,930 and the support at USD 1,713 are highly relevant. If the USD 1,713 does not stop either, a correction widening to at least USD 1,545 is probable. Looking ahead, the purple support area between USD 1,489 and USD 1,425 comes into focus as a possible target for this downward wave. The maximum deductible correction target is still USD 1,359. However, as long as Ethereum can hold its own above the low at USD 2,659, a sell-off in these chart regions is not to be planned.
Indicators (Ethereum)
The RSI managed to climb back into the neutral zone between 45 and 55 in the last two trading days. The MACD indicator will also be able to generate a fresh buy signal if the price remains strong. This means that the risk of a sell-off could be averted for the time being. Thus, threatening sell signals in the weekly chart are averted for the time being.
Cardano (ADA): ADA course rebounds southwards at EMA20
- Course (ADA): 2.15 USD (Previous week: 2.20 USD)
- Resistance / goals: $ 2.15, $ 2.24, $ 2.30, $ 2.46, $ 2.57, $ 2.76, $ 2.86, $ 3.02, $ 3.10, $ 3.36, 3, $ 92, $ 4.83, $ 6.29, $ 7.75
- Supports: US $ 2.02, US $ 1.90, US $ 1.82, US $ 1.74, US $ 1.66 / US $ 1.61, US $ 1.48, US $ 1.42, US $ 1.35, US $ 1.27, 1, $ 19, $ 1.10, $ 1.00, $ 0.93
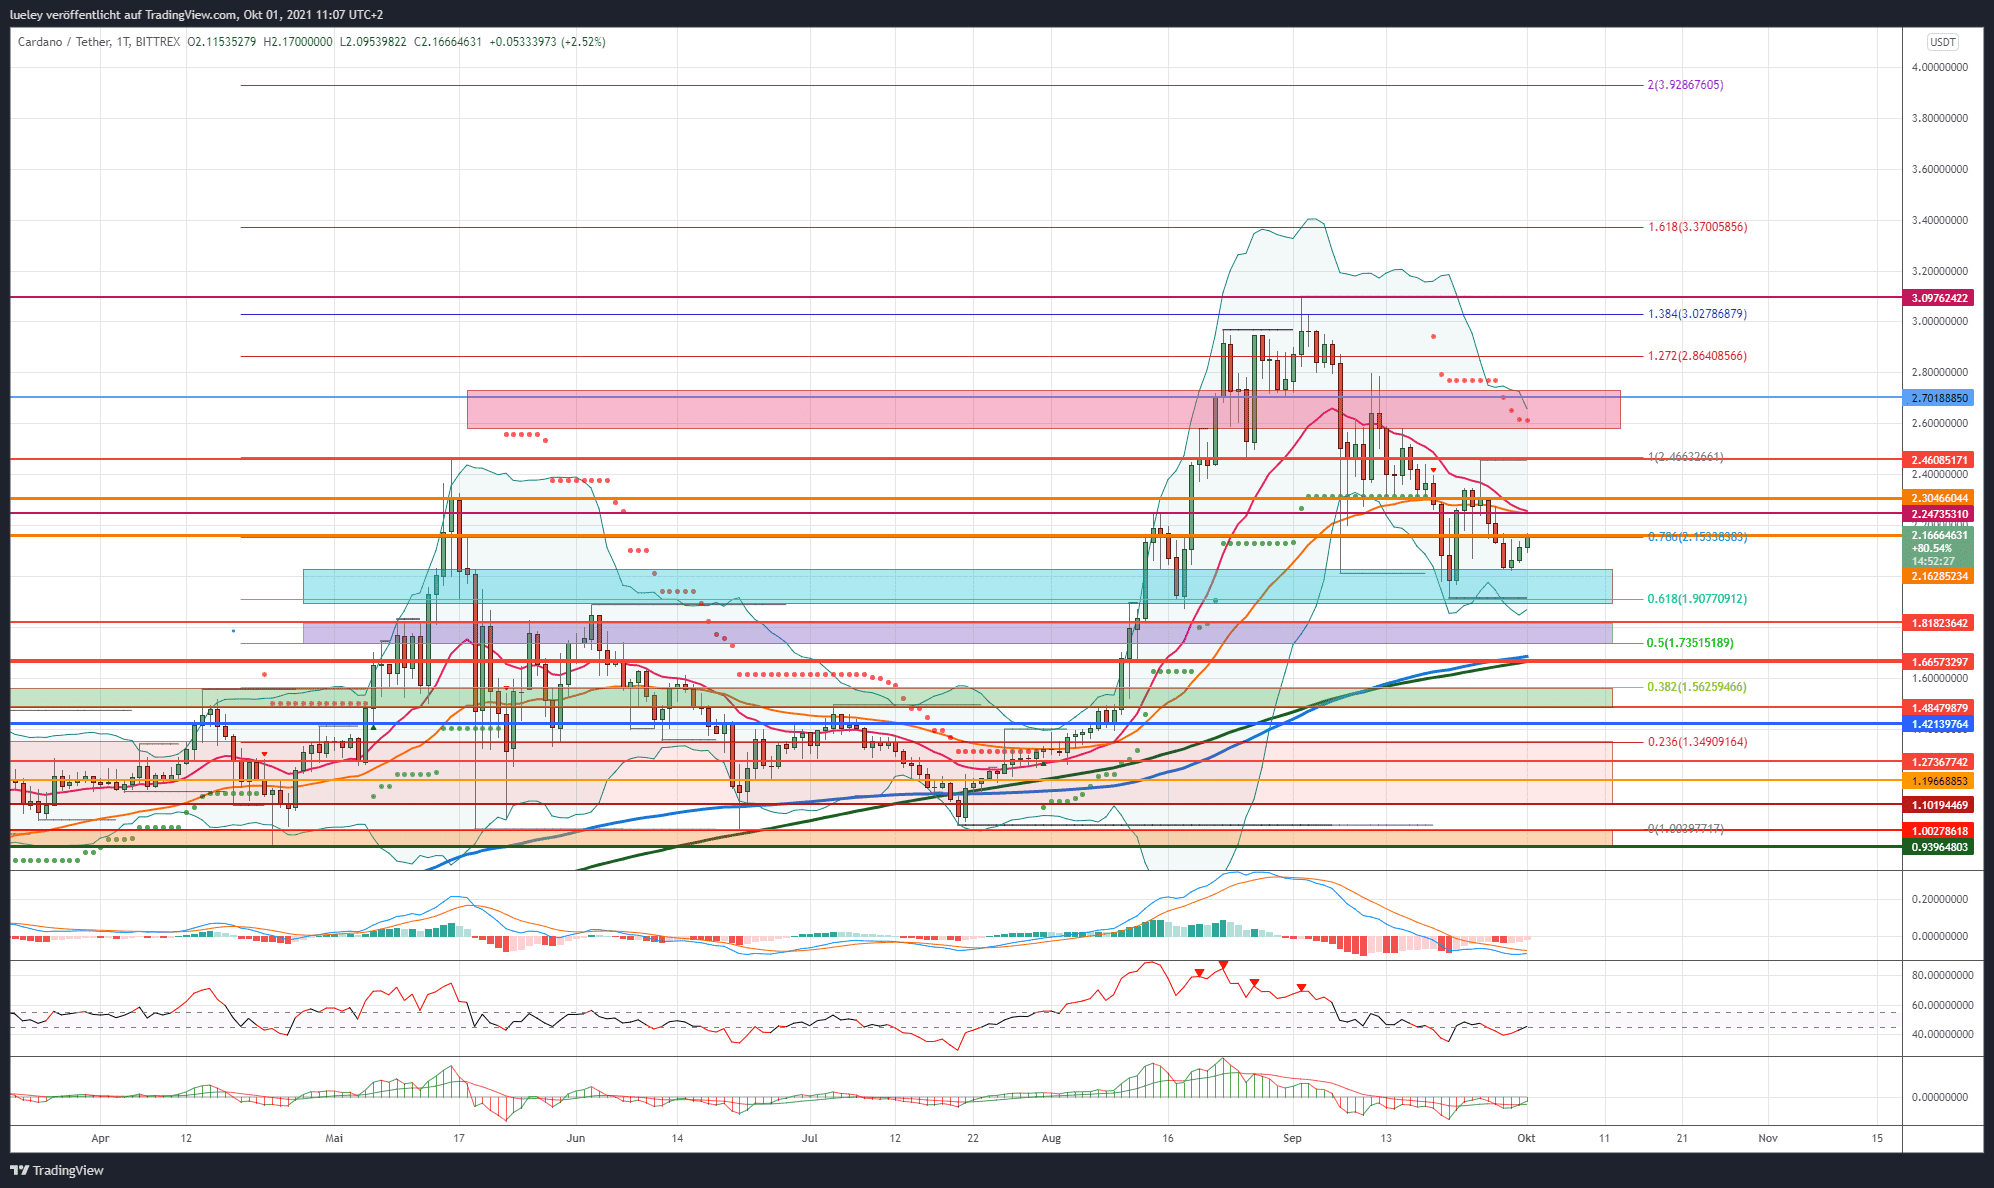
Price analysis based on the value pair ADA / USD on Bittrex
- ADA rate can stabilize above USD 2.00 for the time being.
- As long as Cardano does not rise dynamically back above 2.46 USD, lower prices are possible at any time.
- Area around USD 1.90 now as key support level
Although Cardano was able to announce a few new partnerships at the latest summit, these have so far hardly helped the ADA course. At least Cardano can maintain its position above the support range between USD 1.90 and USD 2.02, but there was no sustained bullish backlash. The bulls must therefore do everything in their power to stabilize ADA above this support zone.
Bullish variant (Cardano)
Cardano’s price has remained weak over the past seven trading days. A short-term rise attempt towards the strong resistance at USD 2.46 last weekend was mercilessly sold off in the following days. However, the bulls did not manage to break the ADA rate back below the support at USD 2.02. Cardano is currently trading at USD 2.12 below the cross resistance of EMA20 (red) and EMA50 (orange), both of which are currently trading at USD 2.24. If the bull manages to break out back above USD 2.15 in the short term and subsequently also overcome the range between USD 2.24 and USD 2.30, the first important target will be USD 2.46. If this resistance is overcome, there are opportunities for increases up to the red resistance area between USD 2.57 and USD 2.76. In addition to several horizontal resistance levels, the supertrend at USD 2.57 and the upper Bollinger band at USD 2.64 can be found here.
If these resists are recaptured at the daily closing price, the USD 2.86 mark moves into focus as the target. The Fibonacci extension of 127 can be found here. If the buy side manages to break this price mark, an increase to the 138 Fibonacci extension at USD 3.02 must be planned. Only when this mark is dynamically overcome will the all-time high of USD 3.10 come into focus. If the all-time high at USD 3.10 can be broken in the coming weeks, the next price target will be activated at USD 3.36. This is where the 161 Fibonacci extension runs, which is a first important price target.
If a stabilization takes place above this resistance level, an increase to the 200 Fibonacci extension at USD 3.92 is likely in the medium term. A breakout above this activates the repeatedly mentioned target at USD 4.83 for the coming trading months. If Cardano remains bullish and jumps above the psychological mark of USD 5.00 in perspective, an increase to the 361 Fibonacci extension at USD 6.29 is conceivable. The overriding price target of USD 7.75 would then have continued to exist. This is where the 461 Fibonacci extension can be found.
Basic variant (Cardano)
The bears will do everything in their power to cap Cardano’s price below USD 2.46 by the end of the day. At this level at the latest, but preferably already at the cross resistance at USD 2.24, the bears will do everything in their power to sell off the ADA price again in the direction of the blue support area. The aim must be to sustainably undercut the low of 1.90 USD. A relapse below the cross support from the 61 Fibonacci retracement and the low of August 18 should allow the ADA rate to correct to at least USD 1.82. A direct call to the USD 1.74 must also be planned. This is where the 50s Fibonacci retracement runs.
A dynamic break of the USD 1.74 would have serious consequences and bring the USD 1.66 into focus. The two moving support lines EMA200 (blue) and MA200 (green) are currently running here. The 38 Fibonacci retracement at USD 1.56 would also be a possible price target. In addition, the breakout level of the current price movement can be found at USD 1.48. If Cardano does not turn significantly northwards, medium-term price targets of USD 1.35 (23 Fibonacci retracement) and a maximum of USD 1.10 cannot be ruled out. However, as long as the bulls can defend $ 1.90, targets below $ 1.66 are unlikely.
Indicators (Cardano)
Both the RSI and the MACD are currently still showing sell signals. However, both indicators are currently tending north again. If prices continue to rise, the RSI indicator should then jump back into the neutral zone between 45 and 55 and avert the greatest danger for the time being. Ideally, a price strength in the coming trading weeks also prevents fresh sell signals in the weekly chart, which would cause further downside risks.
Disclaimer: The price estimates presented on this page do not constitute buy or sell recommendations. They are only an assessment of the analyst.
The chart images were created using TradingView created.
USD / EUR exchange rate at the time of going to press: 0.85 euros.