Ethereum (ETH) and Solana (SOL) are rising back towards central resistance levels and could continue to grow in the future.
Ethereum (ETH): Ether course at a sensitive course level
- Course (ETH): 2,051 US dollars (USD) (Previous week: 2,051 USD)
- Resistance / goals: $ 2,471, $ 2,645, $ 2,886, $ 2,982, $ 3,198, $ 3,568, $ 3,715, $ 3,976, $ 4,374
- Supports: $ 2,344, $ 2,261, $ 2,174, $ 2,022 / $ 2,050, $ 1,930, $ 1,792, $ 1,713, $ 1,664, $ 1,545, $ 1,489, $ 1,425, $ 1,294, $ 1,223, $ 1,049, $ 984, $ 922, $ 769, $ 544
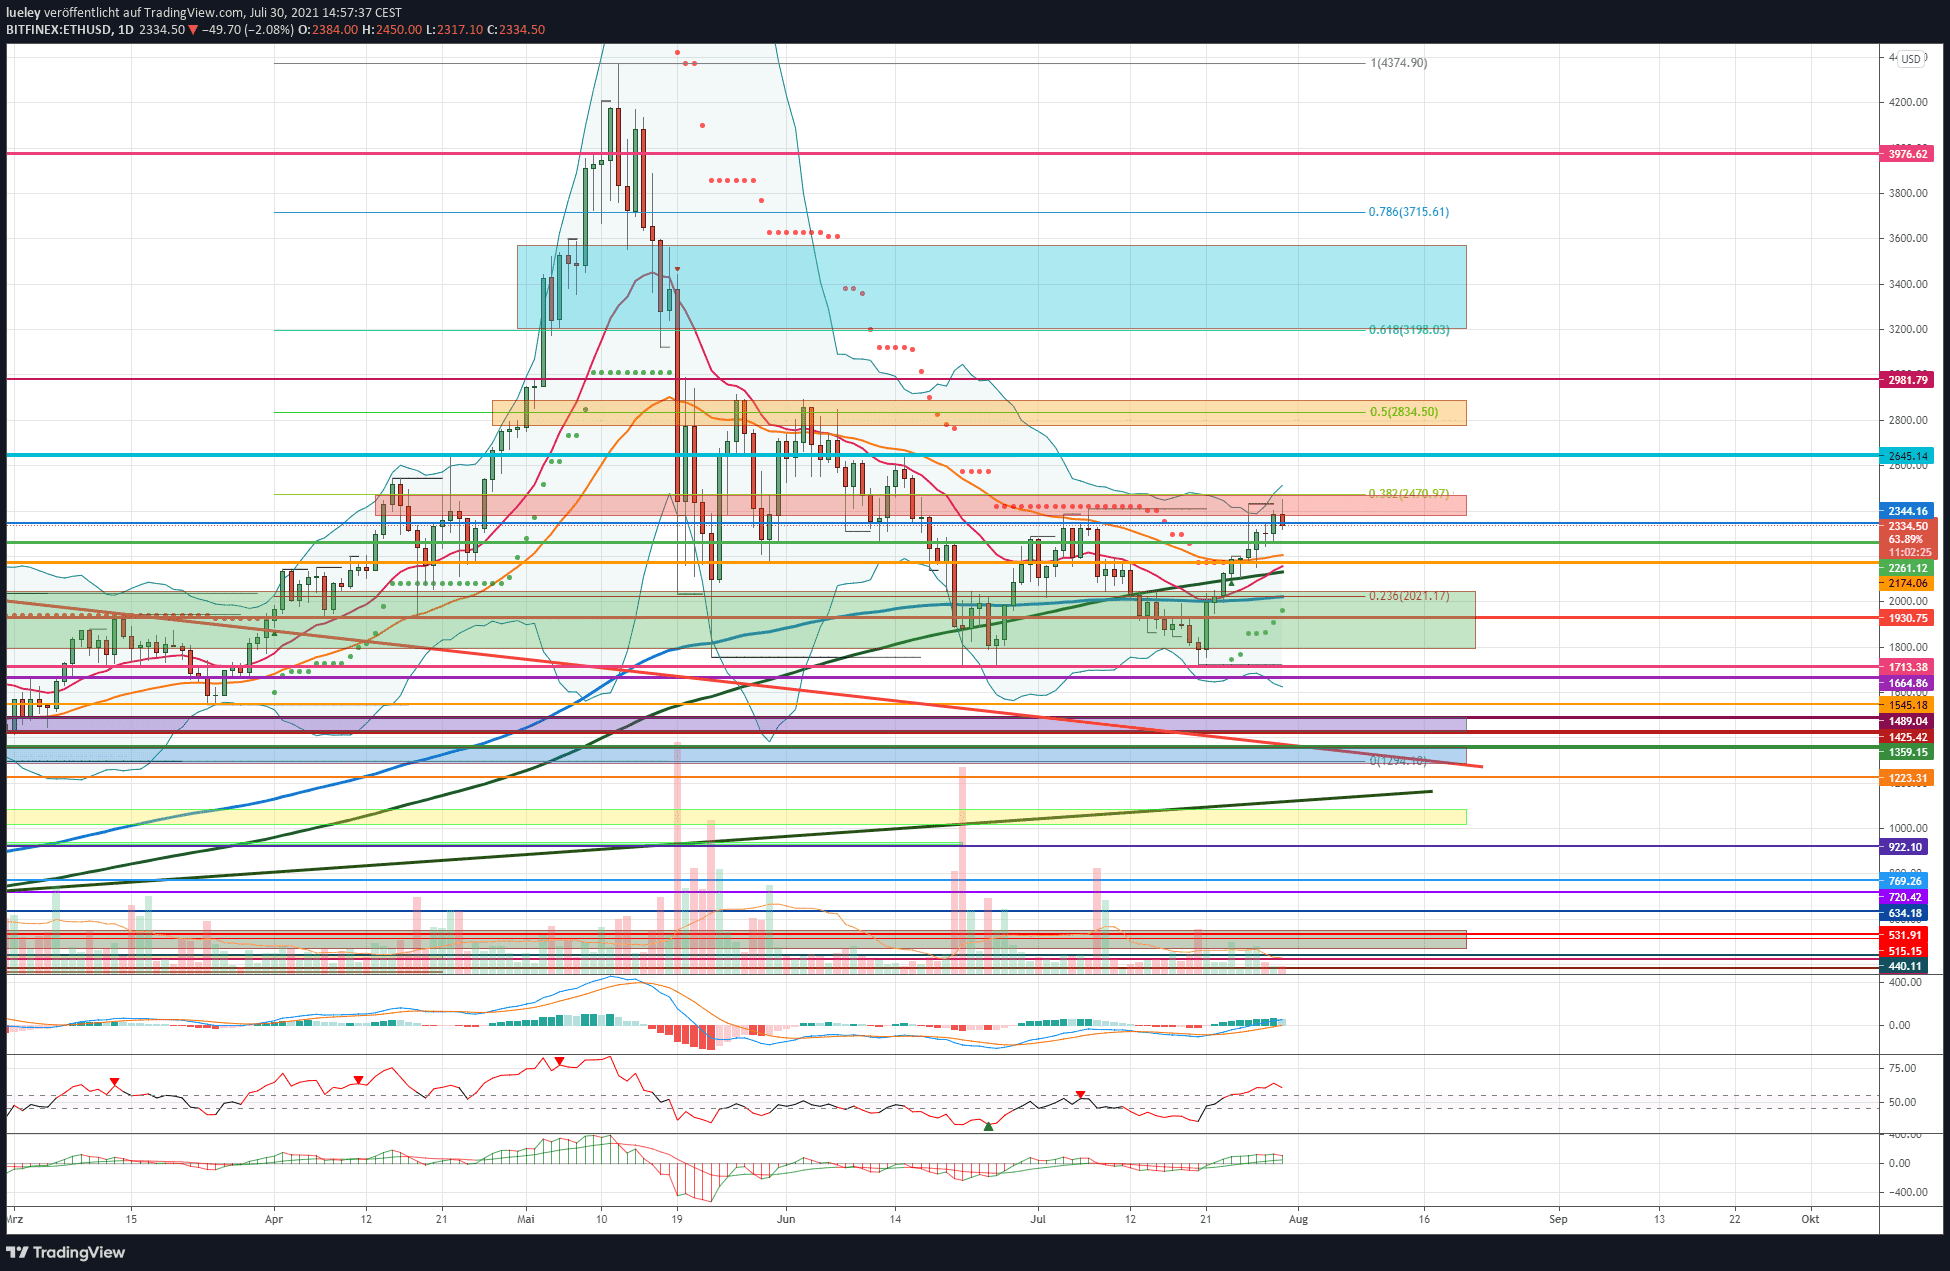
Price analysis based on the value pair ETH / USD on Bitfinex
The ether price is still on the rise, reaching a new monthly high this morning at USD 2,455. With this, Ethereum has almost reached the maximum price target of USD 2,471 mentioned in the previous week. If this resistance level is broken by the daily closing price, a march through to the next target price at USD 2,645 can be expected in the near future. As long as the ether price does not dynamically drop back below the USD 2,022, the view is directed north.
Bullish variant (Ethereum):
The ether price rose this trading week to just a few US dollars, reaching the maximum price target stated in the previous week of 2,471 USD. Only $ 20 was missing, which is why the target price is to be regarded as processed. The bulls begin to take profits in the last hours of trading. Several reasons can be given for this.
In addition to the expiry of futures bets on the crypto key currency Bitcoin on Friday, the message that Binance.com is suspending futures and derivatives trading with immediate effect in Germany, Italy and the Netherlands also had an impact Negative reaction to the overall market. Currently, however, the ether price is relatively stable and can defend the first support at USD 2,344 for the time being. Even if Ethereum should consolidate further, as long as the Ether price does not fall below the key support at USD 2,174 and in particular does not fall below USD 2,022, the chances of a further price increase in the coming days and weeks are good. Should Ethereum stabilize above these support levels and fall back to USD 2,471, a directional decision could be made here.
If the ether price breaks the resistance at USD 2,471 at the end of the day, a subsequent rise to USD 2,645 is likely. If the breakout above this resistance succeeds, a march through to the orange resistance area is conceivable. If the 50s Fibonacci retracement is broken and the high at USD 2,886 is also overcome, Ethereum could rise to the resistance at USD 2,981 in the medium term. If the overall market continues to trend bullish in combination with a breakthrough in Ethereum at USD 2,981, the focus is on the 61 Fibonacci retracement at USD 3,198. Here investors are likely to want to cash in again. As long as Ethereum does not subsequently drop below USD 2,471, a break through to the upper edge of the blue resistance area at USD 3,568 is possible in the coming months. A rise to the 78 Fibonacci retracement at USD 3,715 is also conceivable. As mentioned several times in the previous weeks, the maximum price target is in the range of 3,976 USD. Only when Bitcoin can drag its way back above USD 53,000 will the all-time high of USD 4,374 also come back into focus with Ethereum.
Bearish variant (Ethereum)
The bears are back in time after a week of hibernation, fending off a surge above the weekly target of $ 2,471 for the time being. If it is now possible to generate enough downward momentum, a relapse to USD 2,261 is initially conceivable. However, in order to keep the Ether price down in the long term, the first thing to do is to dynamically undercut USD 2,174. There is a whole bundle of supports between USD 2,174 and the key support at USD 2,022: EMA20 (red), MA200 (green) and EMA200 (blue) represent strong supports. the probability of a renewed sustained downward movement increases. If the USD 1,930 is subsequently undershot and thus also the supertrend, a relapse to the previous week’s low of USD 1,713 should be planned. If the bears manage to break through this low, price targets will be activated at USD 1,664 and USD 1,545.
The lower Bollinger Band is currently bending downwards and signals increased price volatility. If the ether price falls back to the low of March 2021, the bulls would have to slowly take action to avert a widening correction. If this support level is also dynamically undershot, a downward movement back into the purple support area between USD 1,489 and USD 1,425 is to be expected. If these price markers do not stop either, consolidation up to USD 1,359 and USD 1,294 should be planned in the medium term. Increasing overall market weakness could even lead Ethereum up to USD 1,049. This would also give up the overarching green upward trend line. If this area breaks down sustainably, a relapse to around USD 922 is to be planned. If Bitcoin falls back to USD 20,000, a correction towards USD 769 and USD 720 is also conceivable. The maximum bearish price targets are still USD 544 and USD 489. For the time being, however, these are purely theoretical in nature.
Indicators (Ethereum)
Both the RSI and the MACD are currently showing a buy signal. In the weekly chart, too, the RSI indicator is about to give a new buy signal. In contrast, the MACD still has a clear sell signal. In the short term, buyers are in control.
Solana (SOL): Solana resists correction and climbs up to an important resistance zone
- Course (SOL): 30.95 USD (Previous week: 28.69 USD)
- Resistance / goals: $ 31.44, $ 32.97, $ 34.04, $ 36.64, $ 38.11, $ 41.77, $ 43.27, $ 44.17, $ 47.89, $ 49.98, $ 52.62, $ 58.20
- Supports: $ 28.73, $ 25.53, $ 23.69, $ 22.06, $ 20.11, $ 19.11, $ 18.20, $ 16.66, $ 12.54
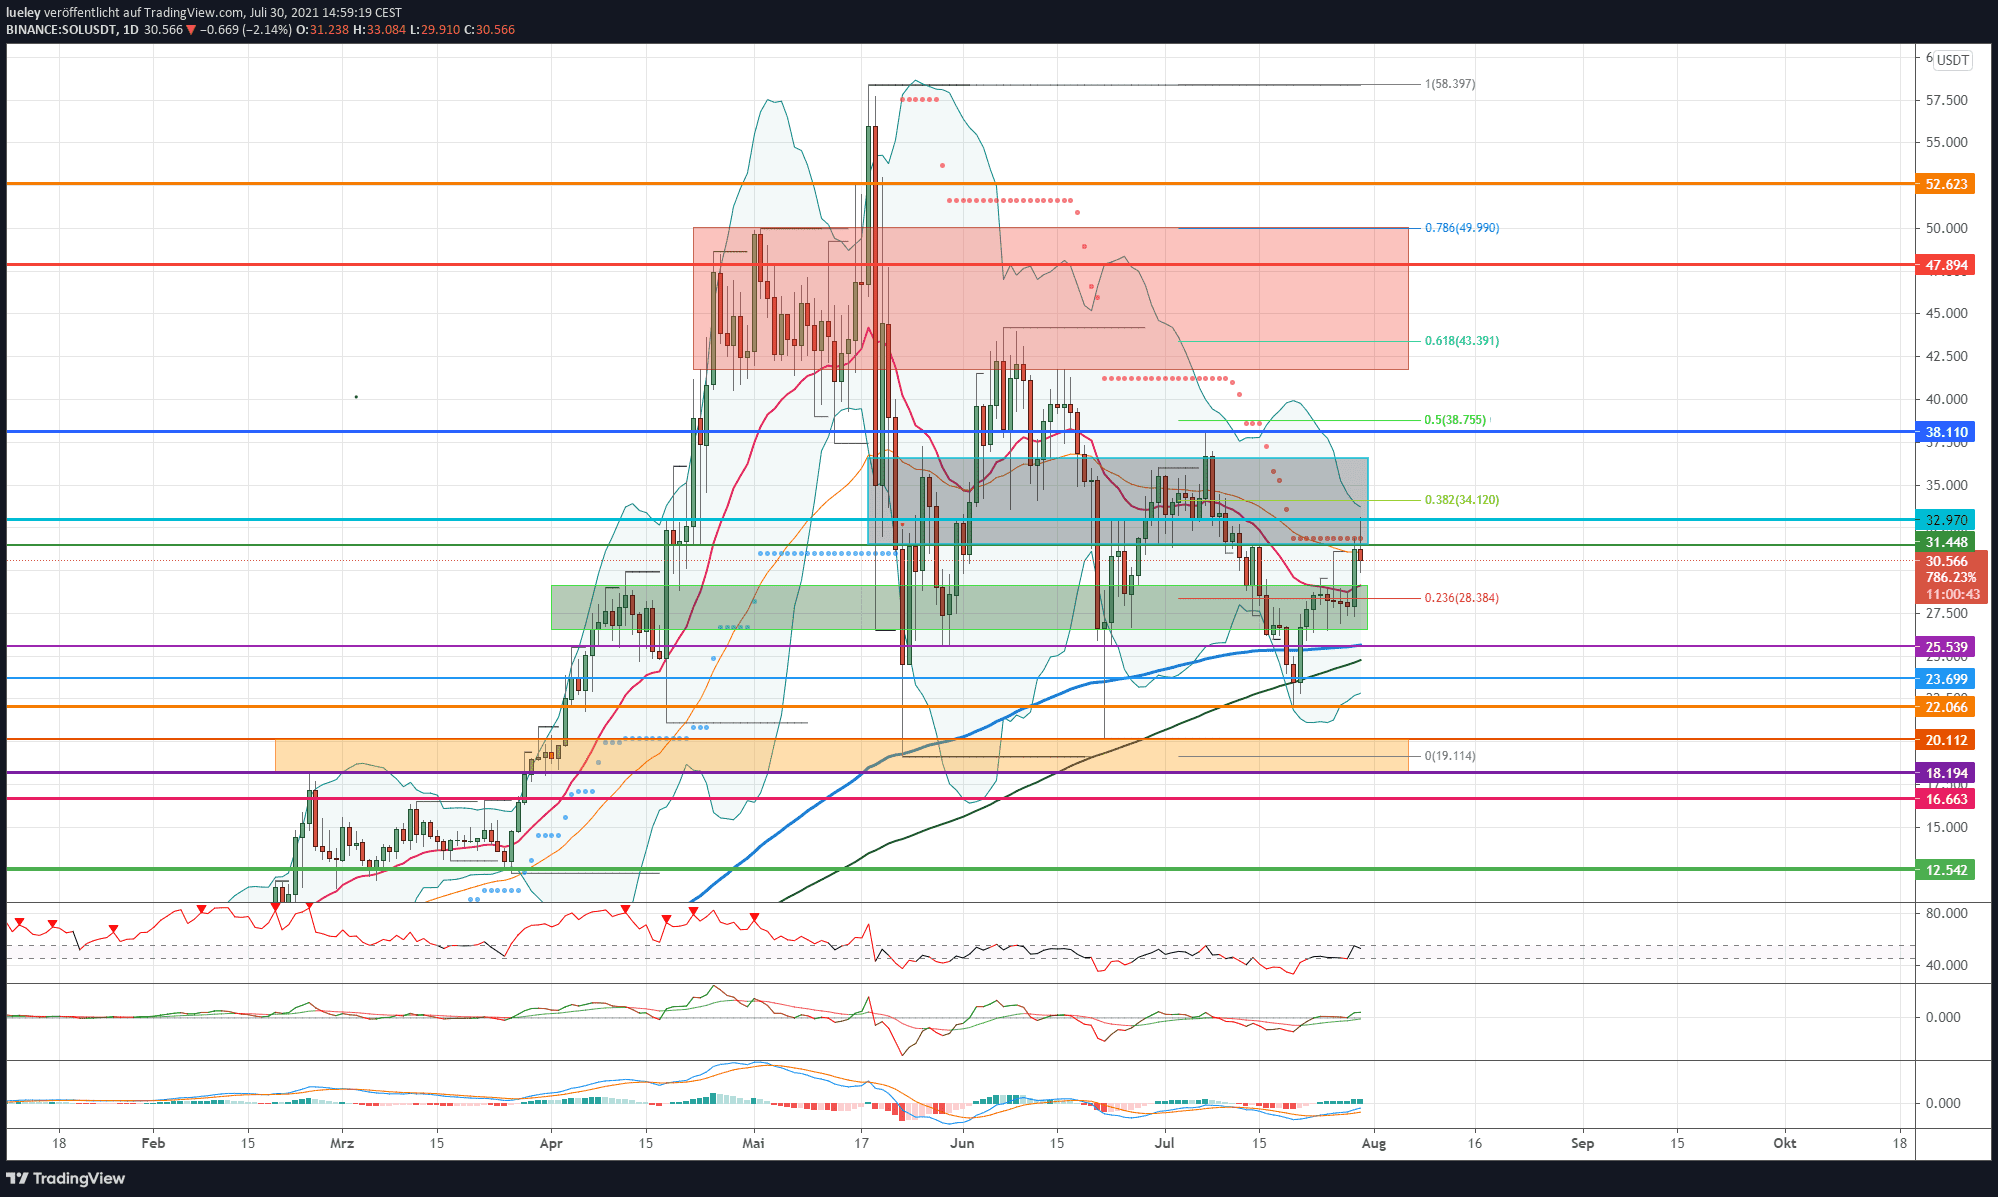
Price analysis based on the value pair SOL / USD on Binance
- SOL course can assert itself well and is currently trying to overcome the EMA50 (orange).
- USD 34.12 as the first important price target on the way to old strength.
- $ 25.53 now acts as major key support.
The high-speed blockchain Solana is increasingly returning to its old strength after significant price drops in the previous weeks. On Friday, July 30th, the price rose to the resistance at USD 32.97 before the SOL price fell to USD 30.97 in the last hours of trading. As long as Solana can stabilize above USD 25.53, the view will continue to be upwards.
Bullish variant (Solana)
Although Solana was able to gain significantly in the last few days of trading, it rebounded on today’s Friday, July 30, 2021 on the supertrend towards the south. Should this resistance and subsequently also USD 32.97 be broken, the chart will brighten further. The current upward momentum of Solana could lead the SOL course in the first step up to the 34.12 USD. The 38th Fibonacci retracement and the upper Bollinger band can be found in this area. Only when the bulls manage to overcome this price mark at the daily closing price will new opportunities for increases in the direction of USD 36.64 arise. If this resistance level is also overcome, the course high from the beginning of the month at USD 38.11 will come into focus again.
If this chart mark breaks through and the Fibonacci 50 retracement at USD 38.75 is overcome, an increase to the red resistance zone can be expected. In particular, in the area of the 61 Fibonacci retracement at USD 44.17, clear resistance from the bears is to be expected. If this area is also broken through sustainably, the SOL rate rises to USD 47.89 or even USD 49.98. Here you can find the upper edge of the resistance zone and the 78th Fibonacci retracement. The first profit-taking is therefore likely. If the overall market rises, a subsequent rise above USD 52.62 to the all-time high of USD 58.20 is conceivable. For the time being, this resistance level represents the maximum price target for the coming trading weeks.
Bearish variant (Solana)
The bears are currently trying to fend off the bulls’ march through. If the SOL course succeeds in reversing the daily closing rate below the EMA50 (orange) at USD 31.44 towards the south, the green support zone will come into focus again. If the seller manages to maneuver the SOL price back below the EMA20 (red) and the 23 Fibonacci retracement at USD 28.33, this would be an important partial success. Should the SOL price break through this support as well, the correction should extend to the interim low at USD 25.53. The EMA200 (blue) is currently running here, which is why resistance from the bulls is to be expected. However, if Solana continues to trend weakly and also gives up the 23.69 USD, another price setback is to be planned. The first target would be the previous week’s low at USD 22.06.
If this support level is also dynamically undershot, the probability of a retest of USD 20.11 increases. This is where the striking low of June 22, 2021 runs. A direct price slide to the low of May 23 of this year cannot be ruled out. A fall below USD 19.11 would generate further downside potential. The next target price is 18.20. Here, the SOL course will presumably initially bounce off towards the north. A relapse to the red horizontal support line at USD 16.66 is only conceivable if this support zone is also undercut by the daily closing price. The support at USD 12.54 acts as the maximum bearish price target. For the time being, however, the bullish scenario is preferable.
Indicators (Solana):
The RSI is about to generate a new buy signal in the daily chart. A break out of the neutral zone between 45 and 55 should generate further upside potential. This view is underpinned by the active long signal in the MACD.
Disclaimer: The price estimates presented on this page do not constitute buy or sell recommendations. They are only an assessment of the analyst.
The chart images were created using TradingView created.
USD / EUR exchange rate at the time of going to press: 0.84 euros.