
The prince of cryptos in a lethargic situation! – At the start of a week that is likely to be driven by GAFAM publications and the FED’s favorite economic statistic, the PCE (Household Consumer Price Index), many investors would hope that the cryptocurrencies have been coming out of their recovery period since mid-September. Rightly, the latter would like to know if the price of Ethereum (ETH) would preserve or not the 1400$, that is to say the ATH of 2018.
The current momentum is marked by a certain immobility whether on the side of bulls or bears. But the former remain in a precarious position given the magnitude of the bear market for ETH since its last ATH in November 2021. Moreover, the latest technical analyzes are currently not favorable to them. Not to mention that the fundamentals that would propel the prices of the prince of cryptos, are struggling to manifest themselves so far.
It is always in a market context full of uncertainties that we will study the latest graphic evolutions of Ethereum both from a medium-long term perspective and from a short term perspective.
This analysis of the Ethereum price is offered to you in collaboration with CryptoTrader™ and its algorithmic trading solution finally accessible to individuals.
Ethereum in Weekly Units – Fifth Consecutive Week of Boredom around the 2018 ATH
Another week of rolling your thumbs! In effect, Ethereum has just confirmed a fifth week around the 2018 ATH. Certainly, there is no damage at this stage. But it is clear that it is a convalescence or a status quo which persists in the ambient gloom. However, this week could give us more information on the Fed’s monetary tightening and the state of health of the GAFAMs, which themselves represent the major weightings of the S&P 500 index.
Awaiting their official publications, ETH prices and the Chikou Span are still lagging below the Kumo (Ichimoku Cloud) since last May. And on this subject, we could wait a long time to go back beyond one of the pillars of the Japanese technical indicator. On the other hand, by dint of marking time slightly below the resistance of $1400, the threat of returning towards the lows of the year, not far from the support of $1000, does not weaken with regard to a year 2022 which is proving disastrous for the moment. Finally, to make matters worse, the Kijun continues its slide since the formalization of The Merge.
With so many unfavorable technical signals in weekly units on the prince of cryptos, it would take some pretty robust catalysts for the recent recovery period to turn into a temporary lull situation. And if I insist on this last adjective, it is becausea potential price crossing beyond the descending line would not be enough to validate the end of Ethereum’s bear run since its last ATH in November 2021. Because precisely, the prices of Ethereum would still be below the Kumo despite an upward break of the resistance of $1700.
Ethereum in daily units – Prices are approaching Kumo and the upper boundary of the downtrend channel
Although an improvement in the weekly chart situation is slow to come in the immediate future, we see in daily units, a slight cause for hope without however being carried away by unjustified euphoria. In effect, Ethereum was able to stay the course above the Tenkan and the Kijun in order to return simultaneously towards the upper limit of the bearish channel and the Kumo.
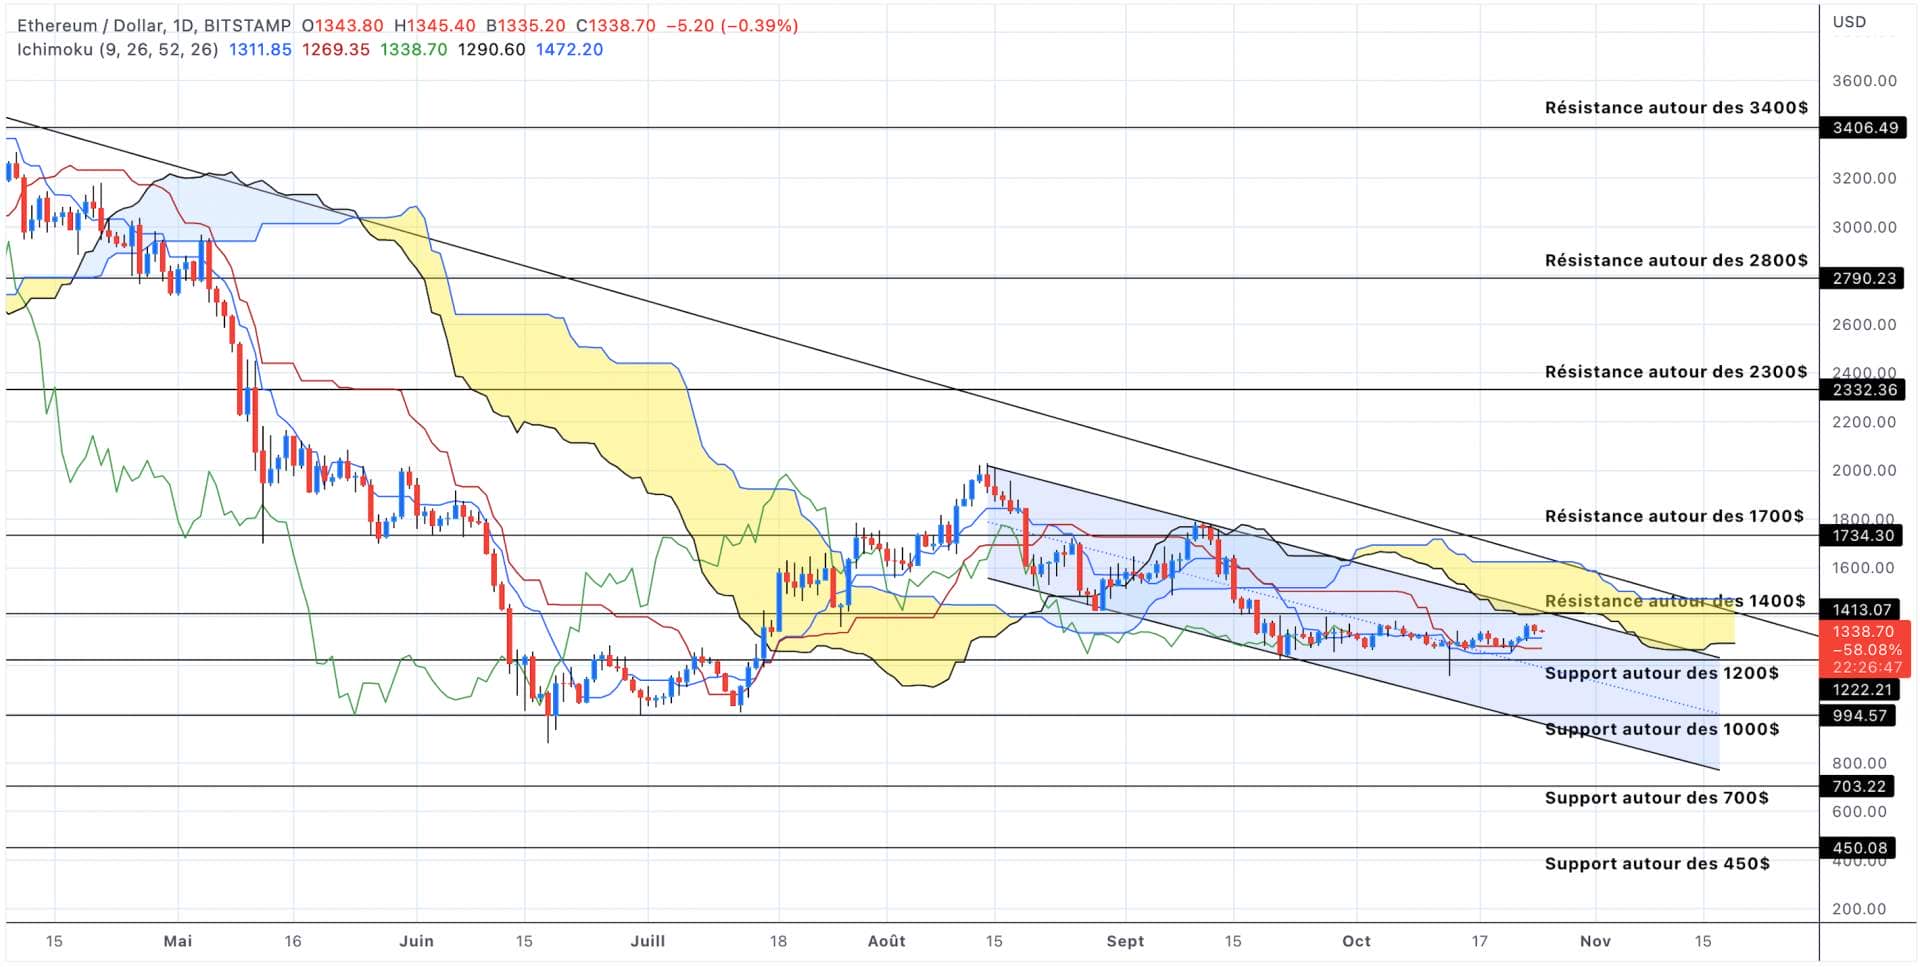
Assuming an exit from the top of this downtrend channel, ETH prices would move back inside the Kumo. With the possibility of testing the $1700 again. But unlike previous attempts, they could afford a move above the descending line of the bear run. And by shedding this resistance that had previously hurt the bulls, we would open the door towards the resistance of $2300.
Conversely, a failure below $1400, in addition to another below the support of $1200, could bring the prices of the prince of cryptos back towards its lows of the year around $1000. This would be consistent with the prices of the underlying towards the lower limit of the downtrend channel and a Chikou Span, which itself would slightly overflow the chart pattern downwards.
In summary, if the week were to show nothing new despite major events both macro and micro, Ethereum would have a strong chance of continuing its recovery around the 2018 ATH.
Even if we would postpone the deadline for a recovery of its bear run since its last ATH in November 2021, we do not have first-rate catalysts to put in our mouths to consider its neutralization. Not only that, the Fed’s monetary tightening could spread further as long as inflation in the United States does not drop to an acceptable level. But the strength of the dollar against major currencies and tensions in the bond market do not argue for a convincing jump in cryptocurrencies, themselves sensitive to liquidity (or lack thereof).
And assuming that a new unexpected event would be added to the current uncertainties on the financial markets, be careful that ETH does not lose its footing below $1000 at the risk of materializing new lows for the year. Thus, a third wave of correction would emerge under the sign of capitulation.
Is it possible to be a winner every time? Whether Bitcoin price is in great shape, or youthrough turbulence, CryptoTrader™ allows you to increase your chances of success through its 100% automated algorithmic trading tool.