
As expected, Ethereum (ETH) continued to gain in the last seven trading days. The implementation of the London update is currently creating a bullish mood among investors. The recently battered DeFi sector is also currently showing a positive trend. Uniswap (UNI) is benefiting from this development and has reached a new high.
Ethereum (ETH): Ether price reaches forecast price target
- Course (ETH): 2,777 US dollars (USD) (Previous week: 2,334 USD)
- Resistance / goals: $ 2,886, $ 2,982, $ 3,198, $ 3,568, $ 3,715, $ 3,976, $ 4,374, $ 5,073, $ 5,557, $ 6,278
- Supports: $ 2,645, $ 2,471, $ 2,344, $ 2,261, $ 2,174, $ 2,022 / 2,050, $ 1,930, $ 1,792, $ 1,713, $ 1,664, $ 1,545, $ 1,489, $ 1,425, $ 1,294
In the last few days of trading, the ether price has again increased significantly in value and reached the Fibonacci 50 retracement at USD 2,834 on Thursday, August 5, and is only trading insignificantly below this at USD 2,777 at the time of this analysis. If they manage to break through USD 2,882, investors will focus on price targets at USD 2,981 and even USD 3,198. On the downside, the USD 2,344 area is now acting as a new foundation of support.
Bullish variant (Ethereum):
In anticipation of the new London update, the ether price increased significantly in value. Starting from the previous week’s exchange rate at USD 2,334, Ethereum rose more than 20 percent northwards to a new high of USD 2,844. Although the ether price is trending slightly south on Friday, August 6th, it is now well hedged on the downside. If the bulls manage to break the upper edge of the orange resistance area at USD 2,886 in the coming trading days, a directional decision will be made at USD 2,981. This is where the retrace high of the candle from May 20, 2021 can be found. Only when this resistance level can be broken sustainably is a subsequent rise to the 61er Fibonacci retracement at USD 3,198 likely. This is where investors will want to take their first profits. As long as Ethereum can stabilize above the red support area between USD 2,471 and USD 2,376 in the coming trading week, a break through to the upper edge of the blue resistance area at USD 3,568 is possible.
A breakout above this resistance zone brings the 78 Fibonacci retracement at USD 3,715 into the focus of investors. A break through to the medium-term target price of USD 3,976, mentioned several times, could also be achieved faster than expected. In particular, if the token burn implemented in the London update gradually reduces the supply of Ethereum, this should continue to have a positive effect on the price development of Ethereum. If the ether price does not turn significantly south even after reaching the all-time high of USD 4,374, USD 5,073 should be mentioned as the projection target. An increase to the 138 Fibonacci extension at USD 5,557 is also conceivable in the coming months. The maximum price target can be found in the form of the 161 Fibonacci extension at USD 6,278. Although Ethereum is currently tending to be significantly stronger than the crypto key currency Bitcoin (BTC) in order to achieve price targets above USD 5,000, it needs a Bitcoin increase towards USD 50,000 and above.
Bearish variant (Ethereum)
The demand for Ethereum increased significantly this week and provided the bulls with a points win. The aim of the bears must be to push the ether price back below USD 2,645 towards USD 2,471. The red support zone is well hedged with the 38 Fibonacci retracement and the EMA20 (red). Only when the price drops dynamically below USD 2,344 and also abandons the EMA50 (orange) does the supertrend at USD 2,261 come into focus. Here the buyer camp will want to take over the helm again. If this support brand is abandoned against expectations and the MA200 (green) is also undercut at USD 2,174 per day’s closing price, that would be an important partial success. However, in order to sustainably push the Ether price down, it is necessary to dynamically undercut the USD 2,174. Another key support can be found at $ 2,022. The cross support from EMA200 (blue) and 23 Fibonacci retracement are unlikely to be broken on the first attempt.
Only when there is enough pressure to sell and the USD 2,022 per day’s closing price is broken would price targets of USD 1,930 and USD 1,713 be conceivable. If there is a fall back below the striking low at USD 1,713, the maximum price target for the coming trading weeks at USD 1,545 comes into focus. In addition to the horizontal support from March 25, there is also the lower Bollinger band on this cross support. The bulls will want to avoid falling below this support level. Should this support level be undercut, a correction expansion back into the purple support area between USD 1,489 and USD 1,425 cannot be ruled out. The maximum bearish price target can be found in the zone between USD 1,359 and USD 1,294 for the time being. The chart situation is currently not more than that.
Indicators (Ethereum)
Both the RSI and the MACD continue to show a buy signal. However, the RSI indicator is increasingly moving in the overbought area. In the weekly chart, however, the RSI generated a fresh buy signal. The MACD should also follow suit in the coming week. From an indicator perspective, the bullish price scenario is currently preferable.
Uniswap (UNI): Recovery on DeFi sector is gaining momentum
- Course (UNI): 25.04 USD (Previous week: 20.91 USD)
- Resistance / goals: $ 25.44, $ 28.93, $ 30.09, $ 32.70, $ 34.95, $ 36.61, $ 41.12, $ 44.87
- Supports: $ 23.10, $ 20.51, $ 19.33, $ 16.71, $ 15.88, $ 14.00, $ 13.02, $ 11.27, $ 9.11, $ 7.54
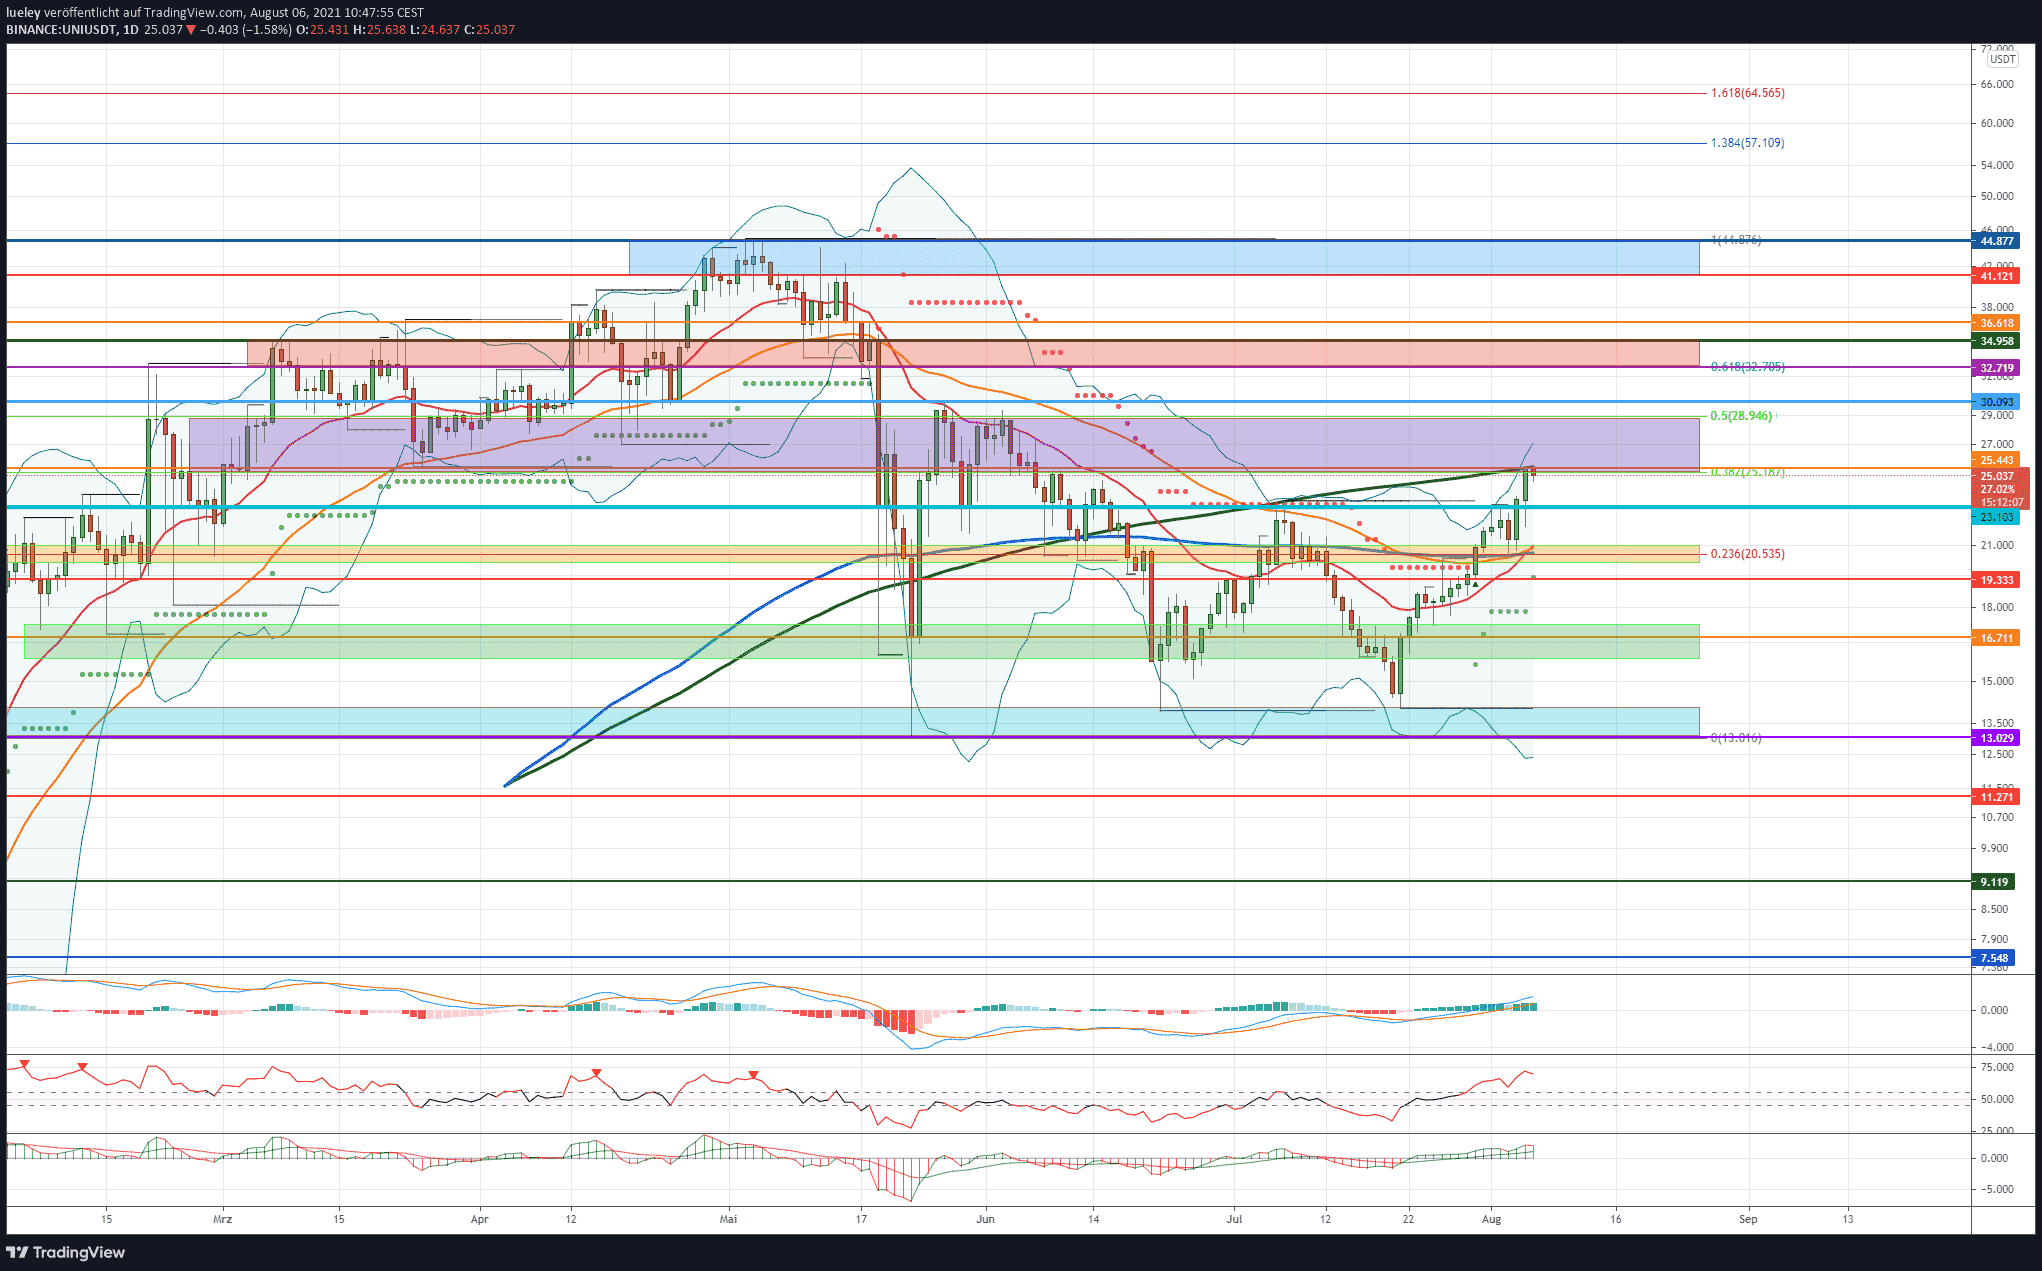
- UNI rate rises to the MA200 (green) at USD 25.44
- The next key price target is at USD 30.09
- Central support level is now at USD 20.52
The price of the DeFi protocol Uniswap has risen significantly to the north in the last few days of trading and overcomes the strong resistance at USD 23.10. Yesterday, Thursday, August 5th, the UNI course reached the MA200 and initially bounced off slightly towards the south. If there is a sustained breakout above this resistance, new price targets are activated at USD 28.94 and USD 30.09.
Bullish variant (uniswap)
The DeFi sector has been able to recover noticeably in the last 6 weeks of trading after a period of weakness. Uniswap is also benefiting from the comeback of this sector and has reached a new 30-day high. If the bulls manage to sustainably break through the cross resistance from the 38 Fibonacci retracement and MA200 in the coming trading days, a break through to the 50 Fibonacci retracement at USD 28.94 is likely. A spike towards USD 30.09 also seems possible. If there is no significant profit-taking here, the UNI rate should target the 61 Fibonacci retracement at USD 32.70. If this resistance is also broken, the upper edge of the red resistance area at USD 34.95 will come into focus.
There is strong horizontal resistance here from March 2021. The bulls must therefore try to stabilize the UNI rate above USD 35.00 in order to attack the next target at USD 36.61. If the overall market continues to trend bullish in the coming months, Uniswap’s chances of a subsequent rise into the blue resistance zone will also increase. In the coming months, the UNI exchange rate could initially approach USD 41.12 and then attack the all-time high of USD 44.87. If the area of decentralized finances continues to be strong until the end of the year, a price increase up to the 138 Fibonacci extension at 57.10 cannot be ruled out. The maximum price target for the coming period is USD 64.56. The 161 Fibonacci extension runs at this price mark.
Bearish variant (uniswap)
However, should Uniswap bounce south at USD 30.09 at the latest and correct back below USD 23.10, a directional decision will be made at the orange support zone. This support cluster includes EMA200 (blue), EMA50 (orange) and EMA20 (red). The 23rd Fibonacci retracement also runs here. The bears will not be able to break the $ 20.51 area on the first attempt. Only if the overall market were to weaken again would a relapse become increasingly likely. A possible target price would be 19.33 USD. A horizontal support line and the supertrend in the daily chart run along this cross support.
If the bears manage to break through this price level dynamically, the green support zone between USD 17.34 and USD 15.88 will again come into focus. If there is no clear resistance from the bulls here either, the downward movement could gain further momentum. A retest of the history lows at USD 14.00 should be planned. If Uniswap falls to the lower edge of the light blue support zone and also undercuts the low of May 23 at USD 13.02, the corrective movement extends to USD 11.27 or even USD 9.11. The maximum bearish price target can be found at USD 7.54. As long as the crypto key currency Bitcoin does not break down to USD 20,000, this price level is purely hypothetical. Investors should use setbacks to $ 20.53 for new long entries.
Indicators (Uniswap)
The RSI as well as the MACD indicator still have a buy signal. If the buy side continues to be strong, the RSI in the weekly chart should also generate a fresh buy signal in the coming trading week.
Disclaimer: The price estimates presented on this page do not constitute buy or sell recommendations. They are only an assessment of the analyst.
The chart images were created using TradingView created.
USD / EUR exchange rate at the time of going to press: 0.85 euros.