
But where is Ethereum? The weeks follow each other and look alike for Ethereum (ETH). Since the end of January, it has been hovering in a price zone between support and key resistance. Its astonishing resilience in the face of the Russian-Ukrainian conflict does not seem to be the long-awaited catalyst to reverse the bearish trend since its last ATH in November 2021. The erratic price movements of ETH both up and down, contribute unfortunately to total uncertainty about the continuation of the current trend.
If caution remains in order with regard to the current context on the financial markets, the awakening of the prince of cryptos does not yet seem to be for tomorrow. Which would suggest a status quo for quite a while…to the point of dying of boredom?
This analysis of the Ethereum price is brought to you in collaboration with the Coin Trading and its algorithmic trading solution finally accessible to individuals.
Ethereum (ETH) Deep Inside Kumo in Weekly Units
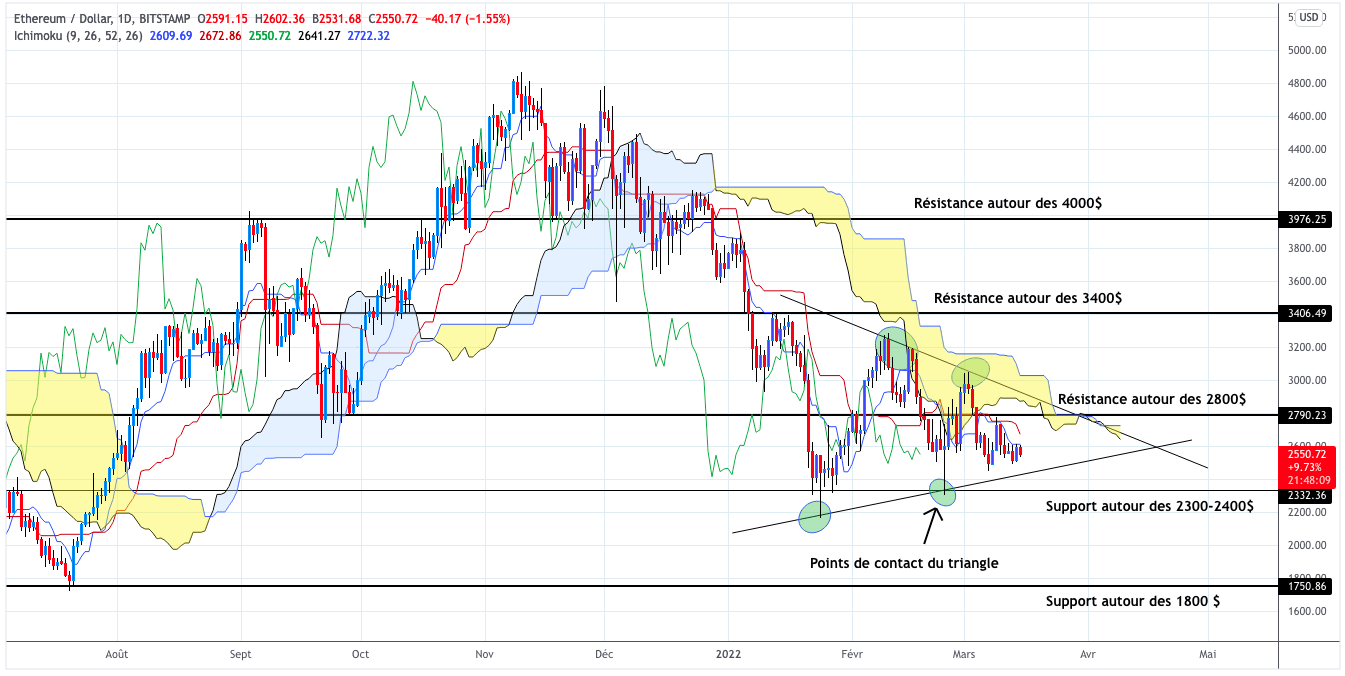
Ethereum is bogged down inside the Kumo (cloud) for the fourth week in a row. And maybe a fifth if this week’s candle turns out to be of the same ilk. It is clear that weekly closes end below resistance around $2800especially since the prices are quoted below the Tenkan and the Kijun.
That being said, the fall of almost 50% since its last ATH does not currently call into question the fundamental bullish cycle of the prince of cryptos since the low points of March 2020. It must be admitted that the favorable position of the Chikou Span, keystone of the Ichimoku, compared to the Kumo, contributes to remaining neutral. As long as it is not under the cloud like ETH prices, there is no reason to take a pessimistic view.
In order not to switch to the dark side in the weeks to come, Ethereum would benefit from preserving the support of $2300-2400, which itself is at the lower limit of the Kumo, the Senkou Span B (SSB). Its overflow would probably lead us back to support around $1800. Conversely, the resistance of $ 2800 would be in play. If this is crossed as soon as possible, Ethereum could attack heavy with the resistance of $ 3400, the Kijun which is located at a few cables from the first, and the upper limit of the Kumo, the Senkou Span A (SSA).
The noose is tightening in the short term
If its trend in weekly units invites us not to panic, it is another story in daily units. Compared to last week, I obscure the downtrend line since its last ATH giving way to a symmetrical triangle formed since last January 25th.
As a reminder, a symmetrical triangle is a continuation chart pattern. She sees the buying and selling force eroding as we get closer to the intersection of the two converging lines. Its exit is partly related to the previous trend. It must be performed at two thirds of the figure with at least 2 points of contact on each line and a third on one or the other for the final outcome.
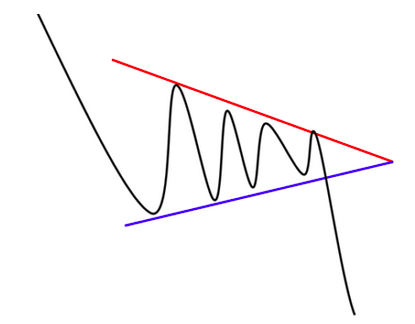
Regarding the prince of cryptos, it isa symmetric triangle of bottoms that comes after a downtrend. In two-thirds of cases, the exit ends with the breakout of the lower line. We see that the noose is tightening, but the conditions required for the validation of the figure are not completely fulfilled. It doesn’t mess up the precarious position of Ethereum and the Chikou Span compared to Kumo since the beginning of 2022.
In summary, the suspense of the moment around Ethereum will be to keep our eyes on the imminent exit from the triangle in daily units. At the time of writing, the trend over the past few weeks remains uncertain. There is no need to rush to take a position.
If we refer to what was mentioned before, logic would dictate that it breaks from below, in which case it would be a question of going down towards the support of $1800. This could look like a phase of capitulation among buyers.
If the exit of the triangle were to result in the breakout of the upper line (probability for a third of the cases), ETH would overcome Kumo and the resistance of $2800, but would have a lot to do with the resistance of $3400 , which would prove to be a major obstacle in weekly units.
Is it possible to be gwinner every time? Whether the Bitcoin price is in great shape, or going through turbulence, Coin Trading offers you to increase your chances of success. Indeed, Trading Du Coin allows individuals to access an algorithmic and 100% automated trading tool. A real trend mechanism, this tool has been designed to adapt to market reversals and position itself on the most dynamic crypto assets of the moment.