
Ethereum and altcoins are on the rise again? – Bitcoin continues to grow strongly, it attracts capital. At the moment, altcoins are keeping a low profile, but they could profit sooner or later. Also, the Shanghai hard fork will be deployed on April 12, enough to fuel a rise on Ethereum? At the moment, Ethereum is trying to break the resistance at $1,700 amid the banking crisis. What are the levels to watch closely on the Ethereum side? Is capital rotation possible? Let’s look at the clues left by the graphs!
This Ethereum price analysis is brought to you in collaboration with CryptoTrader and its algorithmic trading solution finally accessible to individuals.
Ethereum back on resistance at $1,700
Powerful rebound on Ethereum in 3 days
Last week, Ethereum (ETH) price closed below the latest low at $1,460. This was a bearish signal, but the move was totally swallowed three days later :
Despite the violent movement, the 9 and 18 moving averages remained bullish. The price recovered below $1,400and it is now at the level of the resistance at $1,700. From now on, it will be necessary to break the resistance by closing above $1,740. Also, it will be necessary to break the monthly resistance around $1,850. Concretely, the objective remains the same on a weekly basis: to close above the last peak at $2,030. A closure like this would make it possible to resume a weekly bullish momentum. Therefore, finding the price of Ethereum at $2,400and even $3,000 might be possible.
The course is located at resistors important and at the level of bearish trendline. This trendline must give way to avoid finding the price at the level of the bracket at $1,270. The RSI retains the bullish trendline, the trend may continue. It will be necessary to continue to show bottoms and rising tops on this indicator.
In the short term, Ethereum hangs at the resistance level at $1,720
Ethereum bounced back more than 25% from the medium to $1,400buyers always have their hands on the movement:
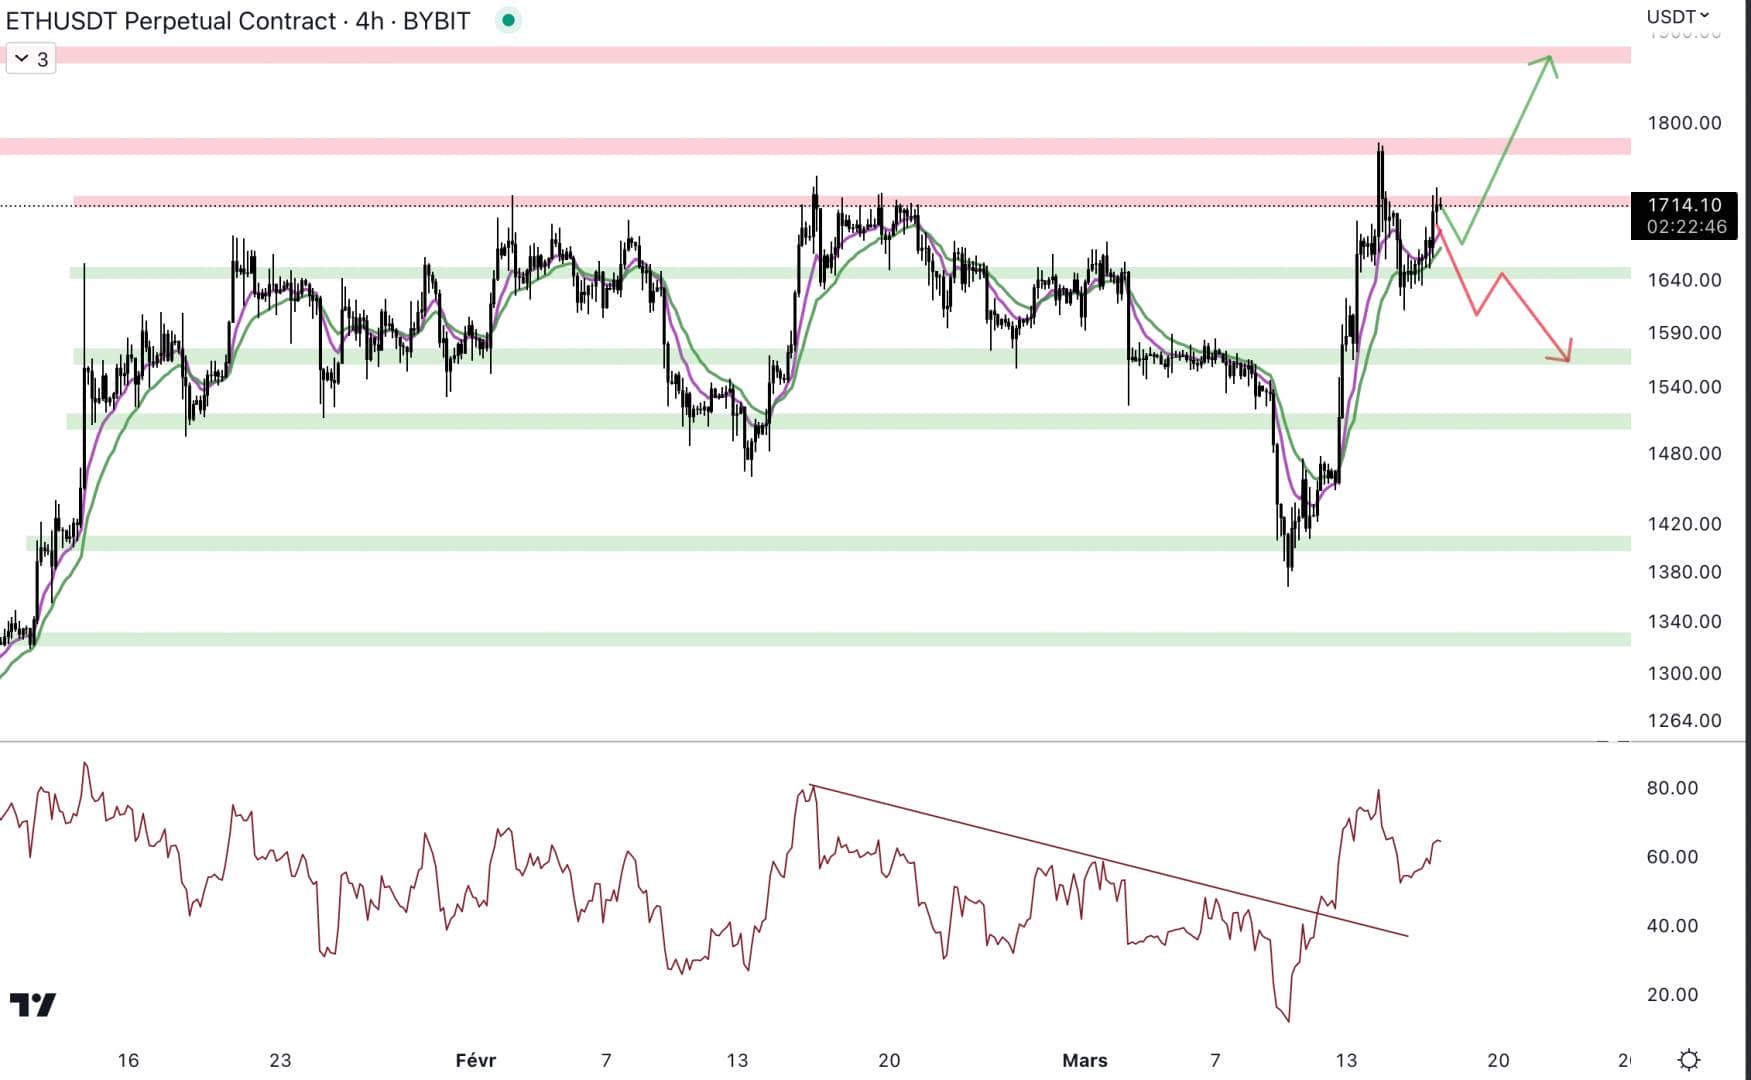
The institutional bias (EMA 9/EMA 18) is bullishhe recently served as dynamic support. Indeed, the price rebounded at the level of the moving averages located at the level of the 4H support at $1,650. Currently at the level of resistance at $1,720the buyers must push to regain the price at the level of the next resistances at $1,780then to $1,880. On the other hand, if the sellers show themselves at the level of the resistance at $1,720the price could return to the level of the bracket at $1,650. If the support breaks, the next level of support is at $1,570.
The RSI is above the bearish trendlineyou have to build momentum with bottoms and bottoms.
Could the ETH/BTC pair rebound?
The pair ETH/BTC falls, Bitcoin attracts capital. However, the course could bounce in the coming weeks :
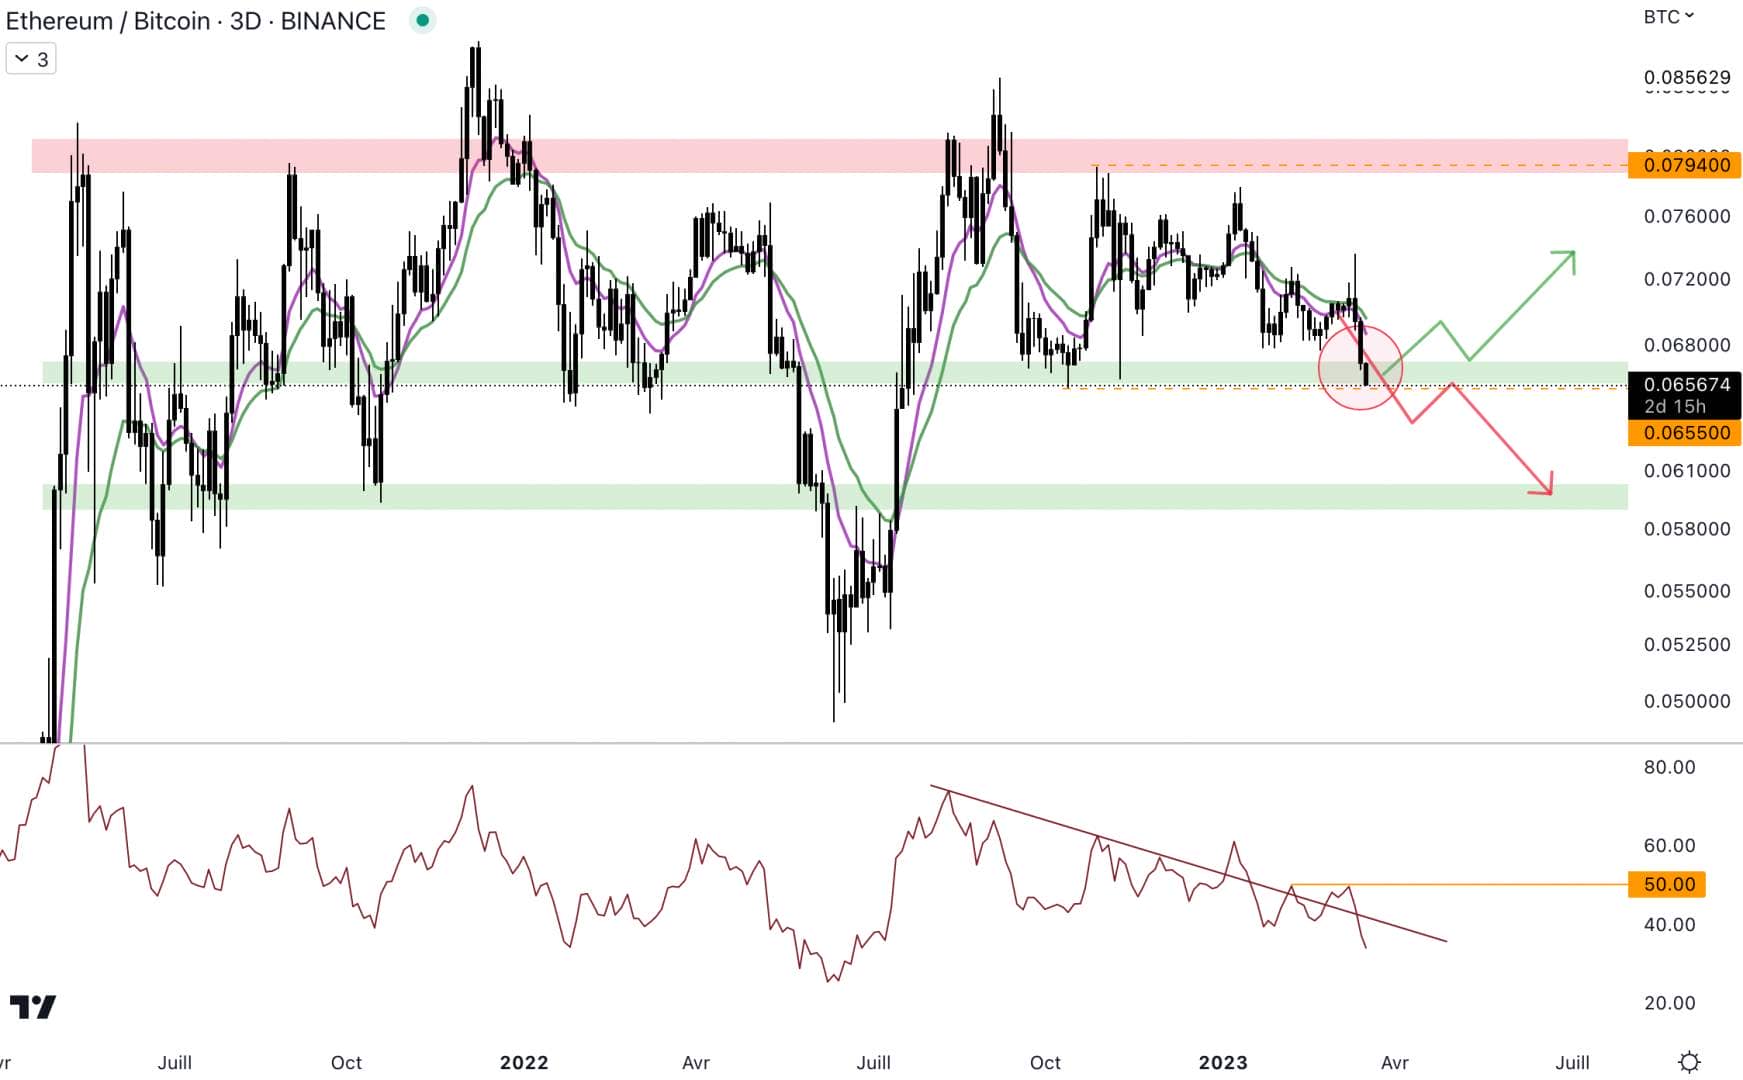
The price is in a weekly range between 0.06 and 0.08 BTC. Currently, the course is at the level of the intermediate range support at 0.066 BTC. A rebound could occur here, and bring the price back to the top of the range. On the other hand, if Bitcoin continues to attract capital, the pair could return to the level of the bottom of the range at 0.06 BTC. An exit from the top of the range would be extremely positive for altcoins.
The RSI does not confirm at this time. Indeed, it blocks at the level of the bearish trendline and can’t take a bullish momentum clear. Also, the RSI blocks at the level of 50 of RSI. It will be necessary to find bottoms and rising tops on this indicator to be bullish on the pair.
Bitcoin dominance is on the rise
This strong upward movement allowed the dominance of Bitcoin to bounce strongly. Capital is currently heading towards the king of cryptocurrencies. However, this is not bad news, because capital is circulating, and altcoins could benefit sooner or later. The course continues to bounce at the level of moving averages 9 and 18:

The course broke the 44% resistanceit closed above the latest highs at 44.5% And 44.8%. The dominance of Bitcoin is very close to the 47% resistance. A turnover in capital could intervene at this level. Therefore, it might be interesting to look strongest altcoins. If the price breaks the resistance, capital would continue to flow into Bitcoin, and that would not be great news for altcoins. At the moment, the price is near the top of the monthly range, a pause could be marked, and the altcoins could benefit from it.
The RSI bounced off the level of the bullish trendline, the trend is maintained. The momentum could start to draw differences, we will have to be attentive to the evolution of the RSI in the coming weeks. If so, it will showshortness of breath.
Altcoin capitalization could return to the resistance level at $670 billion?
The capitalization of altcoins is in the process of bounce. The price rebounded exactly at the level of the bearish trendline :
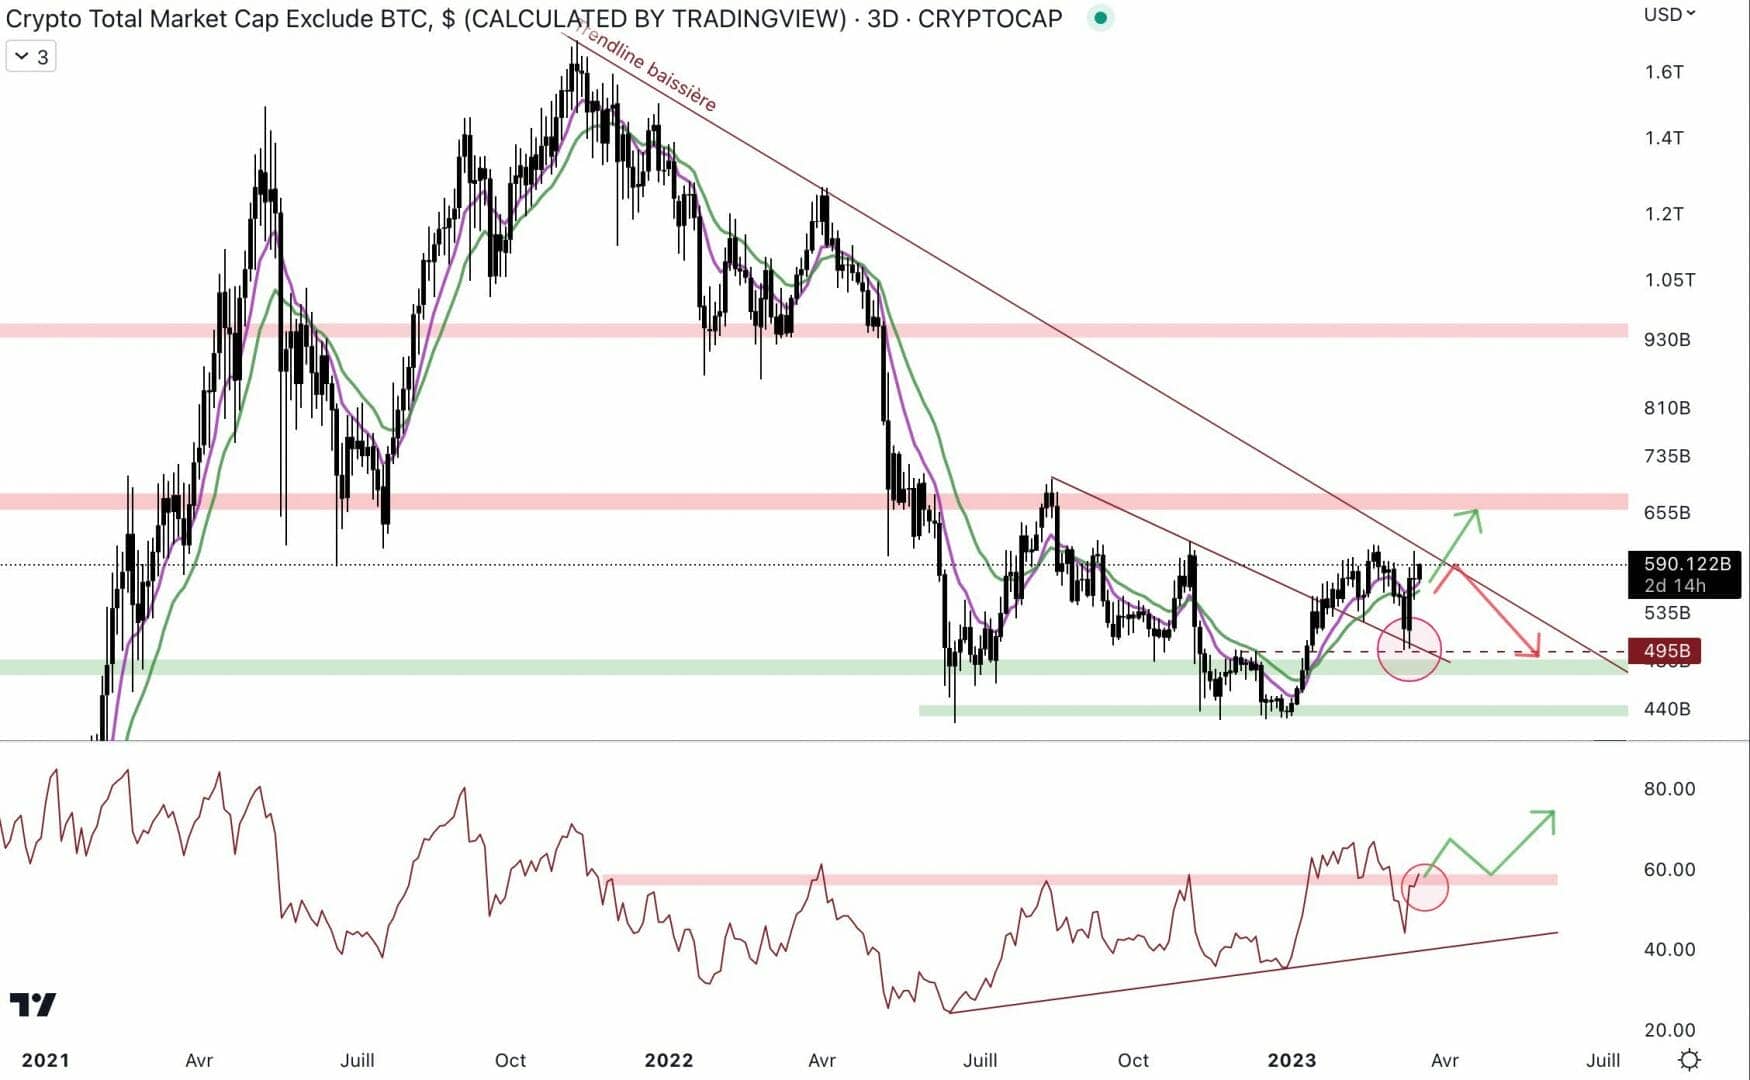
Thanks to this bouncethe price could find the resistance at $670 billion. You will have to break the bearish trendline and the resistance at $670 billion to find colors on altcoins. Indeed, a fence above 700 billion dollars would find a bullish momentum weekly. Attention, in case of rejection, the price could move towards the weekly support located at $480 billion.
The RSI is again at the resistance level around 57. It will be necessary to break this level of resistance definitively to relaunch the bullish momentum. The RSI has been showing upward lows and highs since June 2022, the trend may well continue.
In the end, Ethereum needs to break the resistance at $1,700. If the buyers are finally able to bring down the sellers, the price could go back to the level of the last peak at $2,030. It will be necessary to break this level on a weekly basis to regain a bullish momentum. In the short term, the price must break the resistance at $1,720. At the moment, Bitcoin attracts capital. As we can see, the ETH/BTC pair is falling, and the dominance of Bitcoin is increasing. The dominance of BTC is close to an important monthly resistance at 47%, a rejection could occur at this level. Thus, altcoins could benefit from capital turnover. On the other hand, the capitalization of altcoins could return to the resistance level at $670 billion.
Do you want to delegate the trading of some of your cryptocurrencies? Through his optimized trading serviceCryptoTrader allows you to maximize your profits in a simple, diversified, and fully automated way.