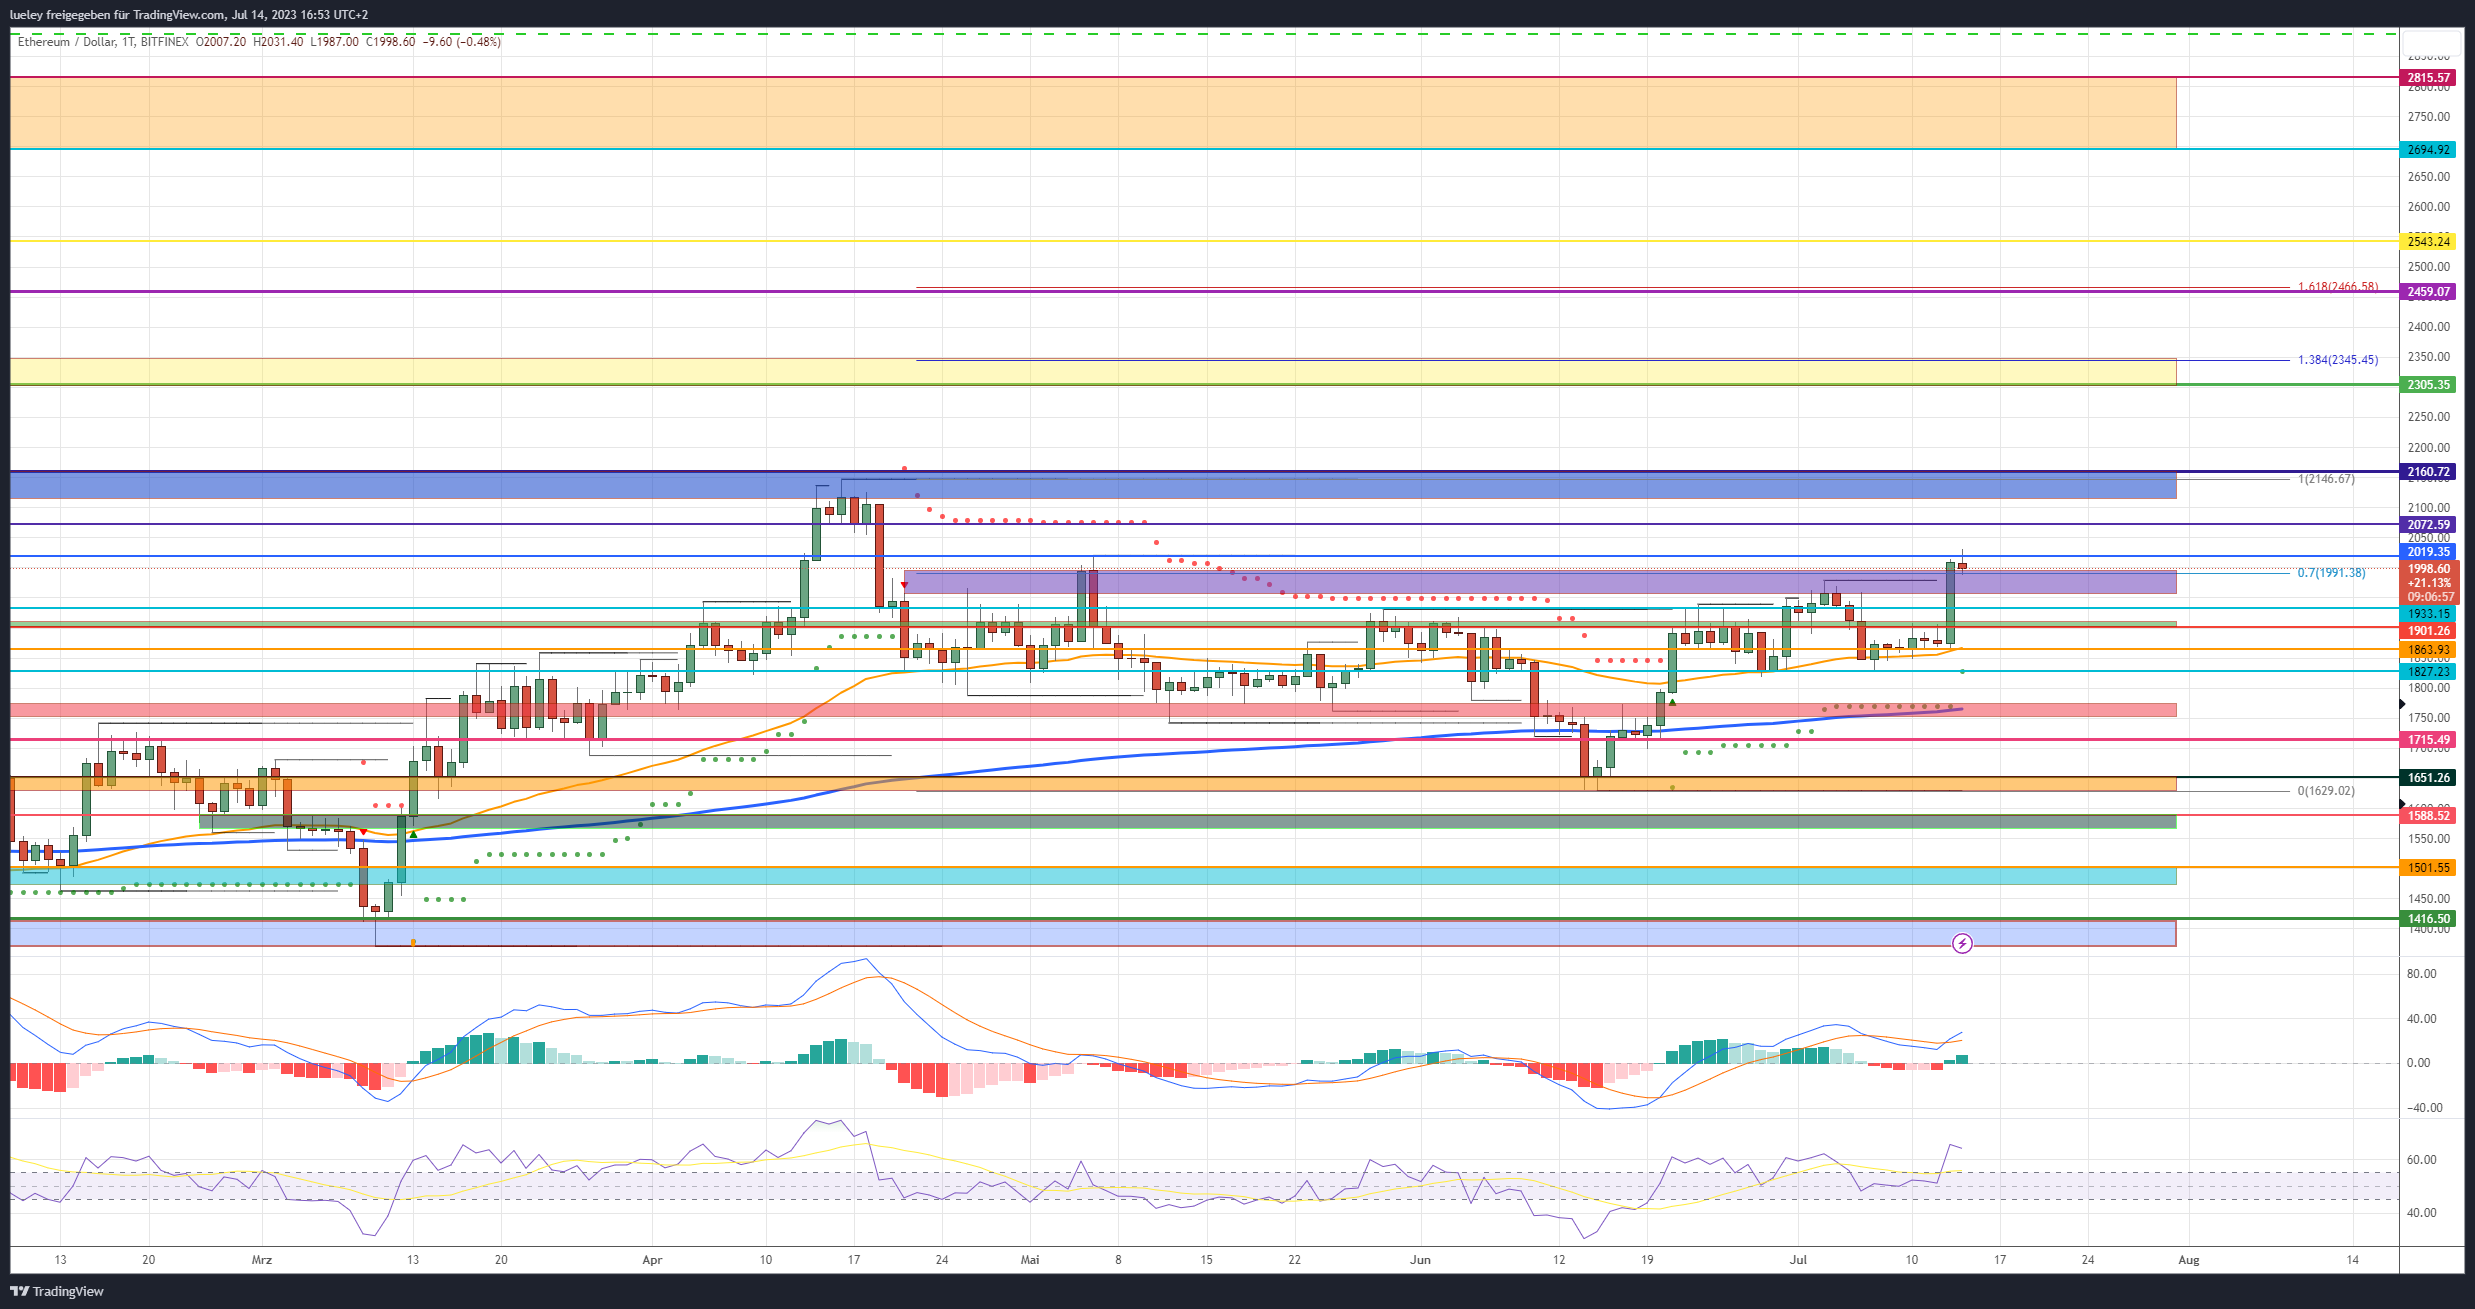
In the course of the remarkable price increases of many altcoins as a result of the positive court ruling for Ripple (XRP), the second largest cryptocurrency Ethereum (ETH) also gained almost 8 percentage points in value. The ether price rose to a peak of 2,031 US dollars, reaching a new multi-month high. The expansion of the price consolidation in the last few weeks of trading could thus be stopped early. As mentioned in the last price analysis, the buyer side was there in good time and successfully prevented an imminent fall back below the cross-support from EMA 50 (orange) and horizontal support at 1,853 US dollars. The fact that there was recently a larger amount of ether coins in staking than available on crypto exchanges also underlines the interest in the crypto currency Ethereum.
Now it is important for the bulls to keep up the buying pressure in order not to allow a drop below $1,933 at the daily close. Optimally, the profit-taking-related price consolidation of the last few hours of trading ends within the purple support zone. If the buyer side then succeeds in stabilizing the price above USD 2,019, the next relevant resist at USD 2,076 and thus the area around the annual high will become the focus of investors.
Bullish price targets for the coming trading weeks
Bullish price targets: $2,019, $2,072, 2,115/2,160 $2,305/$2,346 2,459 USD, 2,543 USD, 2,694/2,815 USD
The Ethereum bulls were able to turn things around in time and remain on the trigger. If the ether price now stabilizes above USD 1,995 and then overcomes the last high at USD 2,019, the upward movement will expand towards USD 2,072. If Ethereum also breaks through this cross-resistance of horizontal resist and 50 Fibonacci retracement, the blue resistance zone around the high for the year comes into the focus of investors.
Between US$ 2,115 and US$ 2,160 there is a preliminary decision for the coming time. If the ether course gets stuck here and can leave this area behind in the future, there is fresh upside potential in the direction of the medium-term target zone between US$ 2,305 and US$ 2,348. The trailing edge of the subsequent sell-off from May 2022 located here acts as the next area of strong resistance. If the ether price can then form a floor around US$ 2,150 despite profit-taking and then break out northwards above the US$ 2,346 mark, a march towards US$ 2,459 should be planned. In addition to the resist from May of the previous year, the 161 Fibonacci projection of the current upward movement is also running nearby.
If the crypto sector continues to show its bullish side in the coming period and the Bitcoin price breaks out above the technical bulwark between US$ 32,400 and US$ 32,900, Ethereum could also gain further ground. Above $2,459, ether price is likely to rally higher towards the major $2,694-$2,815 target area with a stop at $2,543.
Bearish price targets for the coming trading weeks
Bearish price targets: $1,957, $1,933, $1,901, 1,864 USD, 1,827 USD, 1.774/1751 USD, 1,715 USD, 1.651/1,629 USD, USD 1,588, USD 1,501/USD 1,474, 1,416/1,371 USD
The bears were able to avert a sustained breakout above the last historical high at $2,019 for the time being, but they must now initiate a sell-off back below the support at $1,957. However, even if Ethereum also falls below $1,933, the next support level is already waiting at $1,901. The buyer side is already likely to want to counteract this. There is only a real chance of an extension of the correction if the EMA50 (orange) breaks in the area of yesterday’s daily low of 1,864 US dollars. If the sell-side succeeds in selling below that, a short-term directional decision will be made at $1,827.
In addition to the supertrend, there is a striking horizontal support level here, which recently could not be undercut several times. A abandonment of this support would have a signal effect and should immediately cause the ether price to fall in the direction of the red zone. This area continues to represent an important make-or-break area on the underside. This zone has been of high relevance several times in recent months. In addition, the weighted moving average of the last 200 days (EMA200) (blue) runs here.
The cops will have to be there to keep the scepter in their hands. If, contrary to expectations, the bears manage to undercut this area as well, the probability of a sell-off to the old breakout level at US$ 1,715 increases significantly. A task of $ 1,715 would increasingly cloud the chart picture. A price slide into the orange support area must then be planned for. Ethereum could form a double bottom between $1,651 and $1,629. For now, this chart area represents the maximum bearish price target for the coming trading weeks.
Ethereum: A look at the indicators
On a daily basis, the RSI generated a fresh buy-signal with yesterday’s rise. With a value of 62 there is also room for a further price increase in the coming days. The MACD indicator was also able to activate a new long signal above the 0 line and supports the bullish view. The same applies to the weekly chart. Both indicators have formed new buy signals here and offer room for further price gains in the coming weeks.
Disclaimer: The price estimates presented on this page do not represent buy or sell recommendations. They are merely an assessment by the analyst.
The chart images were created using TradingView created.
USD/EUR exchange rate at the time of going to press: EUR 0.89.
The latest issues of BTC-ECHO Magazine
You might also be interested in this