Ripple is currently in the fast lane. In the last 24 hours of trading, the XRP price has jumped 12 percent north. Ripple is currently benefiting from several positive news. In addition to the increased chances of classification as a commodity by the Commodity Futures Trade Commission (CFTC), statements by the renowned crypto lawyer John E. Deaton, according to which the long-standing process of the Securities and Exchange Commission (SEC) against Ripple could soon be concluded , for increased interest in XRP. The price of Ripple (XRP) subsequently recovered significantly and was able to dynamically overcome the multiple resistance of the moving average line (EMA200) (blue), the overarching downtrend line and the supertrend in the $0.40 area. In the last 8 trading days, the XRP price rose by 45 percentage points to $0.58 at its peak. Ripple thus marked a new high for the year and was able to temporarily overcome the high from September 2022 on Wednesday morning before the first profit-taking began.
Ripple: Bullish price targets for the next few weeks
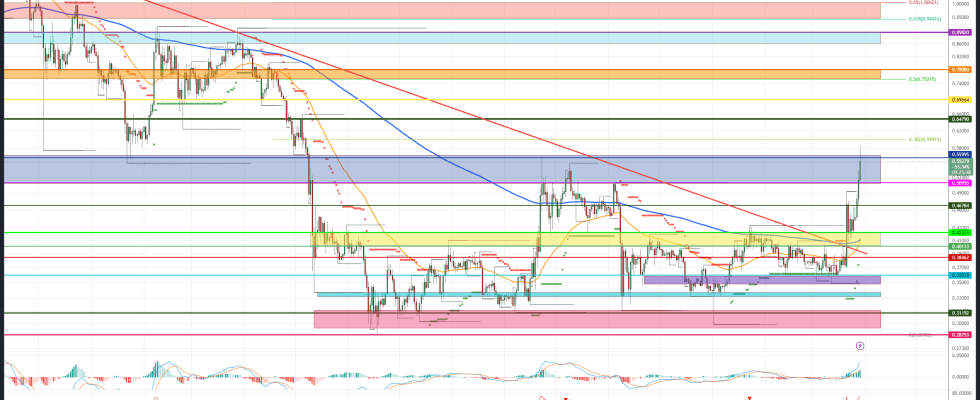
Bullish price targets: 0.56 US$, US$0.65, US$0.69, 0.75/0.78 USD, 0.86/0.89 USD, $0.94/$1.00
Ripple is about to make its first important directional decision. As already discussed in the last price analysis, when the bulls reach the first important price target in the area of the fall 2022 highs, they have to generate enough purchasing power to dynamically overcome the strong resistance at $0.56.
In the short term, Ripple must now stabilize in the $0.50 area. Then it is a matter of recapturing the blue resistance zone in the long term. If the bulls succeed in this breakout, the higher-level 38 Fibonacci retracement at $0.60 will come into focus as a stopover on the way towards $0.65.
Breaking through this price level would unleash further upside potential towards $0.69. That would put the next key price target area between $0.75 and $0.78 within reach. Here is the parent 50 Fibonacci retracement of the full move down from the April 2021 high.
If the buyer side succeeds in breaking through this resist zone, the XRP price should march towards the highs of the previous year by 0.89 US dollars. If Ripple achieves this medium-term price target, investors will do everything they can to start at the maximum target range between US$ 0.94 and US$ 1.00 that can be derived from the chart. This zone is derived from the golden pocket of the overall trend movement.
Ripple: Bearish price targets for the next few weeks
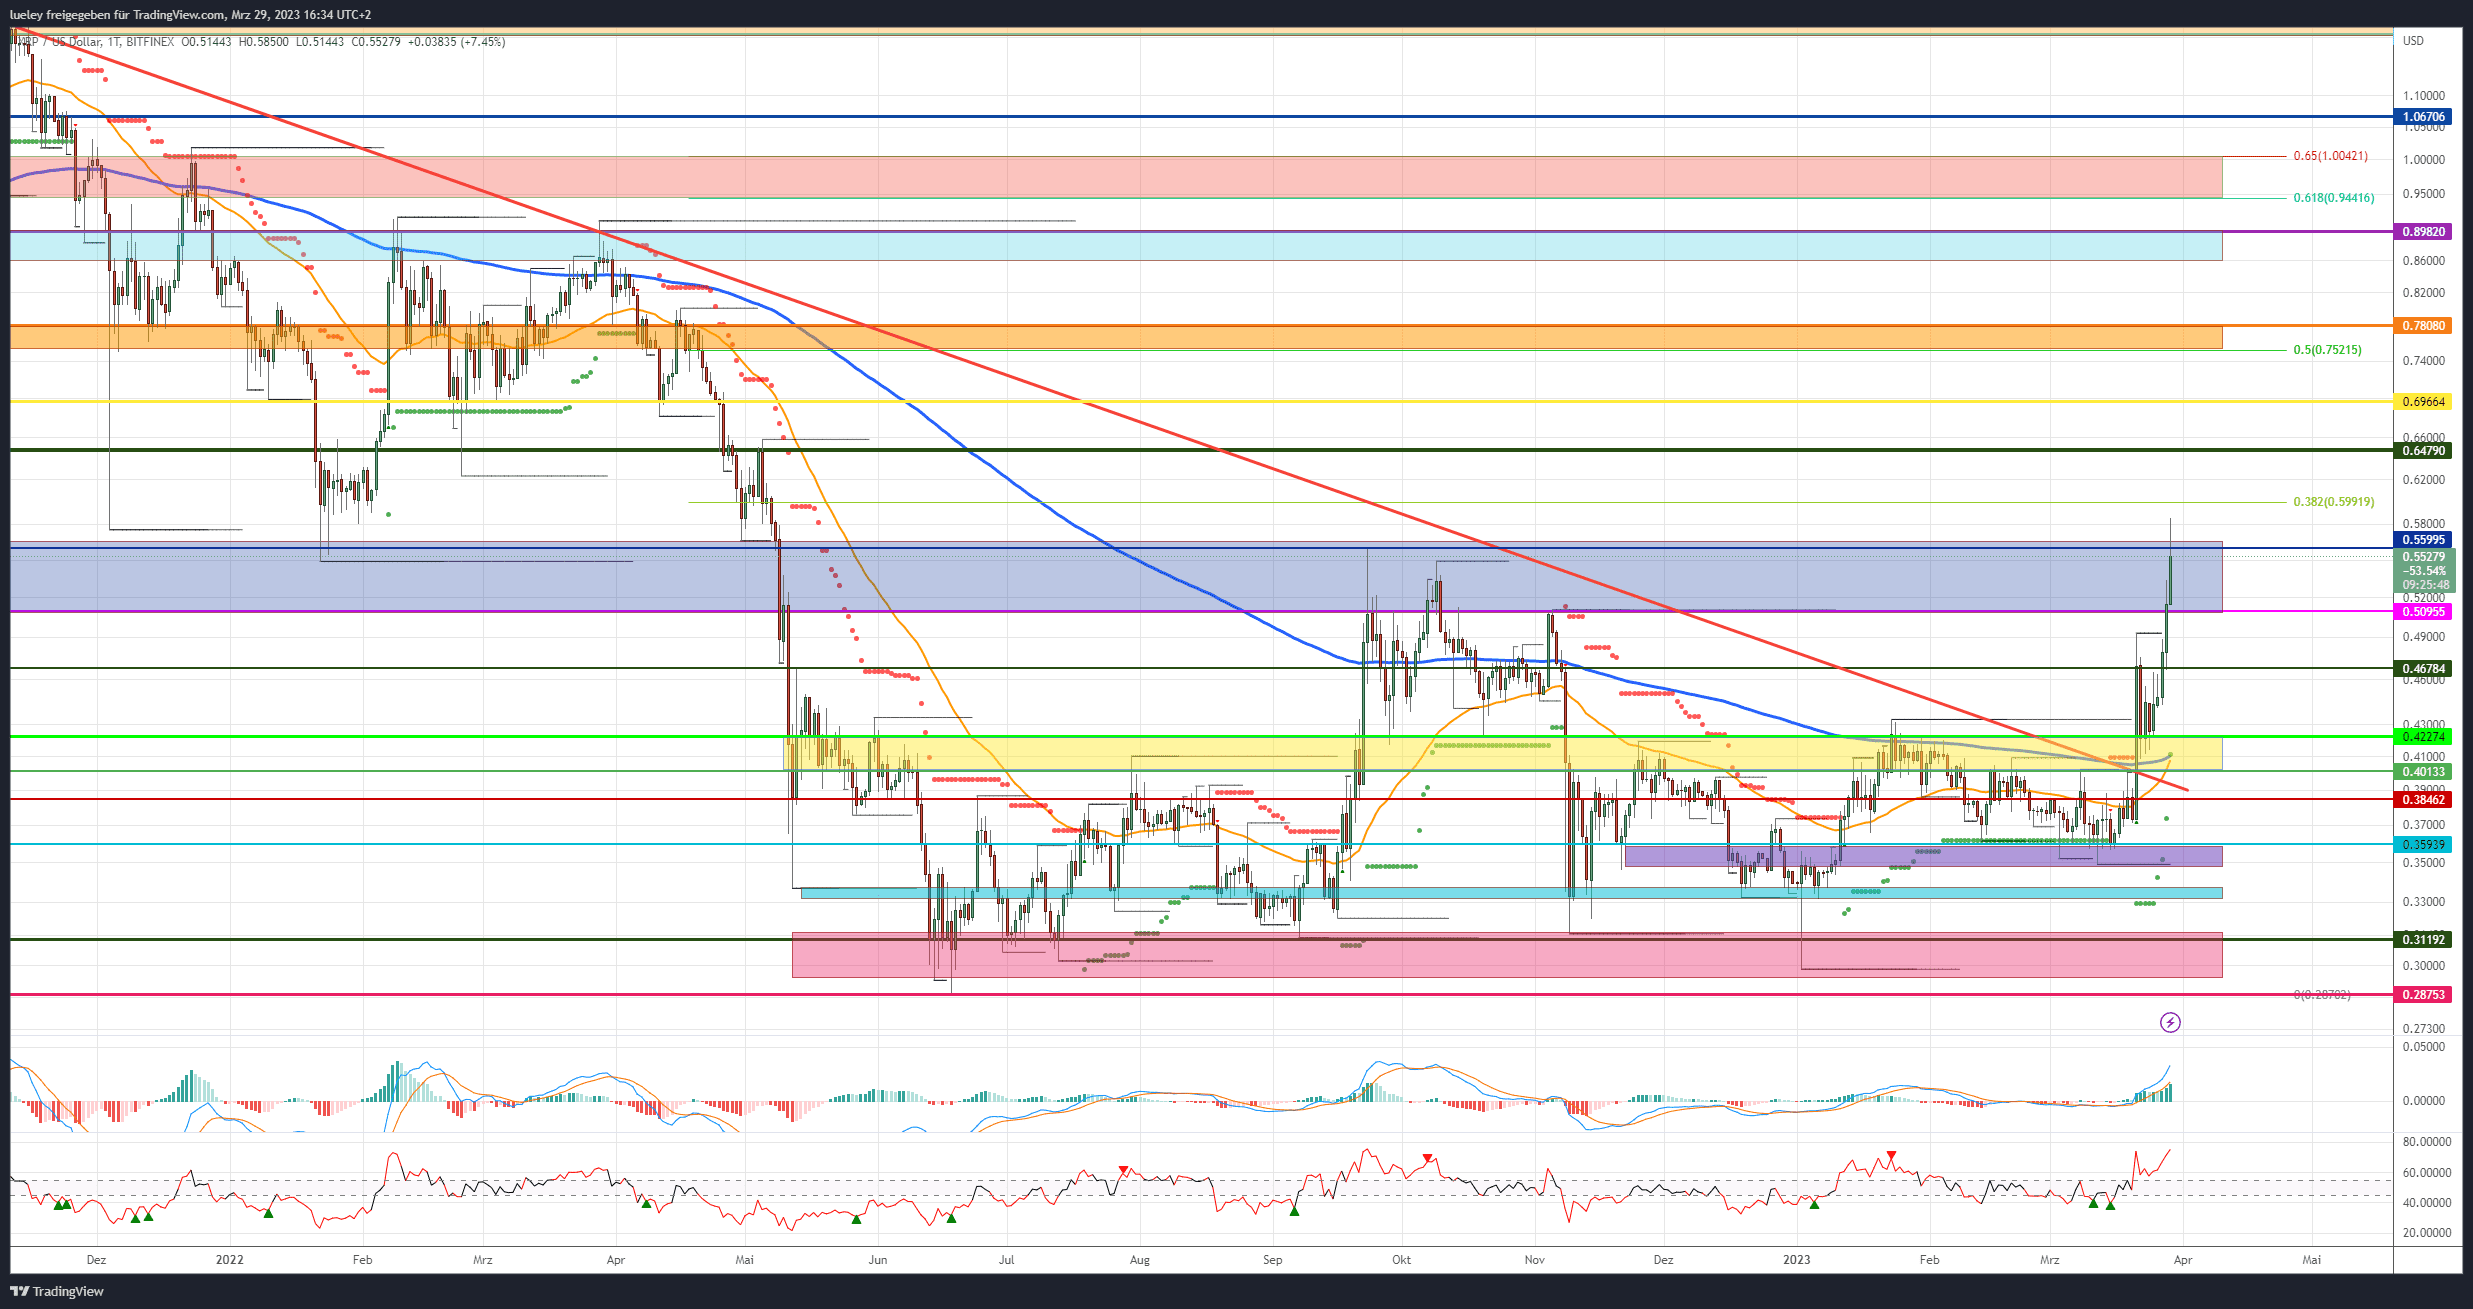
Bearish price targets: $0.51, $0.46/0.47, $0.42/0.40$0.38, $0.36, $0.33, 0.31/0.29 USD
Since breaking out of the $0.38 – $0.40 strong resistance area, the bears have been in retreat. The XRP course then rose massively to the north. Now the task is to cap Ripple in the blue zone and push it back below the support at $0.51. But that’s not all. A retest of the yellow support zone should only be planned if the support at 0.46 US dollars is also sustainably undercut.
This is where it is decided whether the XRP price has only sparked a temporary price spectacle, or whether the buyer side is staying on the trigger. If the XRP price slips back below this zone and thus abandons the EMA200 and the EMA50 (orange) again, the correction will extend to at least $0.38.
If the bulls remain abstinent, Ripple could then fall back into the purple support zone. Stabilization must set in here in order to avert a sell-off back towards the lows for the year. A break below $0.33 would take Ripple into the key 12-month support range of $0.31 to $0.29.
Looking at the indicators
In the daily chart, the two indicators RSI and MACD show a buy signal. However, the RSI appears increasingly overbought at the 75 level. A short-term sideways movement to cool the RSI indicator would only be healthy in perspective. The MACD, on the other hand, still has room to rise and also underpins the bullish scenario. Also on the weekly chart, the RSI has now breached the neutral zone between 45 and 55 and generated a buy-signal. In addition, the MACD is about to break through the 0 line above. This would also generate a new buying impulse here.
Disclaimer: The price estimates presented on this page do not represent buy or sell recommendations. They are merely an assessment by the analyst.
The chart images were created using TradingView created.
USD/EUR exchange rate at the time of going to press: EUR 0.92.
Do you want to buy cryptocurrencies?
Trade the most popular cryptocurrencies like Bitcoin and Ethereum on eToro, the world’s leading social trading platform. (81% of CFD retail investors lose money with the provider).
The latest issues of BTC-ECHO Magazine
You might also be interested in this