
– An unstable balance – Bitcoin fell below the symbolic price of $40,000 yesterday and altcoins are struggling to break away from the king of cryptocurrencies. By managing to extricate itself from the resistance at $45,000, Bitcoin could have taken the opportunity to attack $50,000, but this is not the case. The period is complicated and cryptocurrencies seem to be following well what American equities are doing. It’s already the tenth edition of Point Macro Hebdo and it’s only the beginning! Let’s see together technically where the risky assets and the safe haven assets are.
Bitcoin: it does not pass
Bitcoin is highly correlated to equities, it also signs a – sad – record with NASDAQ:
Since the year 2020, it is without appeal. the Bitcoin is highly correlated to NASDAQ and that doesn’t seem to be changing. If this correlation is to last, we will have to wait for stocks to become bullish again to see a Bitcoin perform again.
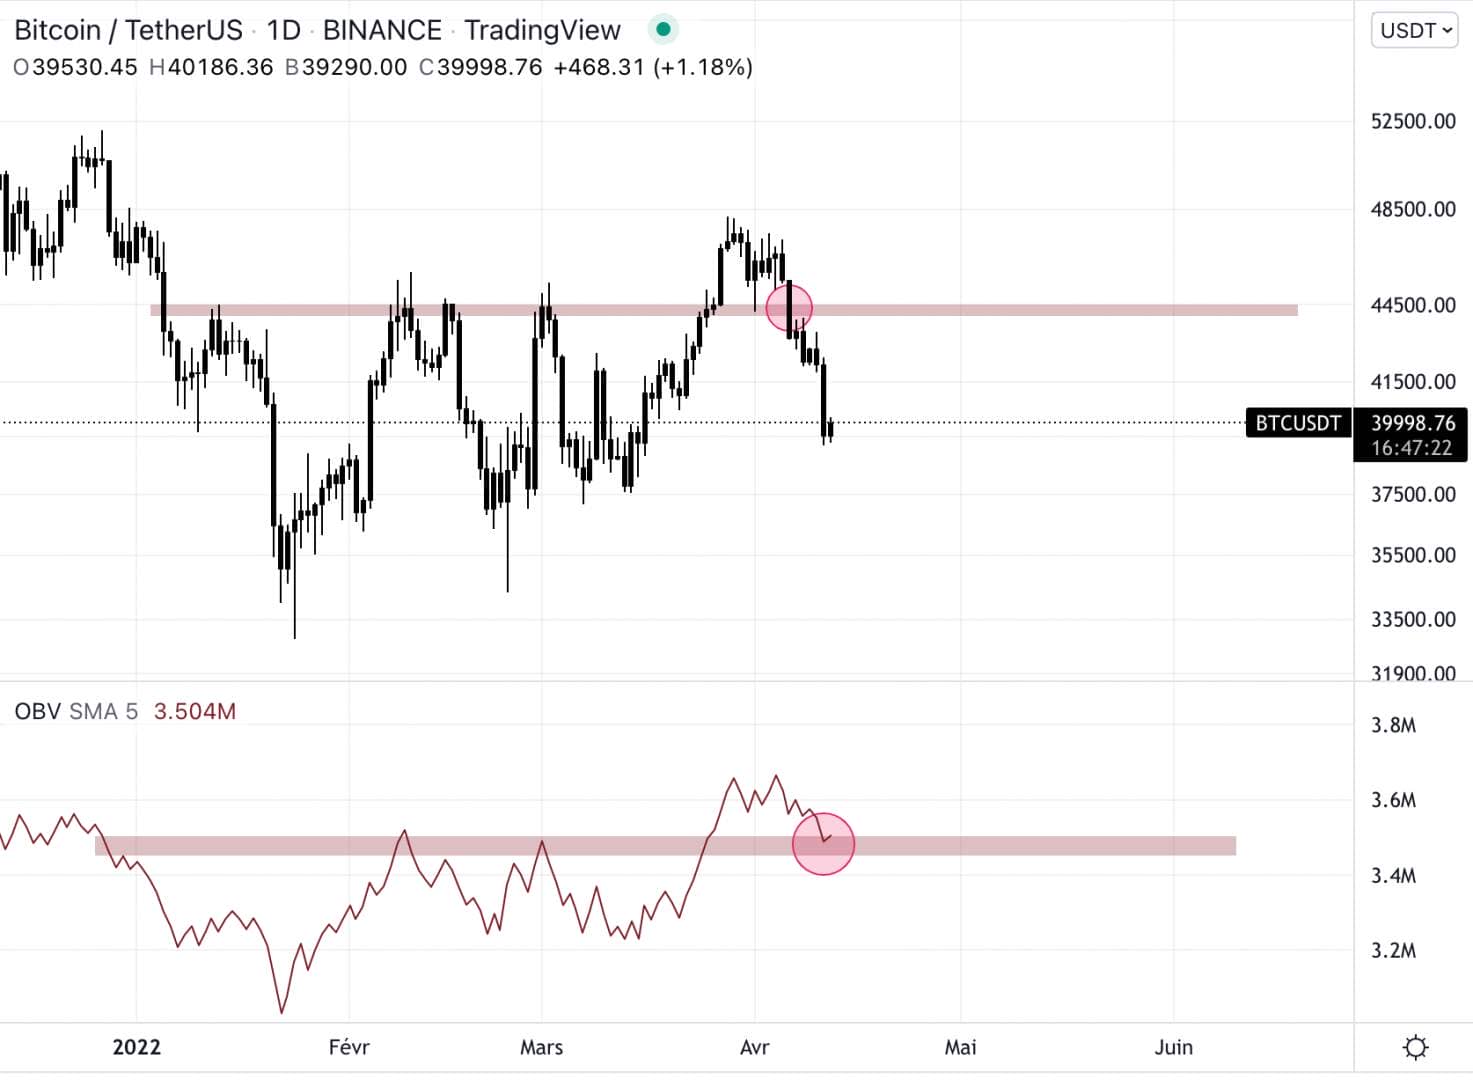
Bitcoin did not bounce off the supposed support at $45,000. The OBV (On Balance Volume) is a well-known volume indicator. It makes it possible to highlight volume discrepancies and proves to be efficient. OBV does not validate return under $45,000 and show a bullish divergence at the volume level.
In the past, the OBV had correctly shown bearish divergences in May and November 2021. The price had slightly exceeded the all-time high before falling. We must take this information into consideration while remaining vigilant. It would appear that some market players are in the process ofaccumulate.
Whatever happens, Bitcoin will have to show that it is able to extricate itself definitively from this zone to find a healthy trend. For the time being, it remains too correlated to equities which are struggling to find buying momentum in this complicated period.
>>This analysis is offered in collaboration with Trading du Coin and its algorithmic trading solution finally accessible to individuals<<
Risk offs are doing well
The dollar index has chosen its direction
The dollar index had been stuck in a range for a few weeks, he chose to come out on top:
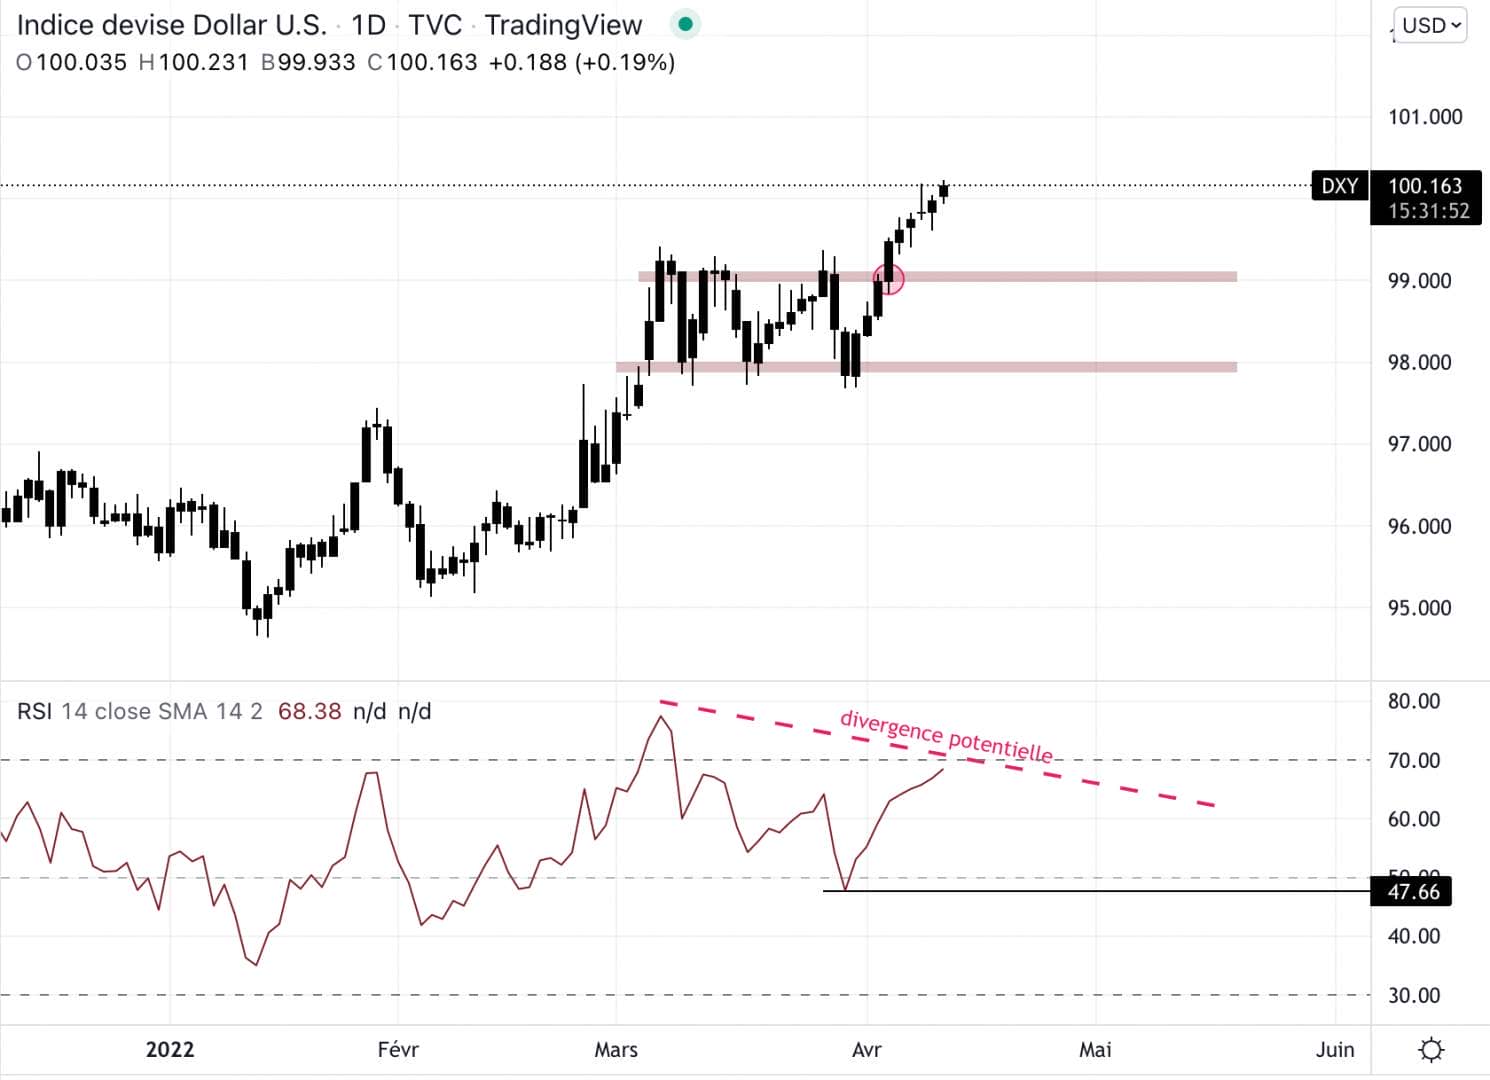
The momentum indicated consolidation, the dollar index did for a few weeks. The dollar index has come out of its range and seems continue to rise. The trend is therefore bullish until proven otherwise.
It looks like the DXY is forming a divergence. It is only potential for the moment, it will have to be confirmed by breaking 47.66 of RSI. This divergence should be established for risky assets. A weak dollar allows risky assets to express themselves fully.
Gold close to rising again
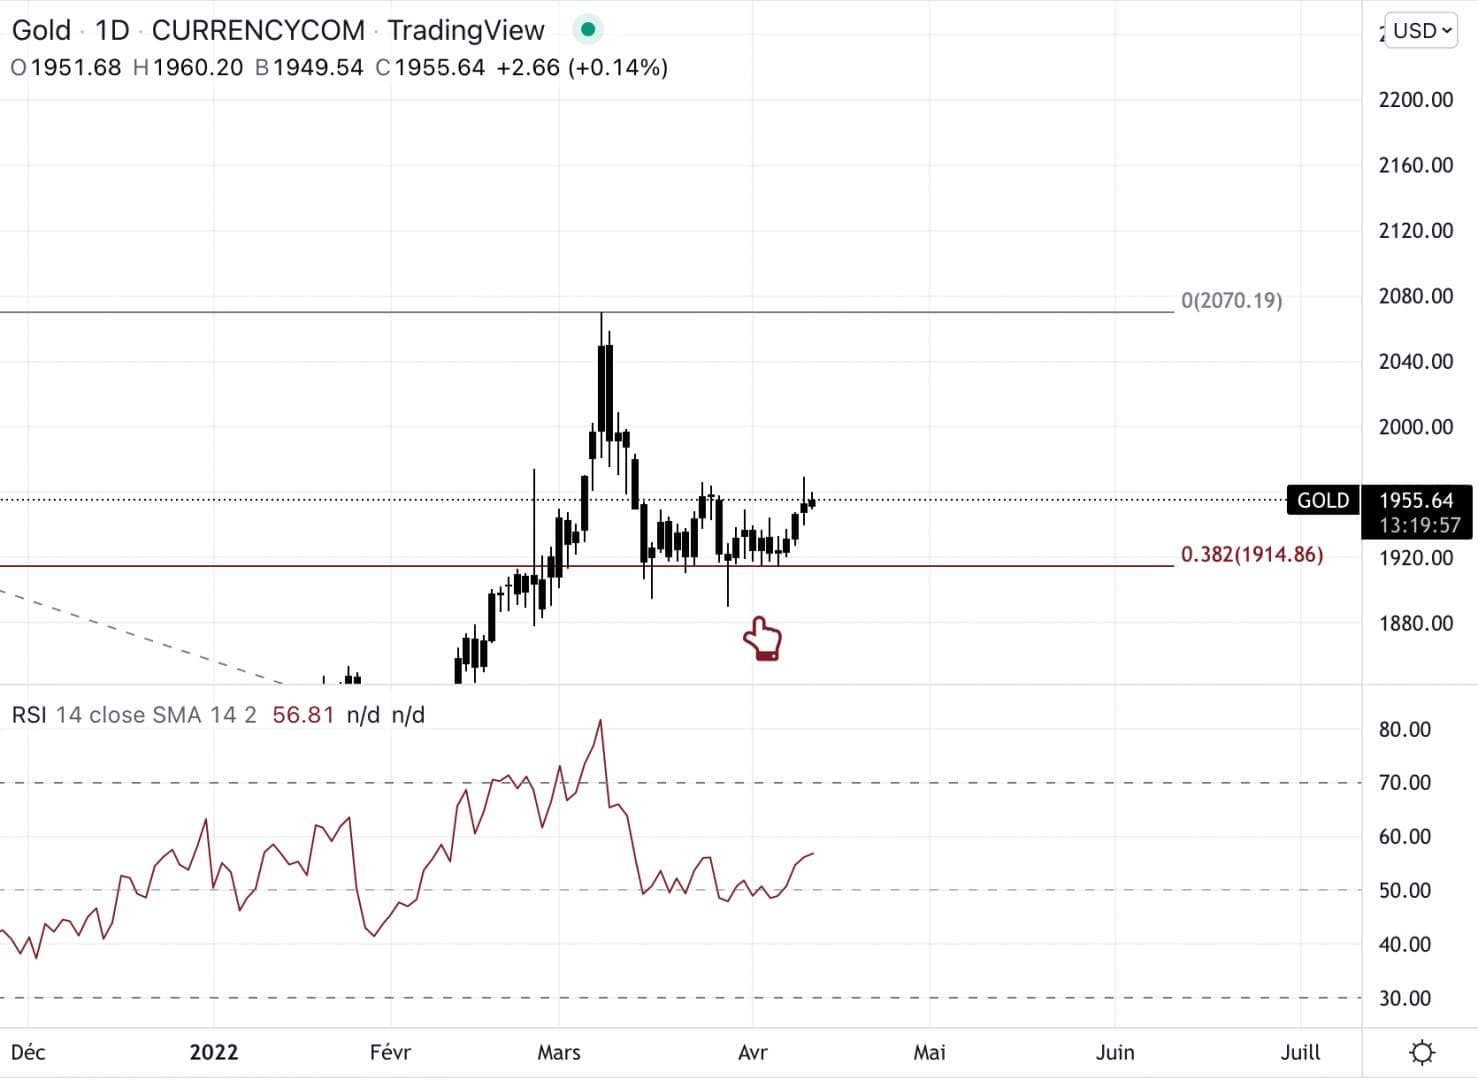
Gold is in the process of maintain the first stop (0.382 fibonacci retracement) of its movement initiated in August 2021. If it manages to exceed and close above its all-time high, we should quickly find it at $2,285 (movement AB=CD).
Gold and dollar index are graphically interesting. It seems that risk offs are favored by market participants at the moment.
US stocks must confirm!
Nasdaq freezes on first stop
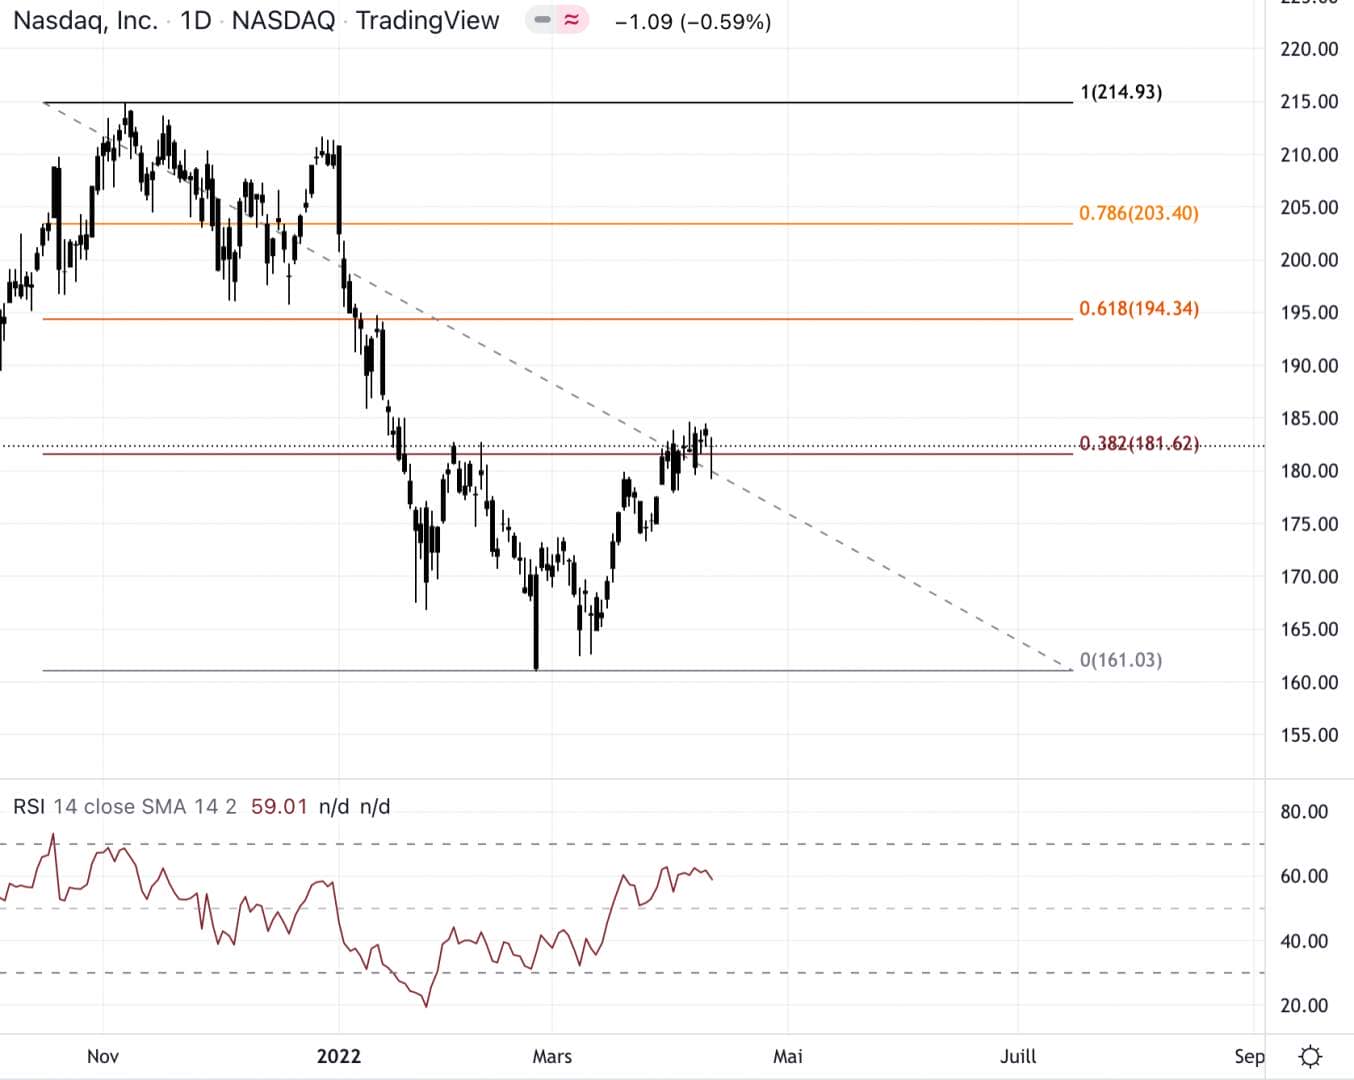
Like last week, the NASDAQ is stuck at the first stop. It looks like he needs to regain his strength before attempting a breakthrough. In a downtrend, an asset can be stuck at this level before continuing its decline. It is clear that we must remain vigilant with this asset. If he fails to hold the media to $165the asset could continue falling towards the next support at $136.
This asset must absolutely hold his support to $165 and break the first stop at $182. As we saw above, Bitcoin is highly correlated to NASDAQ. He would have to show some strength for Bitcoin to be able to express itself again.
Coinbase needs to bounce back now!
Coinbase has been really struggling to perform for the past few months. It is an action related to cryptocurrencies. The action must resume to show that the institutional players are interested in cryptocurrency.
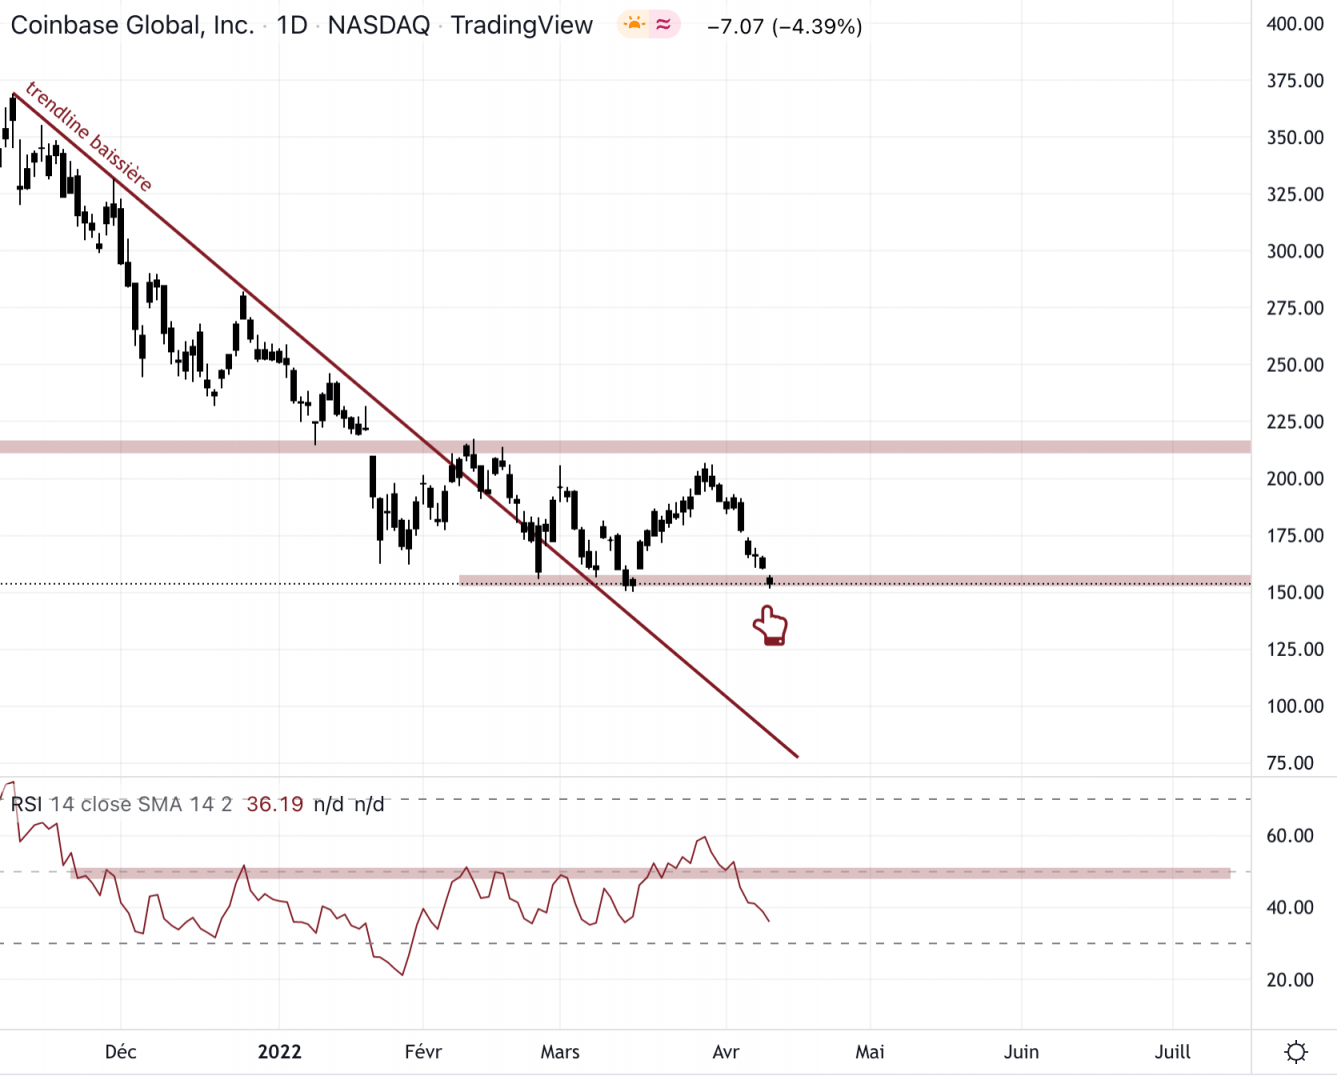
Coinbase stock may be building a tidy between his resistance to $213 and the potential support to $150. For the moment, the asset is on the other side of the bearish trendline without managing to resume a bullish momentum. For that, it will be necessary to break its resistance to $213.
RSI momentum blocked at the zone of neutrality (50 from RSI). The action needs to take over this area and stay above it to confirm a healthy momentum. For the moment this is not the case. Coinbase is still very weak.
Tesla has the possibility of maintaining its bullish trend on a daily basis
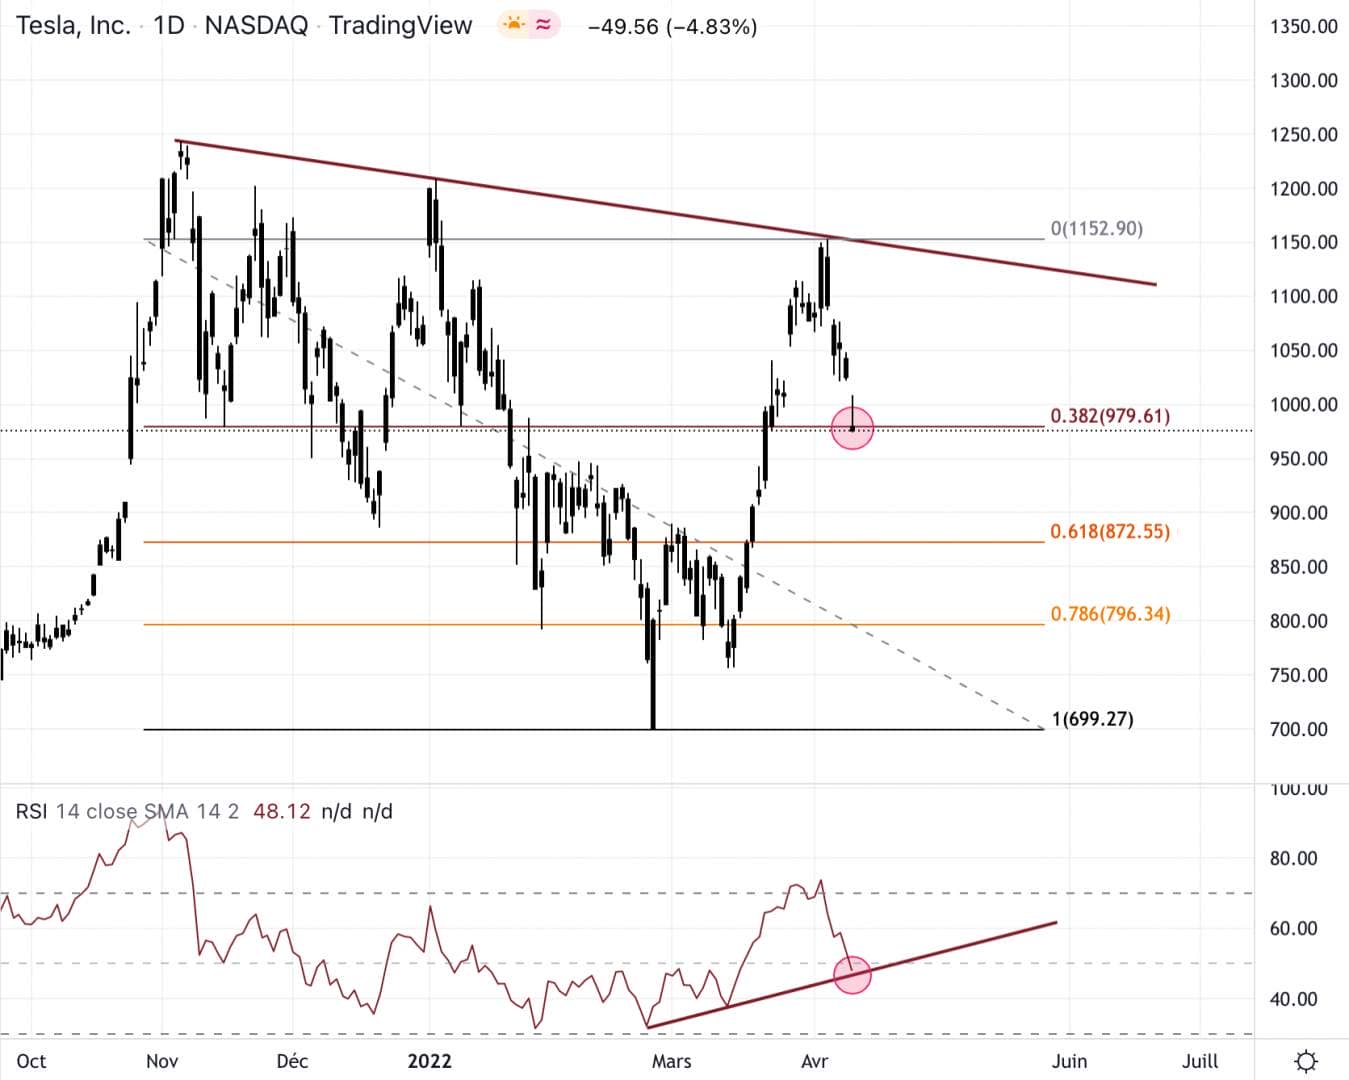
Tesla is encouraging. Elon Musk’s US stock is on the first stop of its movement initiated in February 2022. The price has been to reject at the bearish trendline in brown on the chart.
An asset must hold the first stop to hope to see a new high. the momentum is bullish and the zone of neutrality must be kept as support.
If the first stop is not maintained, there is a high probability of finding Tesla between $870 and $796. Tesla remains solid for the moment and it would have to confirm.
The S&P 500 close to an attractive zone for buyers
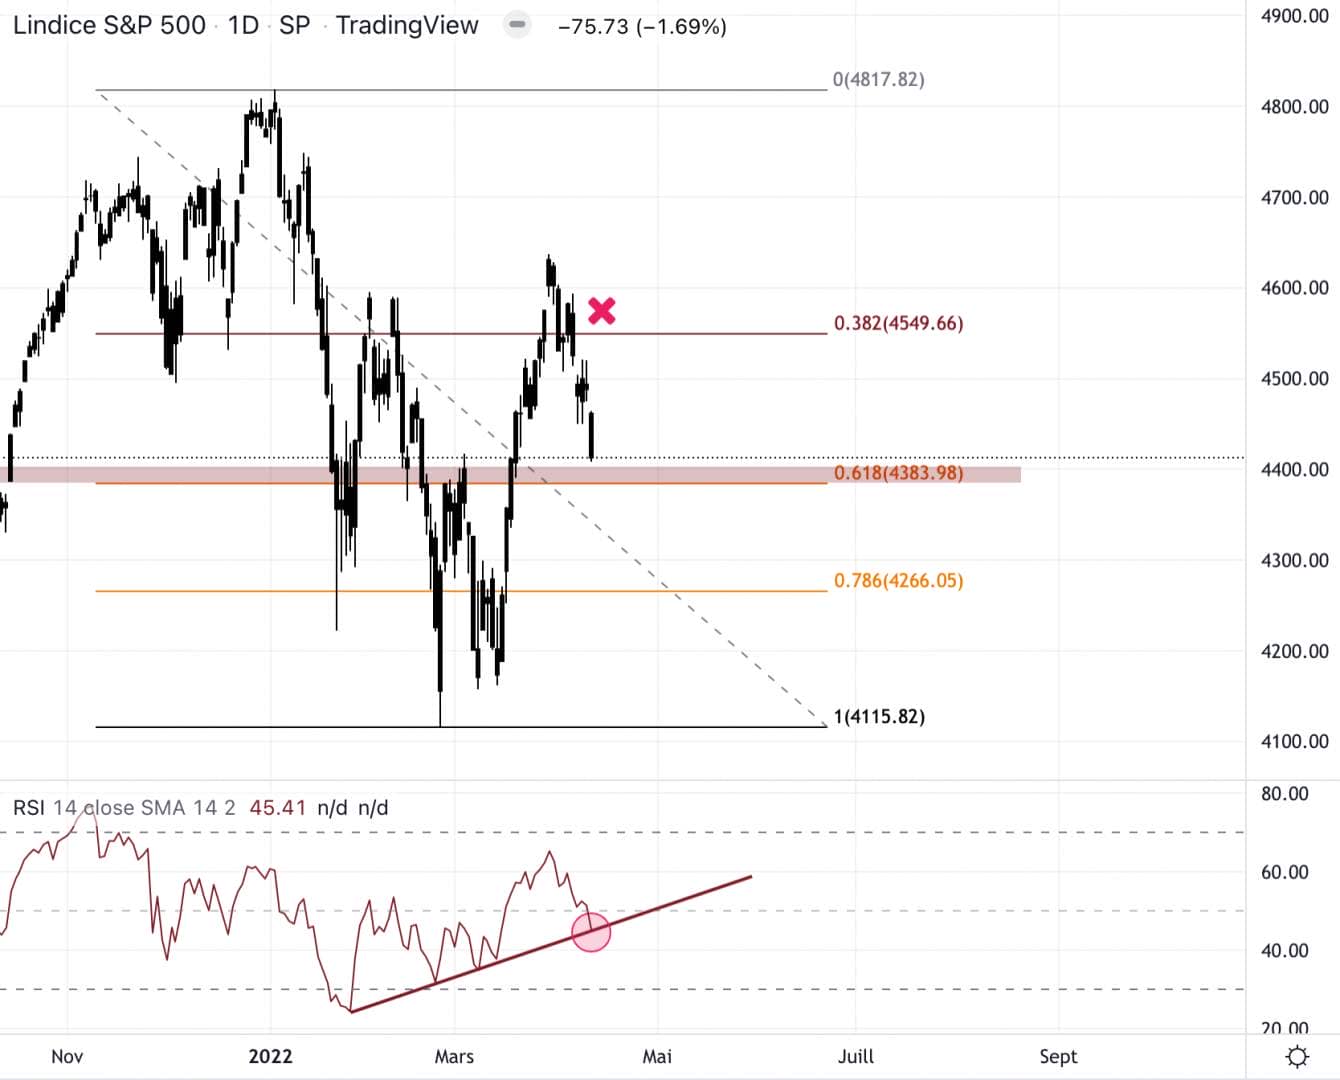
The S&P 500 failed to sustain the first stop that would have allowed it to attack its all-time high. The course heads towards the “W” daily and the reloading zone between $4,384 and $4,266. The course should find a support here to show that this area is defended by buyers.
the RSI momentum is rather bullish. The asset needs to keep the neutral zone as a support in order to show that the buyers have the upper hand in the market. It’s not confirmed yet.
The S&P 500 seems to have found a support around $4,200. It is absolutely necessary that this support holds in the weeks and months to come. To confirm the fact that the S&P 500 only experienced a healthy fall there in a bullish primary trend, sooner or later it will have to look a new all-time high.
Bitcoin is highly correlated to US equities and, at the moment, US risky assets are struggling to confirm a comeback to the upside. The US central bank announced a rate hike in early May and it is possible that risky assets are pricing this event. Hopefully there will be no surprises in the coming weeks for the situation to stabilize. For now, safe-haven assets such as gold and the dollar are benefiting.
Is it possible to be a winner every time? Whether the bitcoin price is in great shape, or going through turbulence, Coin Trading offers you to increase your chances of success. Indeed, Coin Trading allows individuals to access a trading tool algorithmic and 100% automated. Real trend mechanism, follow our affiliate link to test this tool designed to adapt to market reversals and position yourself on the most dynamic crypto assets of the moment.