
A month of September that opens calmly on the markets? Since last week’s analysis, it is clear that the market has not taken a very specific direction. Bitcoin and Ethereum are terribly soft. The market is more in line with a range, moving between a lower limit and an upper limit. This complicates our task vis-à-vis trend following since in the end, there is none. So, in this new crypto point of the weekend, we will determine the scenarios to consider. Then, we will see under what conditions these could be validated.
This market analysis is offered to you in collaboration with the Trading du Coin and its solutionon algorithmic trading finally accessible to individuals.
Ethereum and Bitcoin down, the rest of the market follows suit
You will see that since last week, the market has reacted quite logically. The range allows you to somehow digest the decline while chasing the stops of sellers and buyers. Continuing to evolve below 963 billion dollars, the market was once again rejected on the EMA13 (the darkest line). This is indicative of a downtrend which, as it stands, is a little less dynamic.
The objectives defined last week are broadly the same since the market is under resistance. If it does not free itself as quickly as possible from the 963 billion as well as the confluence of the EMA, it will be necessary to favor the bearish objectives with a return to the EQ of the previous range as well as the 833-843 billion dollars. The market has been contracting for a few days, it is strongly advised to be on your guard. When the market resumes a clear trend, price movements are likely to be strong.
Altcoins are notably undecided, what are they waiting for?
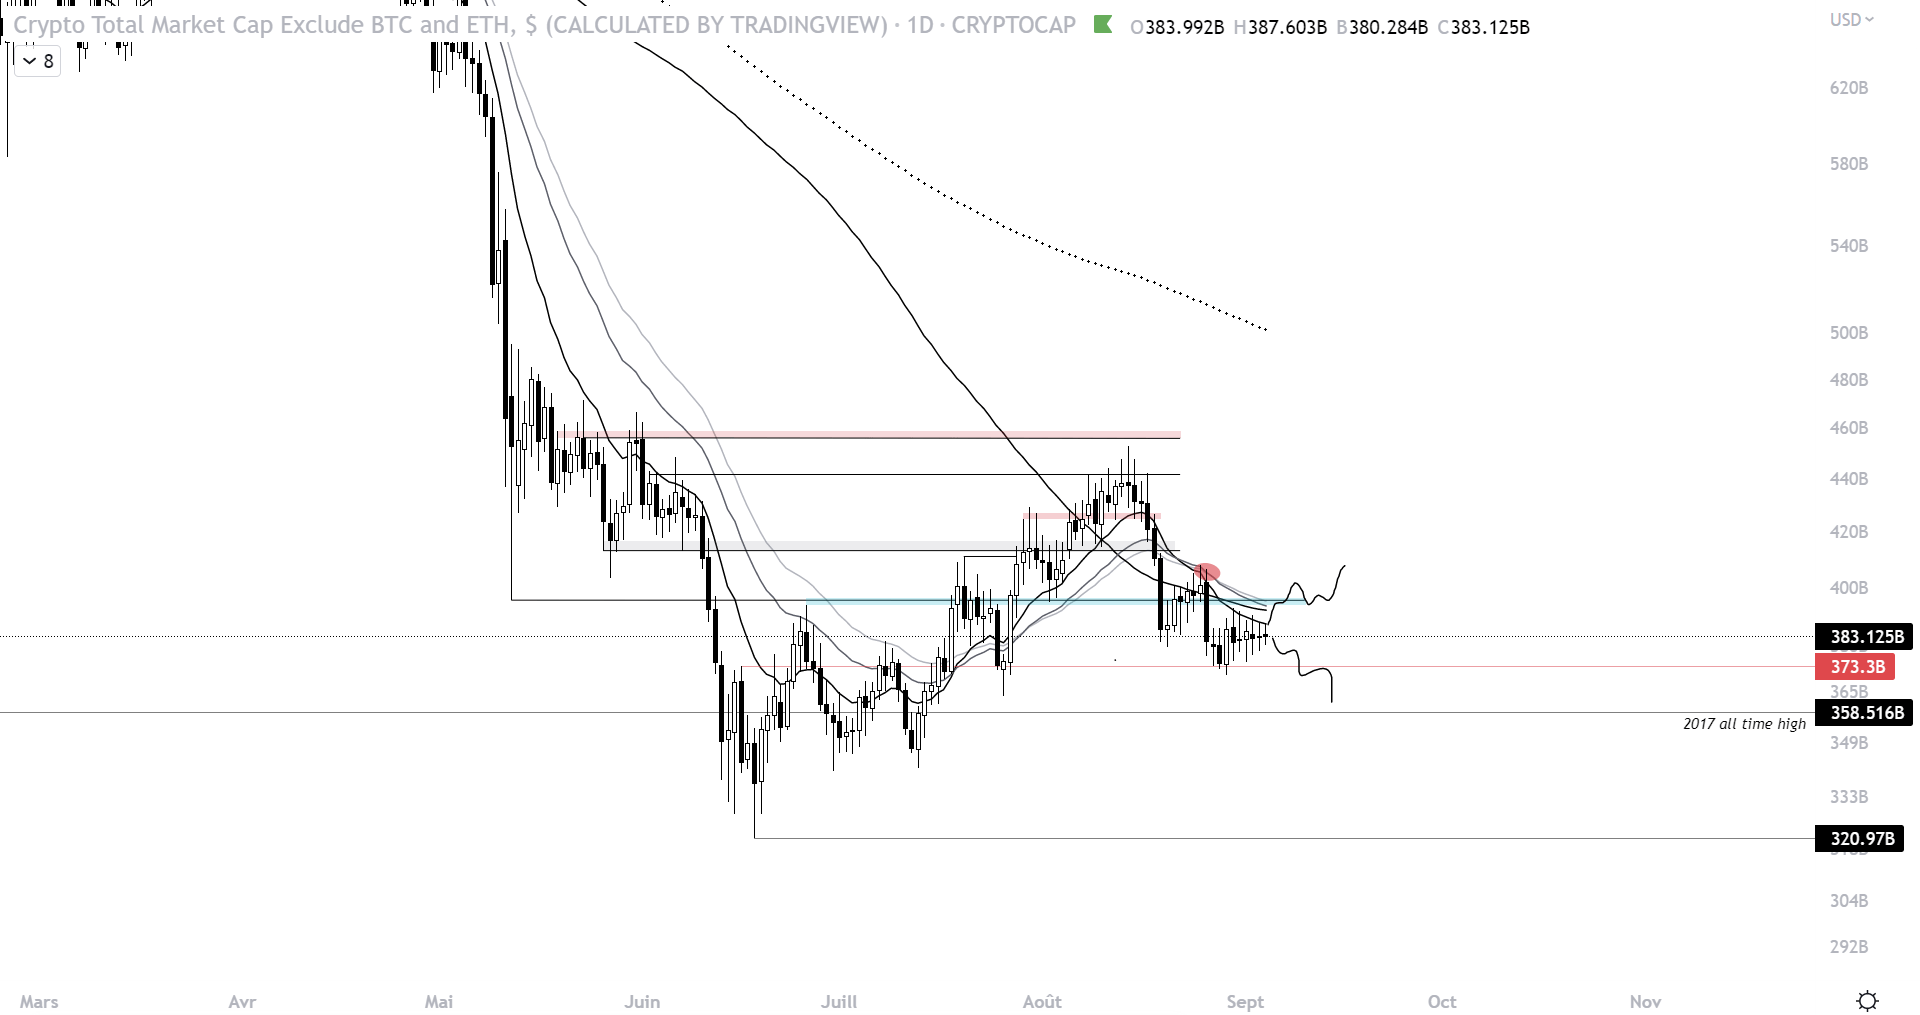
The situation for altcoins hardly changed during this first week of September. The graph above represents the market without the capitalization of Bitcoin and Ethereum (TOTAL3). Compared to the first chart, the volatility is even lower. Altcoins are simply waiting for a move from the two biggest assets in the market. Depending on the movement of these and the balance of power maintained, altcoins can quickly change dynamics. If they manage to overcome the important confluence of technical levels by returning to the pivot zone at $393 billion, a small upward movement could take place (first objective at 406 billion and second objective at 415 billion).
However, until it does, we should maintain a more bearish bias assuming that the downtrend will continue. So, besides the $373 billion (red line), it looks interesting to have your eyes on:
- The all time high of 2017 at $358 billion
- An unidentified double bottom on the chart that created local support at $340 billion
- The June low at $320 billion.
These are objectives that were already identified last Sunday. However, since the market has changed little, it is necessary to be patient and not try to take the micro movements of the range which have the sole objective of causing you to lose part of your capital by misleading you.
Bitcoin dominance finally achieves its stated goals
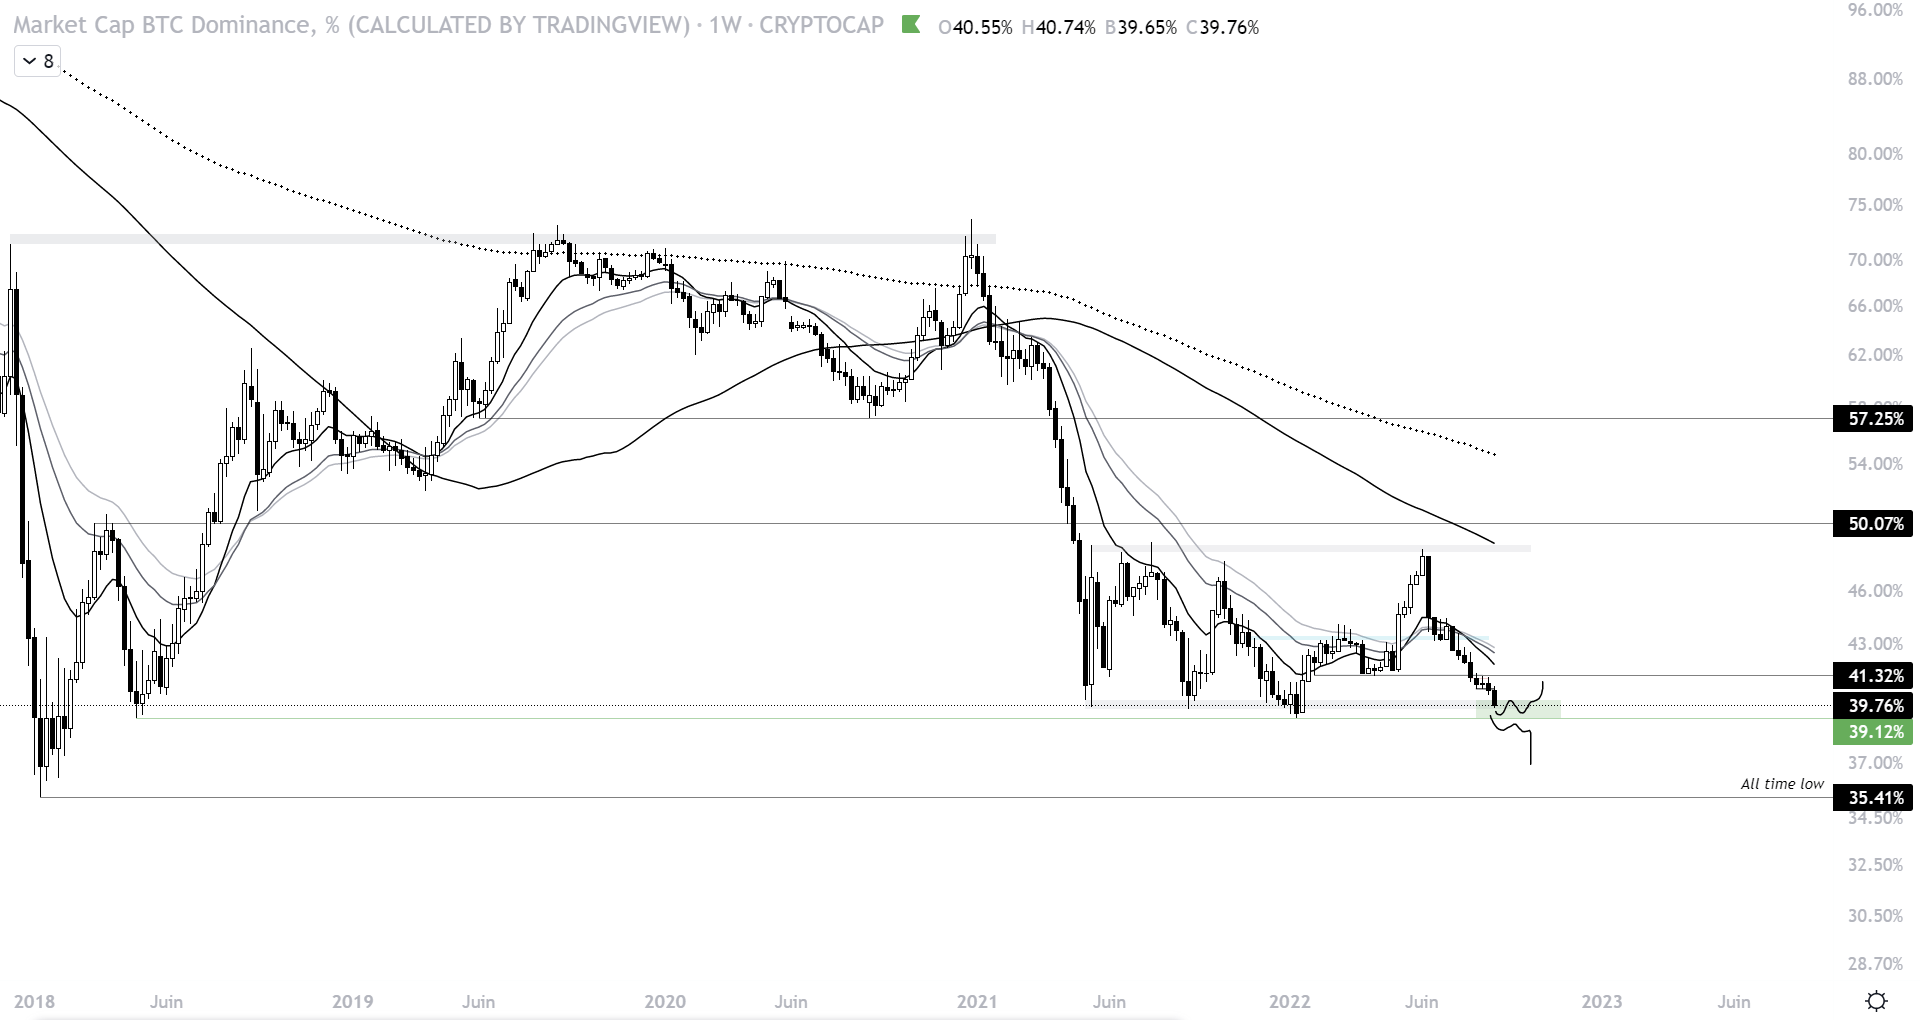
Bitcoin dominance has reached a level we have been watching for several weeks: the confluence of the 2021 support and the April 2018 low (green zone). Now that we are there, the big question is what path bitcoin dominance might take. The chances of a rebound on these levels are much greater than a continuation of the fall. After several weeks where bitcoin is left aside, wouldn’t it be time to resume in force in this month of September, which is starting calmly?
It is entirely possible to have a decline in the overall market and bitcoin less sensitive to these movements. This would allow the king of cryptocurrencies to regain dominance very gradually. A sharp rise is more complex to envisage given the current macroeconomic situation and the FED’s monetary policy, which is very restrictive. At the moment the bitcoin dominance trend is bearish, maybe the time has also come for a range of a few weeks? One thing to note: if it recovers 41.32%, it will probably return to the confluence of EMA (41.78-42.94%).
Ethereum does not budge against bitcoin
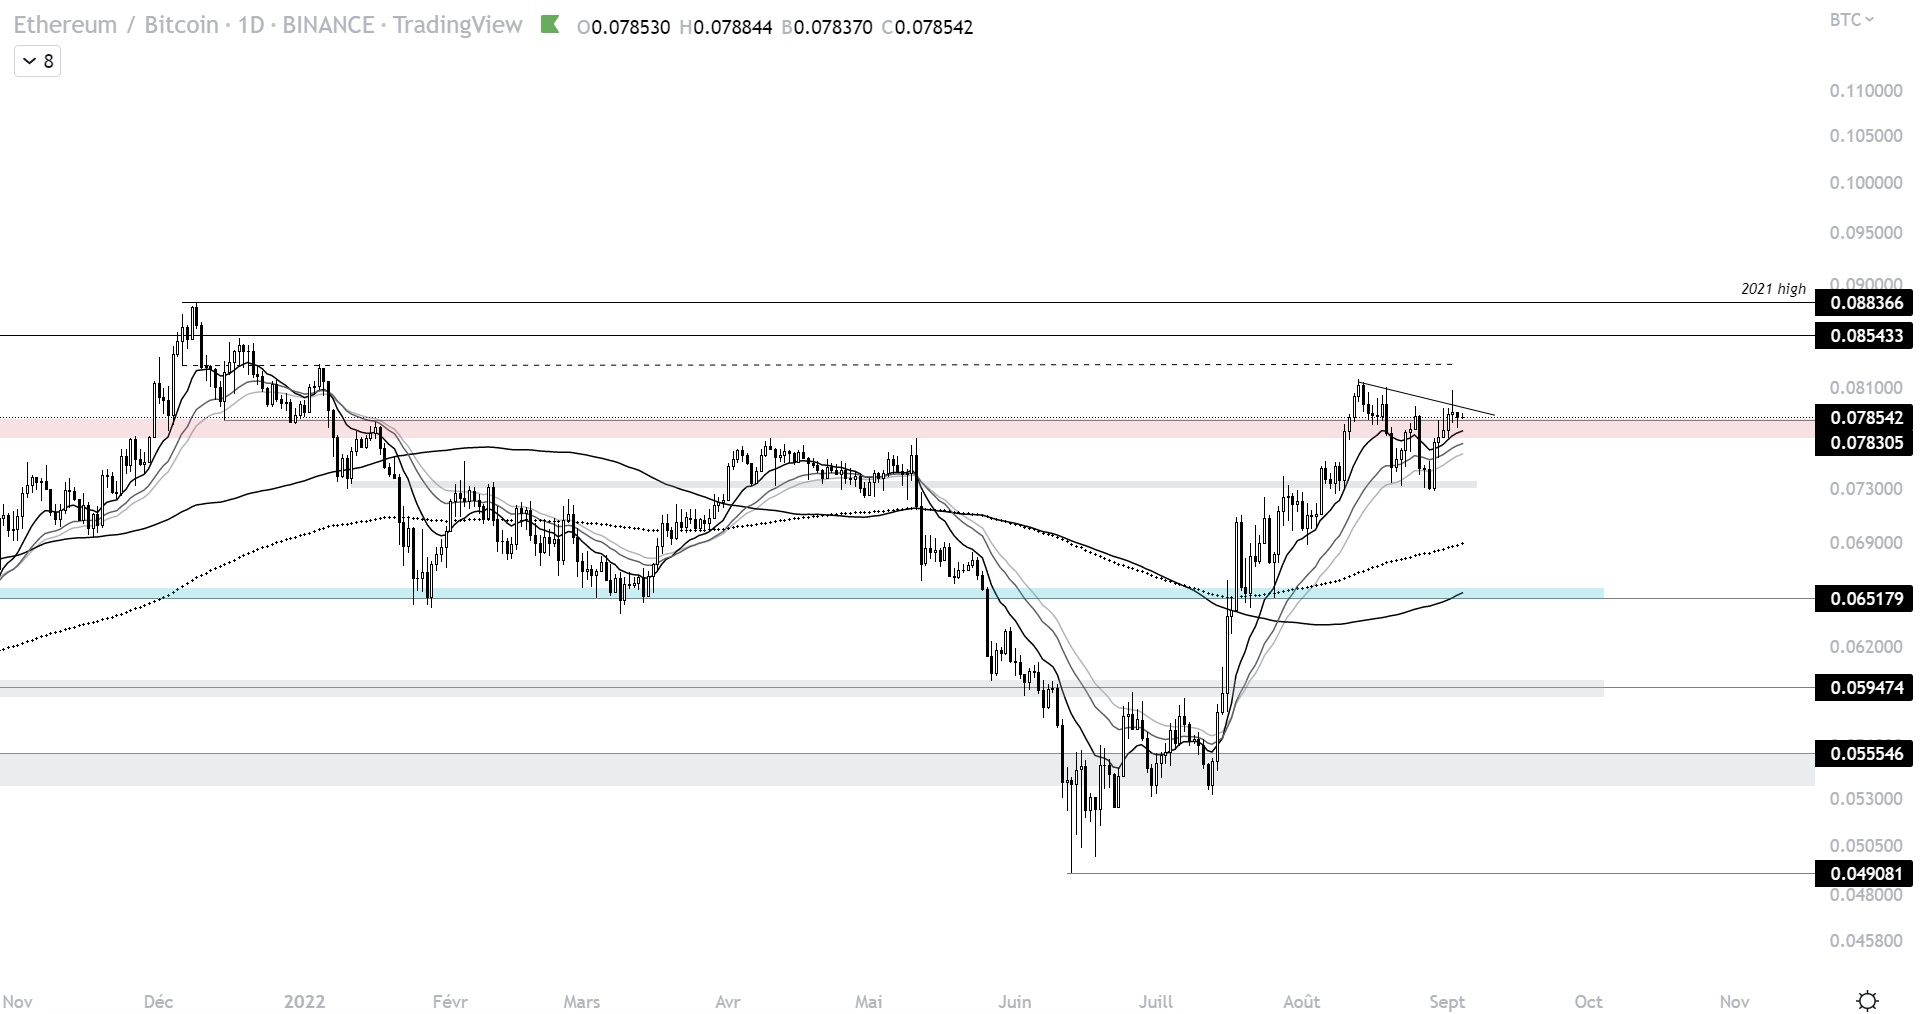
Against bitcoin, we can see that ethereum is in a sharp downturn from the strong bull run. For two months, the asset had managed to get rid of the clutches of bitcoin. It is currently battling to retake the red zone which is a major level on the pair. Recently, it has relied on the 0.0730 BTC, a technical zone that regularly acts as support and resistance. More so, it managed to retake its confluence from EMA 13/25/32. This allows him not to flinch in a bearish momentum in the short term.
The Merge is approaching, it is certain that the next few days will be hectic. The ETH/BTC pair will be the first to pay the price since it would allow us to understand where the capital is going. Ethereum pushing higher and bitcoin favoring the range will be supportive of a rally in altcoins. For the bullish scenario to materialize, Ethereum will have to break this oblique resistance upwards. But that’s not all, he will also have to stay above this red zone. This should allow him the 0.0830 and the 0.0854 BTC. On the contrary, a loss of the local support at 0.0730 BTC will be the signal of a bearish trend. Thus, ethereum could be forced to contract during the next few weeks.
Exchange tokens falter after powerful rally.
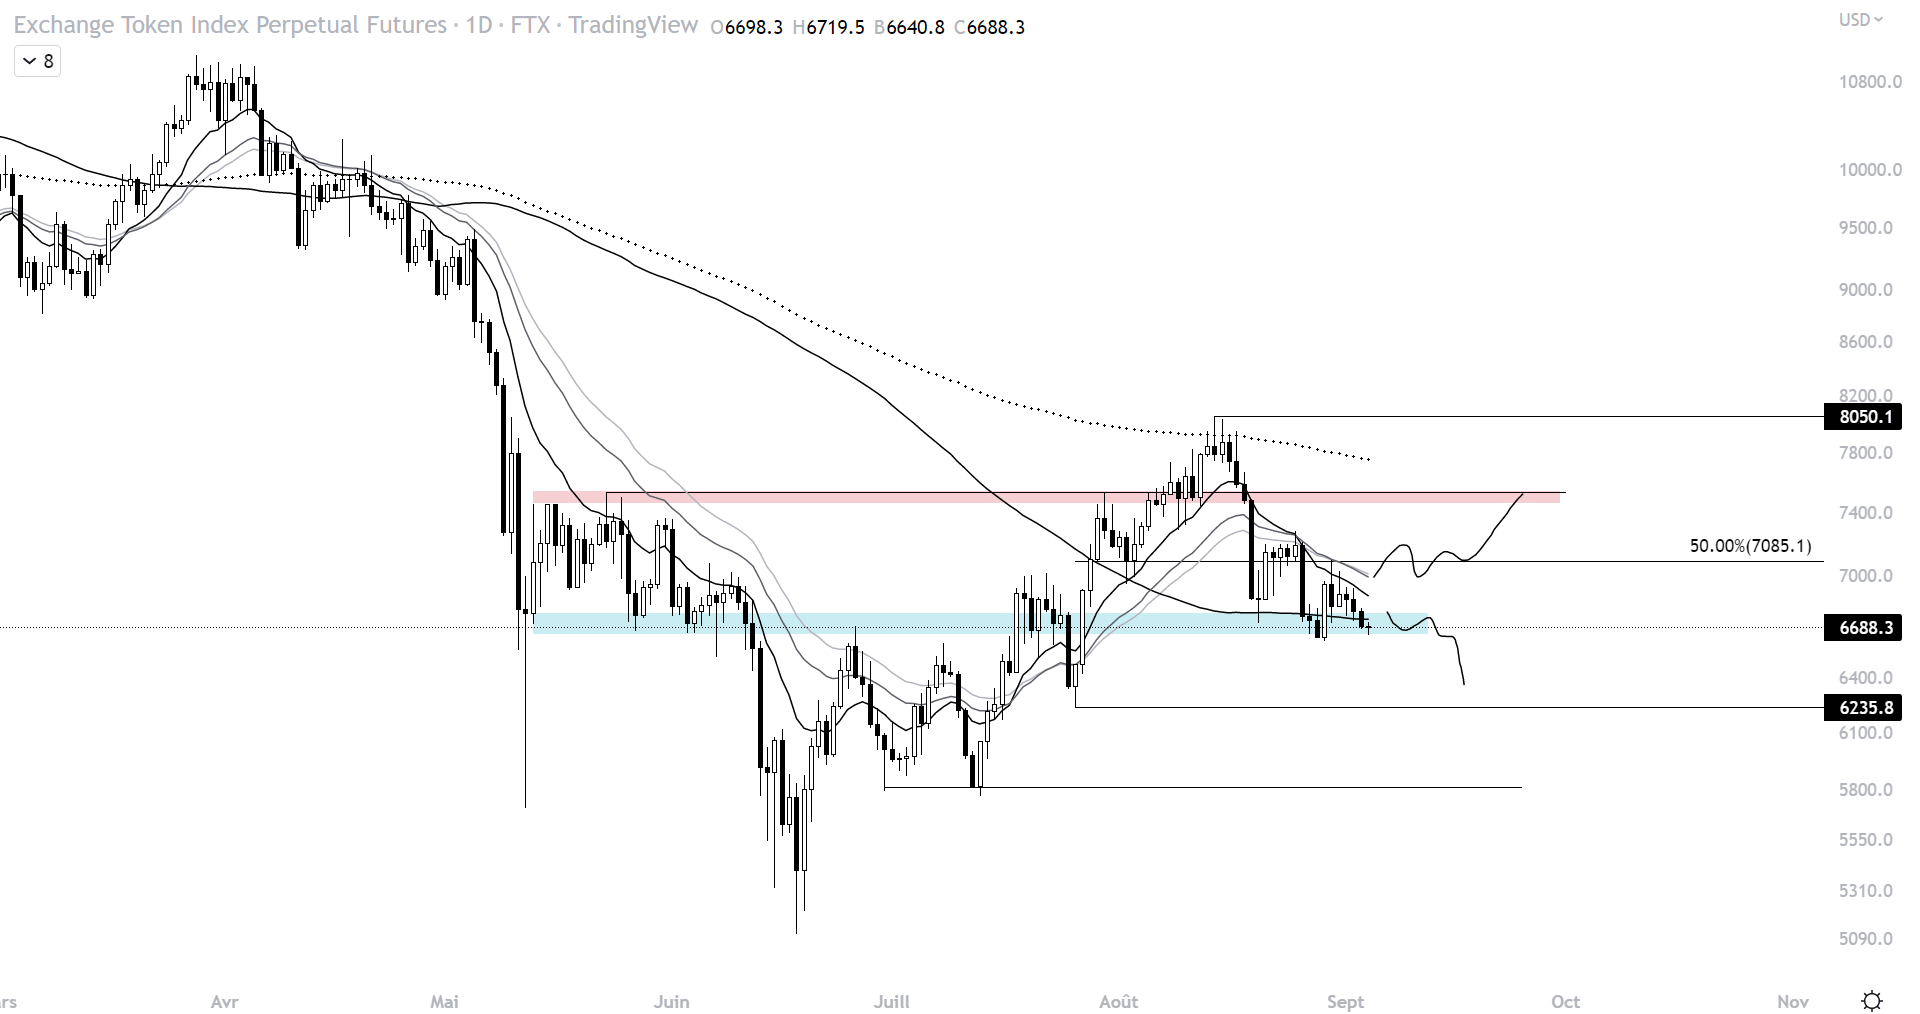
Since our analysis of August 7, the bullish objective has been reached (the 8000 dollars) on the index. This includes a set of assets from the exchange platforms. However, you can see a rejection on the EMA200 which ended the index’s rise. Quite quickly, the index reintegrated an old resistance from which it had freed itself and is now in a downtrend. The multiple rejections on the 13/25/32 EMA testify to the strength of the sellers.
Now, the index is moving between 7085 dollars and the pivot zone (blue) at 6650/6750 dollars. For a rally to take place, the ideal would be a recovery of the whole EMA, a rally of the $7085 with a bullish retest. This would allow for a return to the red resistance zone at $7500. However, if it fails to do so and continues to register descending lows and highs while losing the pivot zone, a return to $6235 will be very likely.
Here we are at the end of this crypto market technical point. It is clear that the range situation is not simple. This does not make it any easier for us to see what direction the market might take. At the same time, Ethereum does not weaken against the king of cryptocurrencies. In addition, the latter arrives on a major support in terms of dominance. We are probably at a key moment for the market. It is only a matter of time before volatility resumes which will likely be heightened with The Merge. If Ethereum continues to leave bitcoin on the sidelines, this could be an opportunity for altcoins to give the market a little green, but how far?
We must not forget that the macroeconomic situation and the Fed’s restrictive policy do not allow us to set overly ambitious bullish targets. In addition to the possibility of playing the high and low limits of the current range, be patient in taking a position and do not try to anticipate a movement which could be the very opposite of your convictions. While waiting for our next meeting next Sunday, be careful on the markets, have good risk management so as not to erase your gains from previous weeks.
Is it possible to be a winner every time? Whether the bitcoin price is in great shape, or going through turbulence, Coin Trading offers you to increase your chances of success. Indeed, Coin Trading allows individuals to access a trading tool algorithmic and 100% automated. Real trend mechanism, follow our affiliate link to test this tool designed to adapt to market reversals and position yourself on the most dynamic crypto assets of the moment.