
In this first technical analysis of the week, let’s meet a dinosaur of cryptocurrencies, Litecoin. Technically similar to Bitcoin, it was one of the favorites of the 2017 bullrun. Having experienced a nice rise in 2020 and 2021, it nevertheless deviates from Coinmarketcap’s top 10. Could this be a loss of investor interest in this financial asset? This is a very complex question to which we have no real answers as LTC continues to develop as a means of payment. In order to see a little more clearly in the future of this cryptocurrency, let’s go without further delay to our graphs.
This LTC analysis is offered to you in collaboration with the Coin Trading and its algorithmic trading solution finally accessible to individuals
A loss of the weekly pivot zone?
On this weekly LTC chart, it is interesting to note that after an almost perfect return to theAll Time High (ATH) of 2017, the asset entered a powerful downtrend quite quickly. The slanting resistance that you can see on the chart materializes this price momentum that forms descending tops. But then, would a breakout of this line mean an uptrend? Not really. It is necessary to add other signals in order to have a higher probability of success.
At the moment, LTC has lost its weekly pivot zone. When price is above, this area usually operates as support. Conversely, when the price is below, it acts as resistance. A recent breakout has just been operated, the scenario conceivable at present is a return to this area, in convergence with the oblique resistance, to be rejected and continue the weekly downtrend.
A bullish breakout of this area with a re-entry above $98 will signify the presence of a buying force. However, it is not the bullish scenario that should be favored. So, what are the weekly key areas to watch?
- The 50/52 dollars (a technical area where the price has reacted regularly).
- $41.5 (the weekly support for the second half of 2020).
- The $25.3 (level where the price has come only twice since the 2017 bullrun).
Liquidity to be sought on higher levels?
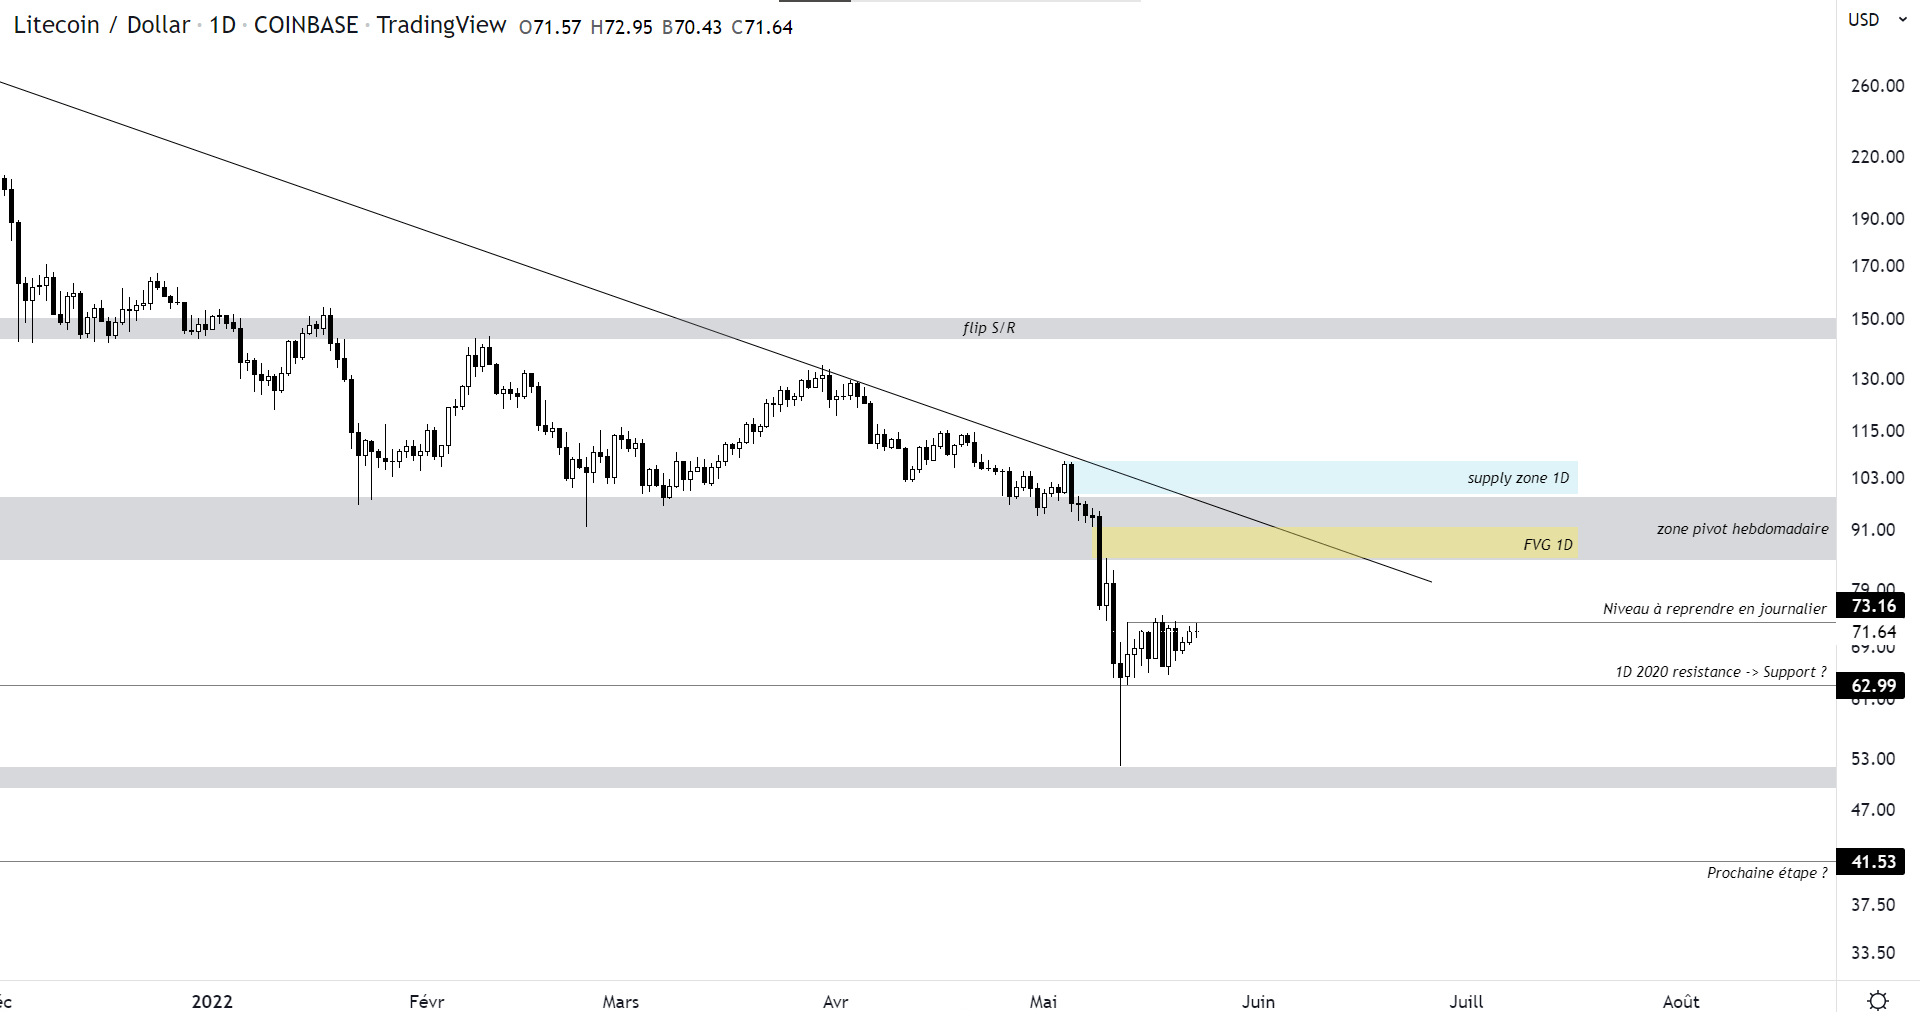
On a daily basis, we can see a sharp drop with a wick in the 50/52 dollar area. This movement is explained by a liquidation of people who were buying with leverage. Now all assets, including LTC, are digesting the recent move with price lateralizing between $73.16 and $62.99. Although the macroeconomic context is not favorable to an expansion of risk-on assets, we can favor a bullish scenario in the short term. But why ?
Since the bearish movement of the first half of the month, we can see the presence of a supply area daily (blue zone) as well as a Fair Value Gap (yellow area). Theoretically, the FVG must be filled and the prize must return to its daily supply zone. In this context, in the event of a close above 73.16 dollars, it seems relevant to consider a complete filling of the FVG or even, ideally, a wick in the supply area before going back down.
In this regard, LTC would be in good conditions to continue its downward movement towards the levels mentioned in the weekly part of the analysis. For the moment, nothing is confirmed since the price is still between its support and its resistance. It is possible that LTC will not come to look for liquidity on higher levels, preferring to break the supports to head towards $50. It’s not the main scenario, but we have to have different scenarios in mind so as not to be surprised. Thus, I urge you to watch the price action on the H4 scale.
Will LTC gain strength against Bitcoin?
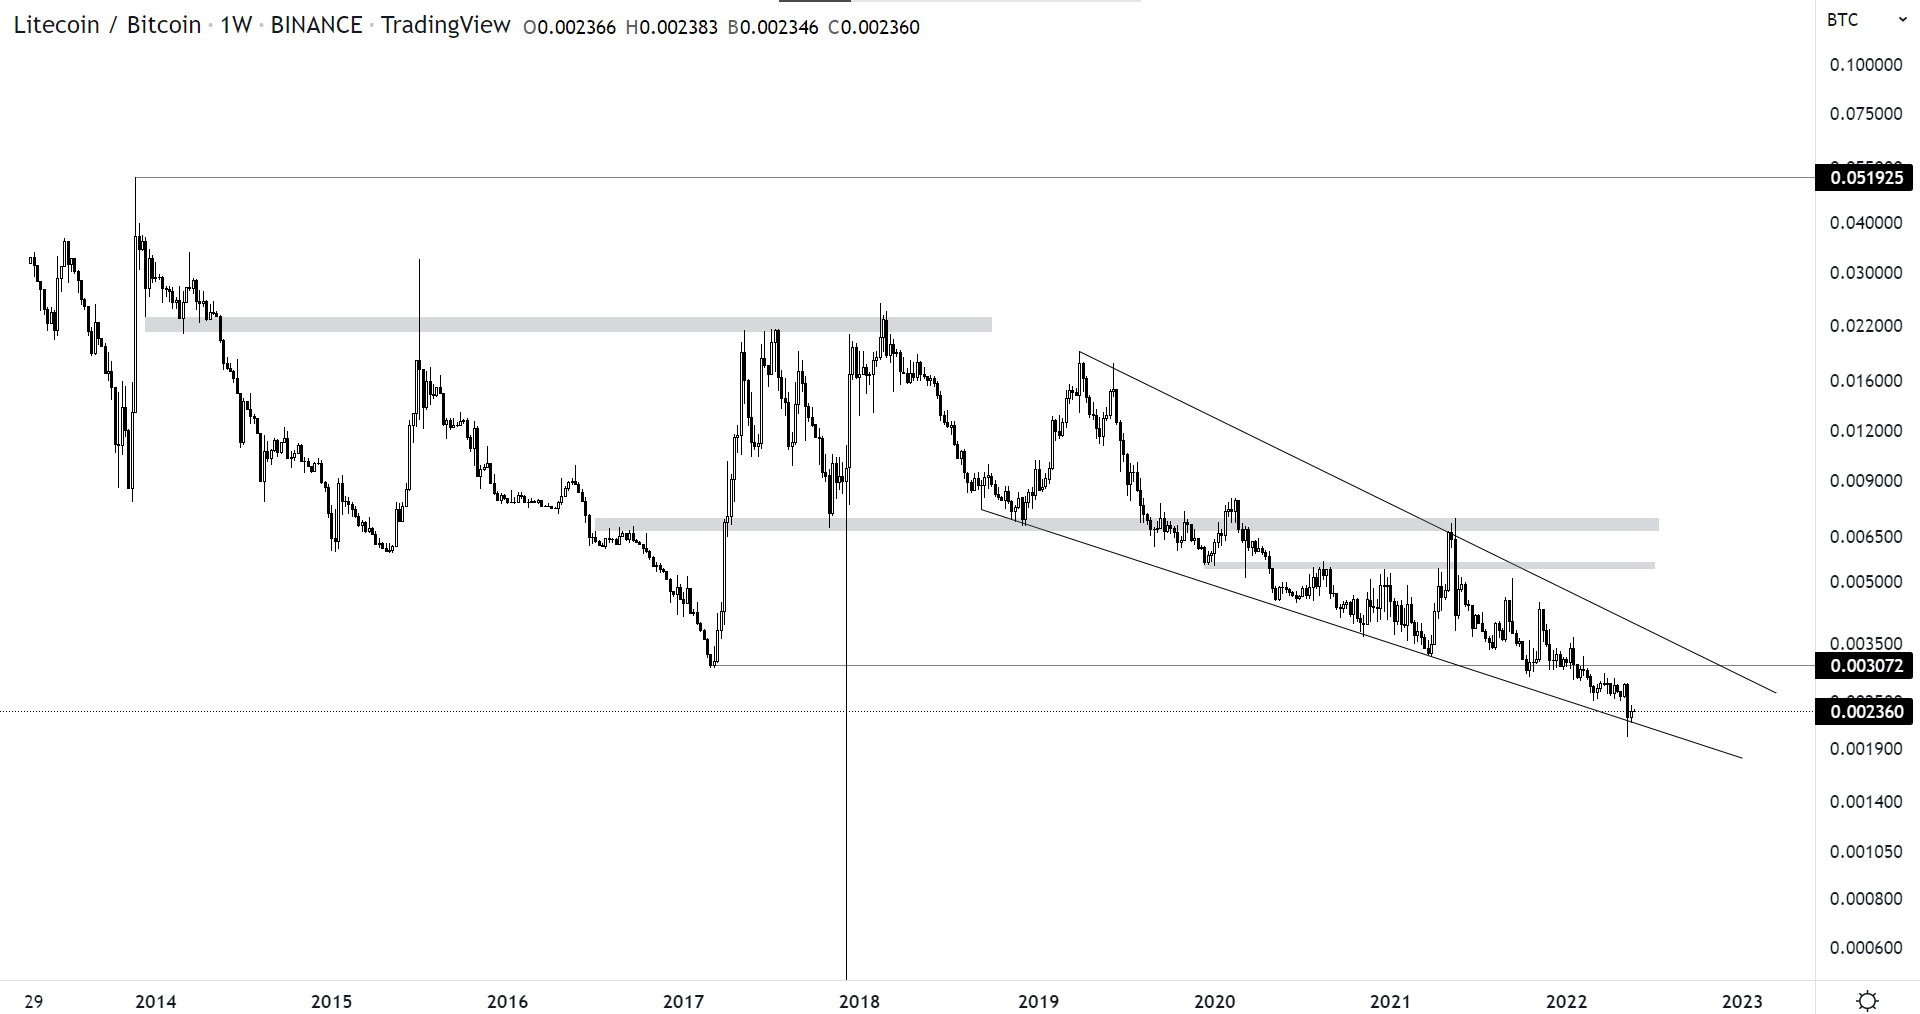
I want to end my analysis with the LTC/BTC pair which allows to know the strength of an altcoin compared to the king cryptocurrencies, the one that sets the pace of the market. What we can see now is not very nice. Although LTC is currently in a falling wedge whose exit is theoretically bullish, this is by no means the scenario to consider at the moment. The trend is bearish with descending troughs and peaks.
Unfortunately, this trend against bitcoin may last a long time on a weekly basis, especially since the low point of February 2017 was broken down at the start of 2022. So remember that LTC is underperforming against bitcoin. During the next declines of the latter, the LTC will do the same, but more strongly. However, when bitcoin is in good shape, litecoin will probably be removed from the best performance.
Here we are at the end of our new Monday technical analysis. Now you start the week knowing the key levels for one of the dinosaurs of the cryptocurrency industry. The trend is bearish on a weekly basis, there is an underperformance against bitcoin. However, we should not rule out the scenario of an upside correction on the levels indicated in the analysis. Dear readers, be on your guard, the week could be hectic on the financial markets.
Is it possible to be a winner every time? Whether the bitcoin price is in great shape, or going through turbulence, Coin Trading offers you to increase your chances of success. Indeed, Coin Trading allows individuals to access a trading tool algorithmic and 100% automated. Real trend mechanism, follow our affiliate link to test this tool designed to adapt to market reversals and position yourself on the most dynamic crypto assets of the moment.