After the bears pushed Bitcoin to key support at USD 47,000 over the weekend, new buyers came back into the market, creating a dynamic countermovement back towards USD 55,000. Bitcoin dominance continues to be weak and threatens to give up the psychological mark of 50 percent.
Bitcoin (BTC): Bitcoin price is working off important bearish price target
BTC course: 55,202 USD (previous week: 55,458 USD)
Resistance / goals: $ 55,817, $ 56,867, $ 58,386, $ 59,527, $ 61,122, $ 61,771, $ 64,896, $ 67,416, $ 69,744, $ 70,000, $ 70,856, $ 76,472, $ 77,678, $ 80,323, $ 86,295, $ 89,982, $ 100,258 , $ 113,074
Supports: $ 54,077, $ 51,307 / $ 50,305, $ 49,423, $ 48,222, $ 47,070, $ 44,878, $ 43,030, $ 41,967, $ 40,240, $ 39,130, $ 36,904
Price analysis based on the value pair BTC / USD on Coinbase
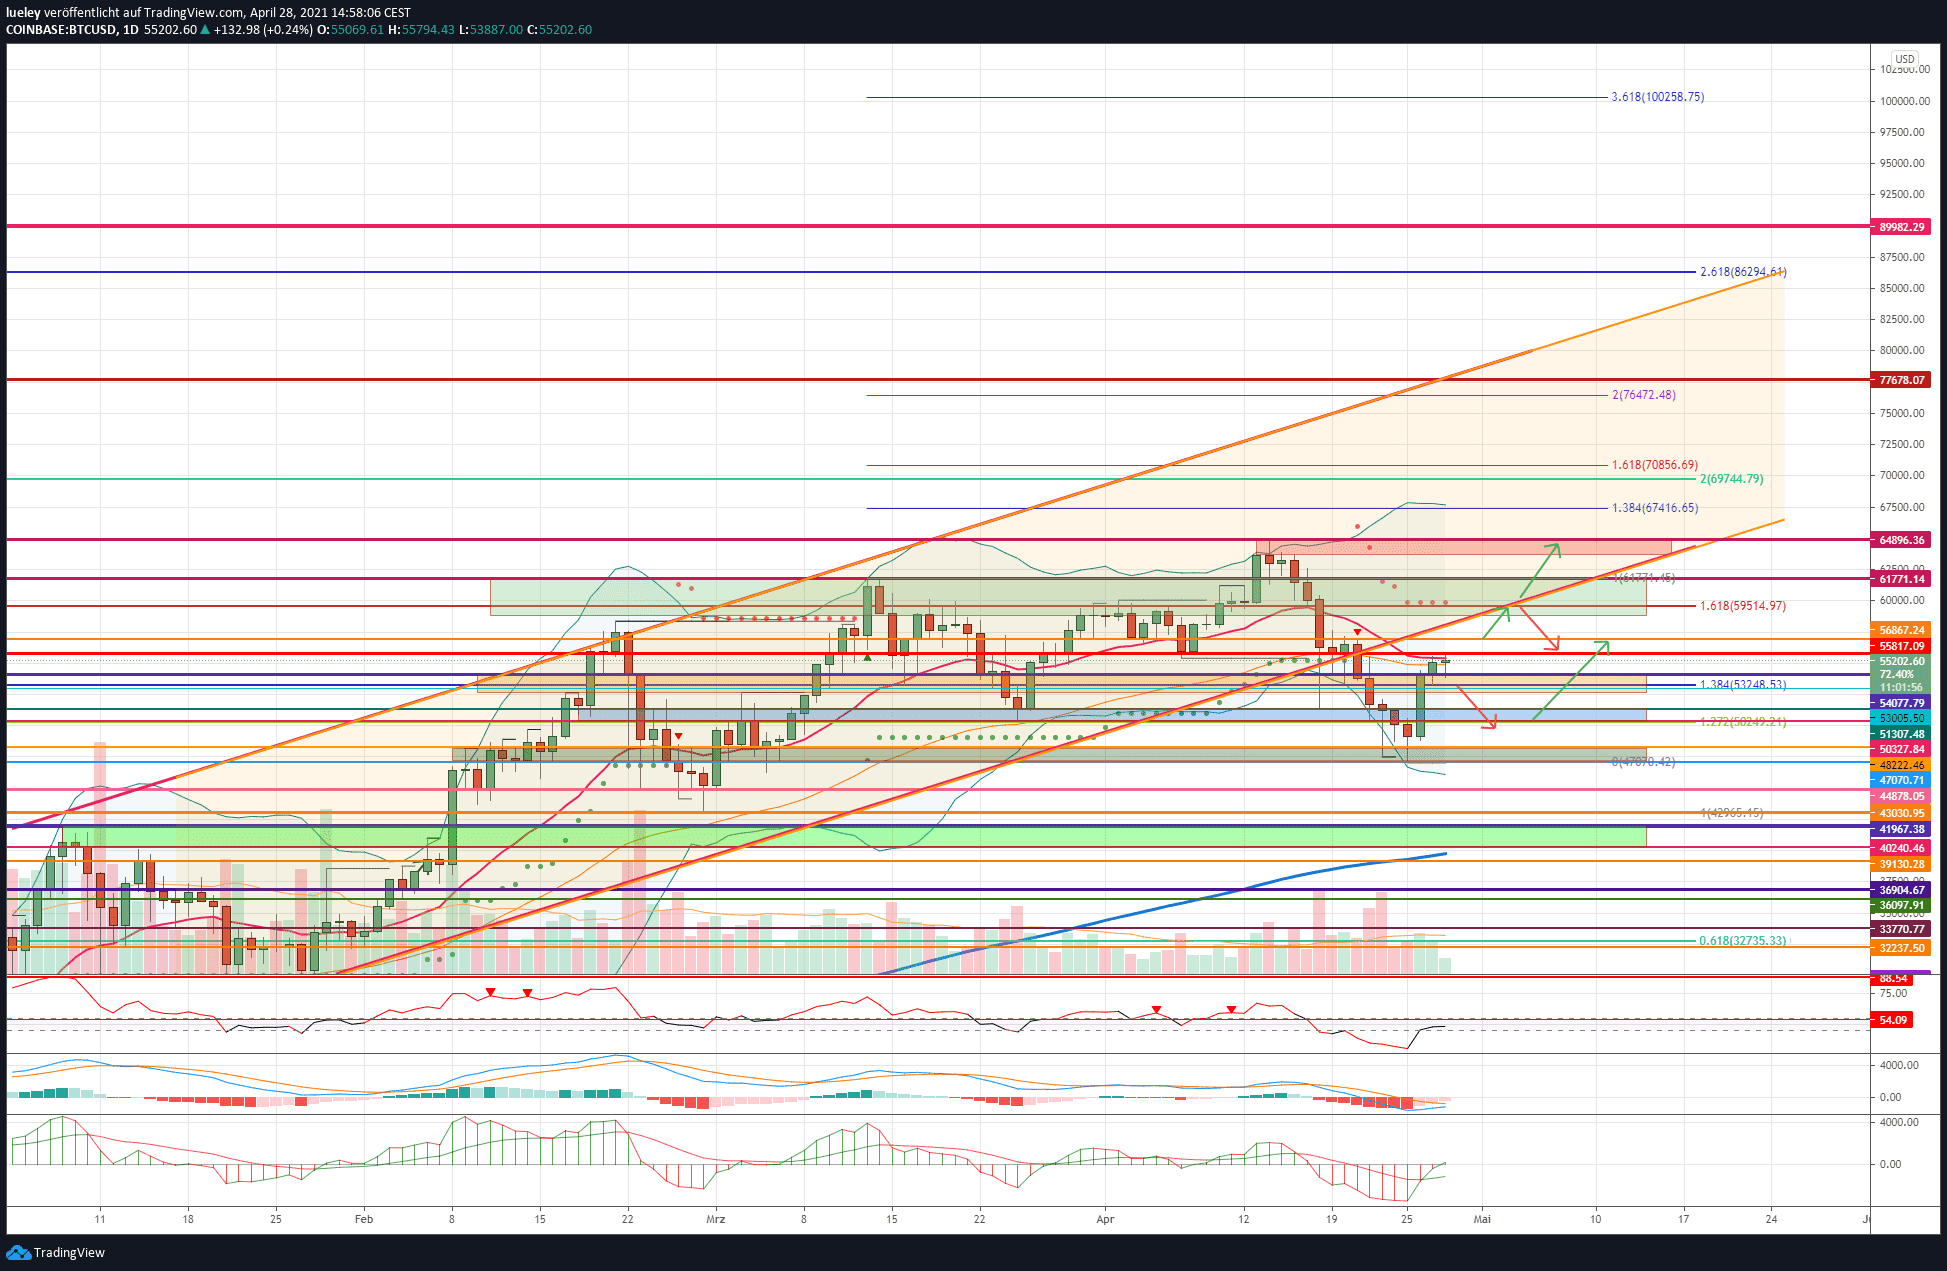
Bitcoin, the key crypto currency, can look back on an eventful week. After a bearish breakout from the higher-level trend channel, the BTC price slipped significantly and fell back to the price target of USD 47,070 mentioned in the previous week’s analysis. Here the bulls came back on the floor and heaved Bitcoin back to the cross resistance consisting of the red horizontal resistance line and EMA20 (red) within three trading days. On Wednesday, the Bitcoin price failed in the first attempt at this resistance and is currently trading just below USD 55,059.
Bullish scenario (Bitcoin price)
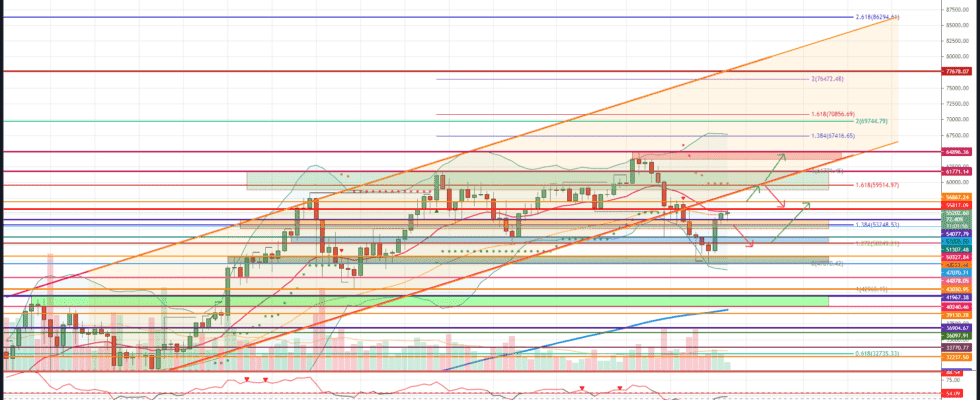
Bullish investors took advantage of the temporary price weakness and the oversold status of Bitcoin and sent the crypto reserve currency back above the psychological USD 50,000 mark. On the downside, the Bitcoin rate in the USD 47,000 area seems well hedged for the time being. The BTC rate is now trading in the USD 55,000 area again and could try to climb back above the important resistance at USD 55,817 in the short term. If Bitcoin overcomes this price mark and subsequently jumps back above the horizontal resistance at USD 56,867, an increase to USD 59,514 should be planned. Here it is decided again whether the bulls will manage to send the BTC rate back into the uptrend channel. Should the cross resistance from the lower edge of the trend channel, the 161 Fibonacci extension and the supertrend be broken, the resistance level at USD 61,771 will first come back into focus. This is where the old high of March 14, 2021 is found. A recapture of the psychological mark of USD 60,000 would brighten the chart again significantly. However, only when the USD 61,771 daily closing price is broken can the bulls regain legitimate hope of an attack on the red resistance zone. If the Bitcoin price jumps back into this area, an attack on the all-time high at USD 64,896 is likely.
The way towards USD 100,000
If the all-time high is overcome without significant resistance, the 138 Fibonacci extension at USD 67,416 first comes into focus. The upper Bollinger band also runs here. If the bulls manage to generate further buying pressure, there will be a battle of strength between buyers and sellers in the area between USD 69,744 and USD 70,856. In addition to the 161 Fibonacci extension of the current price movement and the 200 Fibonacci extension of the higher-level trading movement, a look at the order book also indicates a strong resistance at USD 70,000. Only when the bulls can generate enough upward pressure and sustainably break through this area upwards should a break through to the 200 Fibonacci extension of the current upward movement at USD 76,472 be planned. The next relevant target price of USD 77,678 is only marginally distant. This cross resistance is formed from the upper edge of the trend channel and a resistance level from the monthly chart. The first sales should start here before Bitcoin should target the price mark of USD 80,323 in the medium term. If the interest of the bulls remains high and the trend channel is to leave upwards, a march through to the 261 Fibonacci extension of the higher-level price movement is conceivable. This course projection runs at $ 86,295. A direct rise to the 461 Fibonacci extension, which is taken from the hourly chart, would then be conceivable. That resistance level can be found at $ 89,982. Starting from this resistance level, the Bitcoin price should initially correct to the upper edge of the trend channel. As long as the BTC price can stabilize above the trend channel, investors will keep their eyes on the USD 100,000. In addition to this psychological mark, there is also the 361 Fibonacci extension of the current price movement at USD 100,258. However, it is only conceivable that this target will be reached in the second half of the year. If bullish investors do not take chips off the table on a sustainable basis, an increase to between USD 113,074 and USD 114,959 is possible in 2021.
Bearish scenario (Bitcoin price)
The bears’ delight in a correction toward $ 43,000 or lower was short-lived. After a 30 percent price correction, the consolidation of the Bitcoin price was over for the time being at USD 47,070. The bulls dynamically heaved the Bitcoin price back to the EMA20 (red). If the bears manage to keep the Bitcoin price below USD 56,867 in the coming trading days, but at the latest at the lower edge of the trend channel at USD 59,514, there is another chance for a price correction back towards the orange support area between USD 54,077 and USD 52,713. Should this area be undercut by the daily closing price, the probability of a new downward movement increases. If the bears can subsequently build up enough selling pressure, the likelihood of a retest of the blue support area increases. The support area between USD 51,307 and USD 50,327 should provide a preliminary decision as to whether the bears are brave enough to re-enter the dark green support zone between USD 48,222 and USD 47,070.
If the BTC rate does not rebound sustainably upwards and forms a double bottom, the probability of a correction widening up to USD 44,878 increases noticeably. As a result, a relapse to the low of 43,030 USD is increasingly likely. This support level, in the form of the high on January 8, 2021, should again be of interest for the bull camp. Should the BTC price give up this strong support, price targets will activate at USD 41,967 and USD 40,240. The EMA200 (blue) is also just below USD 39,130. Therefore, bullish investors will want to grab it again. A short nightcap up to USD 36,904 would be imaginable. The bears cannot be trusted any more at the moment. In the long term, a retest of the “Tesla outbreak level” would be welcomed in order to gather enough strength for a price rally towards USD 100,000.
How do I buy Bitcoin? Guide and provider comparison 2021
We will explain to you quickly and easily how you can buy Bitcoin safely and cheaply and what you should pay attention to!
To the guide >>
Bitcoin Dominance: Market dominance reaches key support at 50 percent
Bitcoin dominance based on values of Cryptocap shown
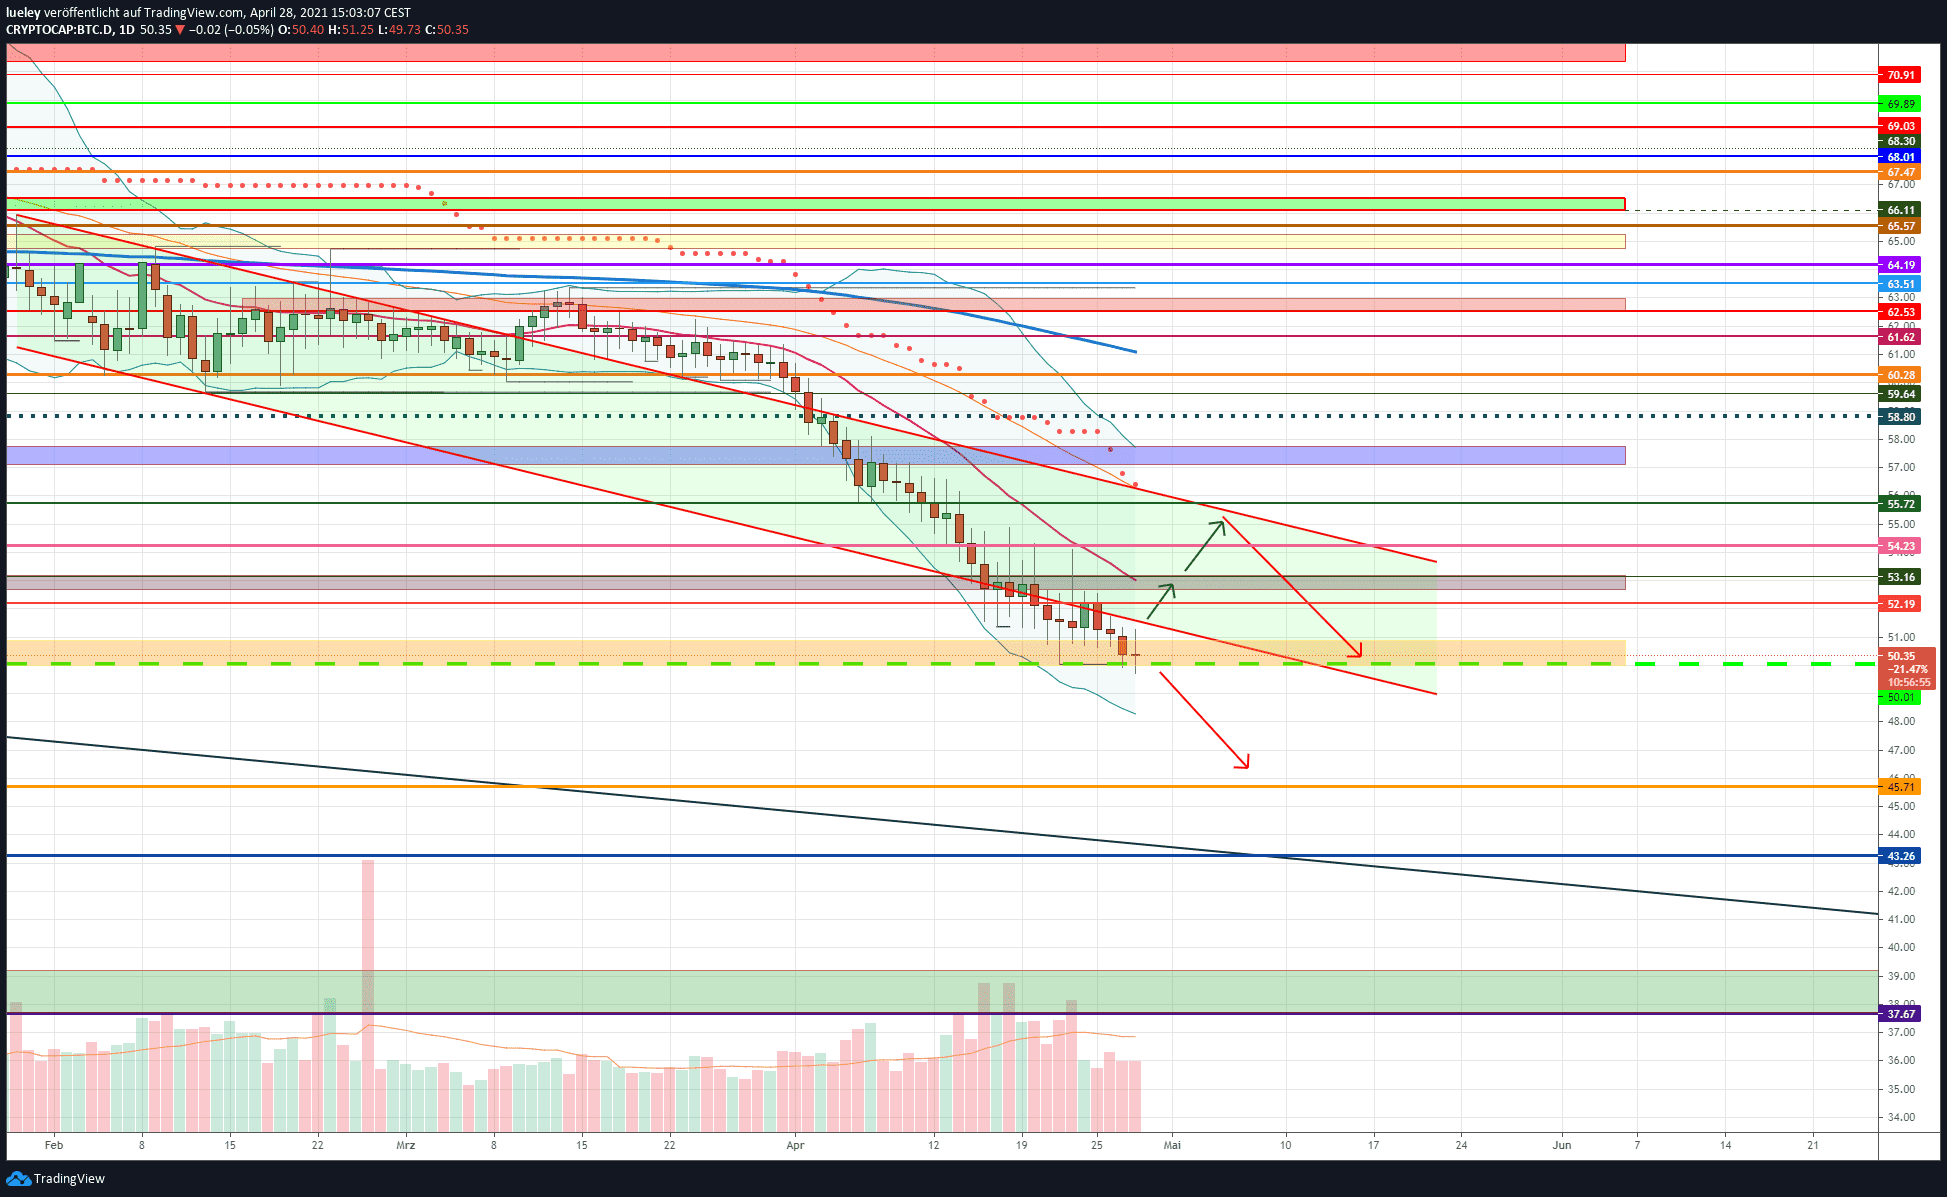
The dominance of the crypto reserve currency Bitcoin has continued to be bearish in the last few weeks of trading. As a result, the BTC dominance dropped to the psychological 50 percent mark. The orange support zone currently seems to be holding up. However, as long as the Bitcoin dominance trades below the red resistance line at USD 52.19, the possibility of abandoning the 50 percent threshold is not banned. A drop in the direction of 45.71 percent or lower cannot be ruled out in the future.
BTC Dominance: Bullish Scenario
The BTC dominance tested the area around 50 percent market dominance several times in the last few days and can currently stabilize above it. Only when the BTC dominance can jump back into the downtrend channel will the 52.19 percent mark come back into focus. If the course overcomes this resist, a short-term directional decision is made in the gray resistance zone. In the last 14 trading days, the dominance here repeatedly bounced off downwards. In addition, the EMA20 (red) runs along the upper edge at 53.16 percent. If the Bitcoin dominance makes it back above this sliding resistance at the daily closing price, the recovery rally should continue. A first possible target price can be found in the area of 54.23 percent. Even here, the air for a subsequent increase is likely to become thinner.
For now, the maximum target of the recovery rally is seen at 55.72 percent. If the BTC dominance also overcomes the strong resistance at 55.72 percent and continues to rise towards 57.12 percent, the chart initially clears up further. An increase above the purple resistance range between 57.12 percentage points and 57.78 percent likely activates the maximum recovery goal at 58.80 percent. At the latest at this resistance level, a renewed decline towards 55.72 percent can be expected. Higher goals are not to be expected for the time being, investor interest in many Altcoins is currently too great. In particular, the bullish price development of the pursuers Ethereum (ETH) and the Binance Coin (BNB) reduce the chance of a sustainable recovery in Bitcoin dominance back above the 60 percent mark.
BTC Dominance: Bearish Scenario
The persistent weakness of BTC dominance had already been discussed in the last few weeks. Bitcoin’s market power slipped further over the past seven trading days and fell into the orange support zone. Although this strong support area currently seems to be holding up, as long as no sustained reversal is evident, the stabilization could only be short-lived. As long as the BTC dominance does not rebound significantly from the support area between 50.88 percent and 50.01 percent, a break of 50.01 percent can be expected at any time.
If the Bitcoin dominance falls below the 50 percent threshold at the daily closing price, an expansion of the price weakness towards 45.71 percent is conceivable. If there is no countermovement at this support level either, a correction extension to the cross support at USD 43.26 cannot be ruled out. Here is an important horizontal support from 2018. If the area around 43.26 percent does not hold, the green support zone between 39.14 percent and 37.67 percent comes into focus. As long as the psychological mark of 50 percent is not given up in the long term, at least a short-term recovery is conceivable.
Disclaimer: The price estimates presented on this page do not constitute buy or sell recommendations. They are only an assessment of the analyst.
The chart images were created using TradingView created.
USD / EUR exchange rate at the time of going to press: 0.83 euros.
BTC-ECHO Magazin (4/2021): Is it worth investing in NFTs?
The industry magazine for Bitcoin and blockchain investors.
Exclusive top topics for a successful investment:
• NFT: between hype and substance
• FLOW: The new NFT king?
• Taxing mining properly
• 2021 is so bullish
• An interview with the Bundestag
Order free copy >>