Dynamic World is able to determine land cover much more accurately and more up-to-date than existing models.
In order to study the changes that affect our planet, sometimes very quickly such as forest fires or floods, or to follow the evolution of deforestation and urban development, Google offers researchers a satellite imagery tool of extreme precision called “Dynamic World”. Designed in partnership with the WRI (World Resources Institute), Dynamic World uses the Google Earth engine and machine learning. It is capable of providing near real-time global land cover data with an accuracy of 10 meters.
A very precise and responsive system
Providing detailed and up-to-date land cover data has always been a difficult task. Most maps assign a single land cover type to a large land area (e.g. trees or buildings) based on what is most visible on a satellite image and/or determining the land occupation by an expert. The rhythm of updates is often monthly or yearly. However, in many parts of the world, the reality is both more heterogeneous and more dynamic.
According to Google, Dynamic World guarantees an unprecedented level of detail and responsiveness, whether it’s forests in the Amazon, agriculture in Asia, urban development in Europe or seasonal water resources in North America. This information should enable scientists and decision makers ” monitor and understand ecosystems to make more accurate predictions and more effective plans to protect our planet “.
More than 5,000 images analyzed every day
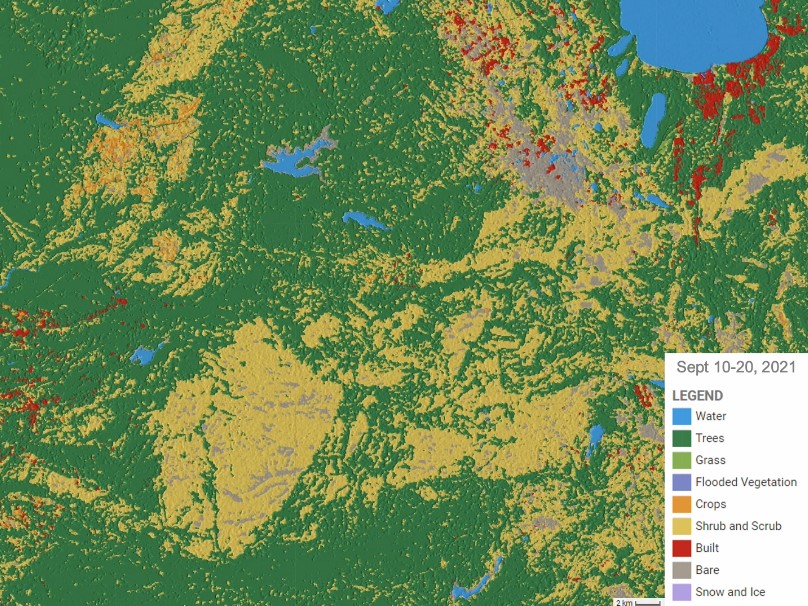
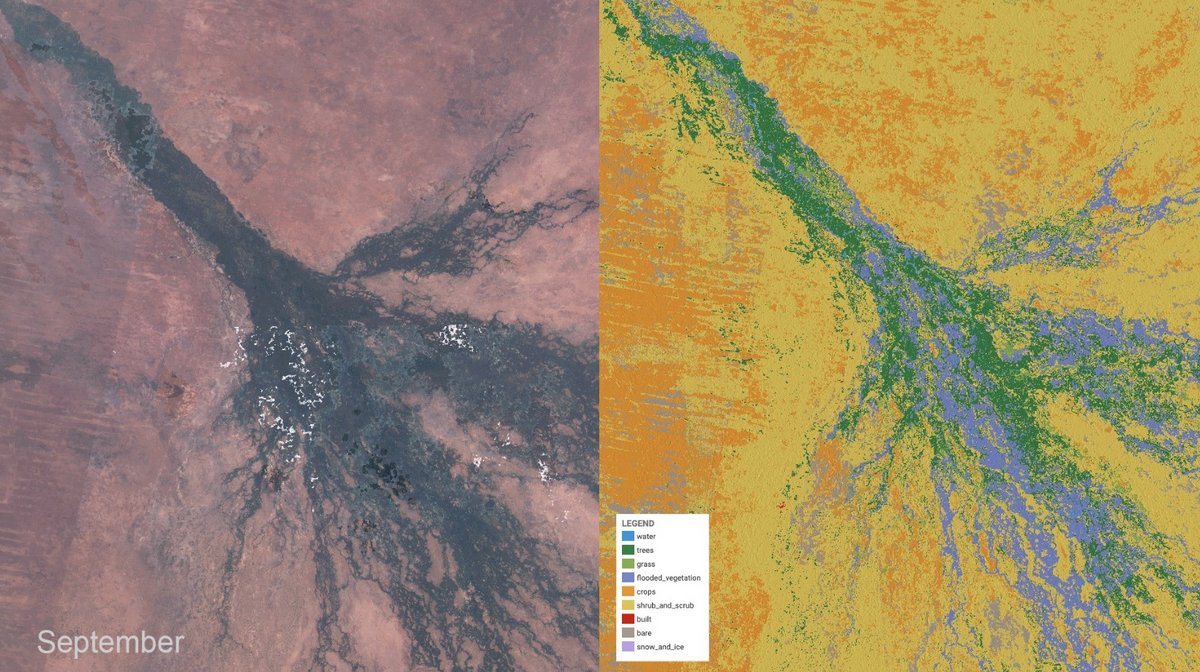
If the second assertion may be wishful thinking, the tool developed by engineers from Google and WRI is undeniably very powerful. The teams defined nine land cover types: water, flooded vegetation, built-up areas, trees, crops, bare soil, grass, shrubs/shrubs and snow/ice.
Dynamic World uses an artificial intelligence model that analyzes images provided by the Copernicus Sentinel-2 satellite – approximately 5,000 images daily – to define the medium represented by each pixel (each pixel represents an area of approximately 1,100 square feet, i.e. 102 m²). The model is able to define land use since June 2015… until D-2.
This level of detail allows scientists and policy makers to detect and quantify the magnitude of recent events anywhere on the globe – such as snowstorms, wildfires or volcanic eruptions – within days. All data is freely available.
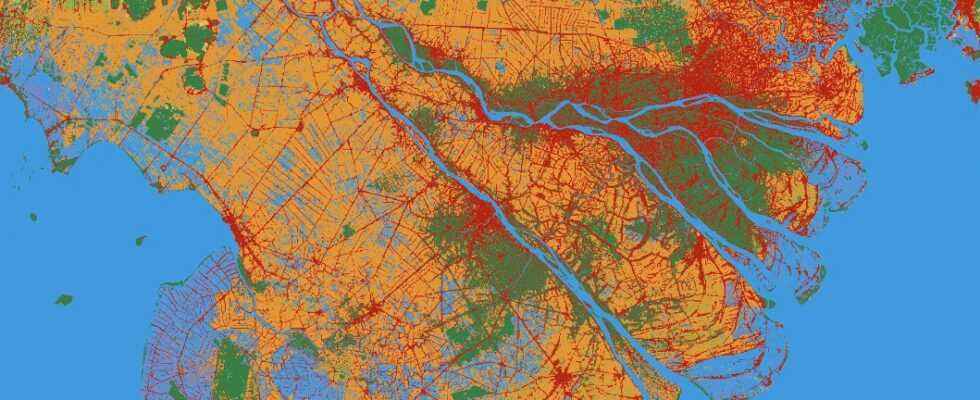
The first example above demonstrates the changes brought about by the fire that burned 221,775 acres of land in El Dorado County, California in August 2021.
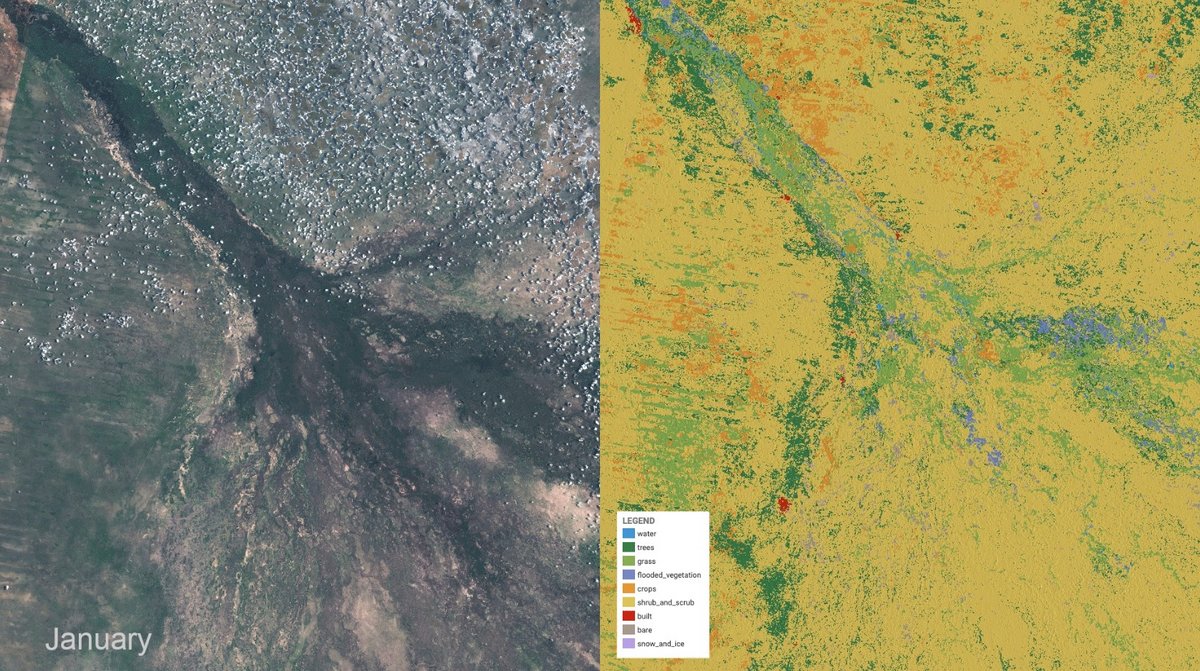
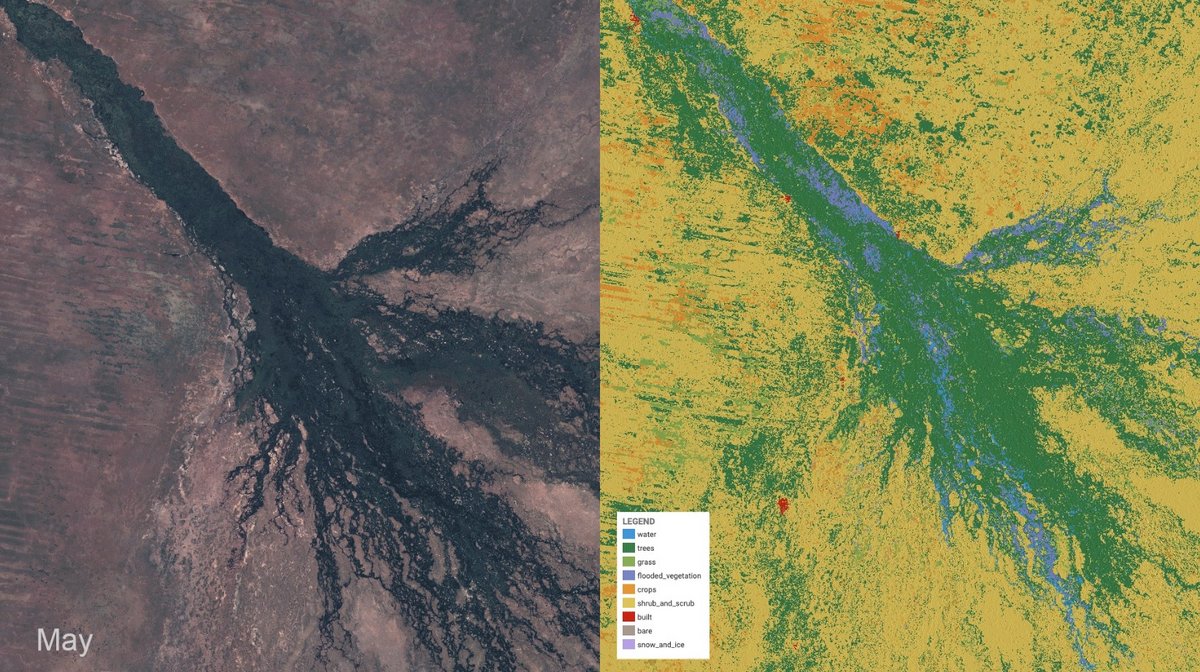
The second shows typical seasonal changes in the Okavango Delta in Botswana.
Craig Hanson, Managing Director and Executive Vice President of Programs at World Resources Institutesays: Global land scarcity is pushing us to find smarter, more efficient and more sustainable ways to use soil. If the world is to produce what is needed from the land, protect the nature that remains, and restore some of what has been lost, we need reliable, near real-time monitoring of every hectare on the planet. “.
Sources: Google, Nature
5