The majority of the crypto market again showed its bullish side in the past trading week. Solana (SOL) and Cardano (ADA) are currently even more bullish than Bitcoin (BTC), which was able to jump over USD 50,000 at times, but has to let SOL and ADA take precedence with only 6 percent price premium.
The crypto market is currently gaining momentum. Despite all the euphoria, investors should be increasingly selective in their purchases. Since Bitcoin is now running into a strong resistance zone, temporary setbacks should not come as a surprise. The strength of Solana (SOL) and Cardano (ADA), each of which has generated new all-time highs, should be rated positively, which is why price corrections tend to represent new buying opportunities.
Best price development among the top 10 altcoins:
Solana (SOL):
Price analysis based on the value pair SOL / USD on Binance
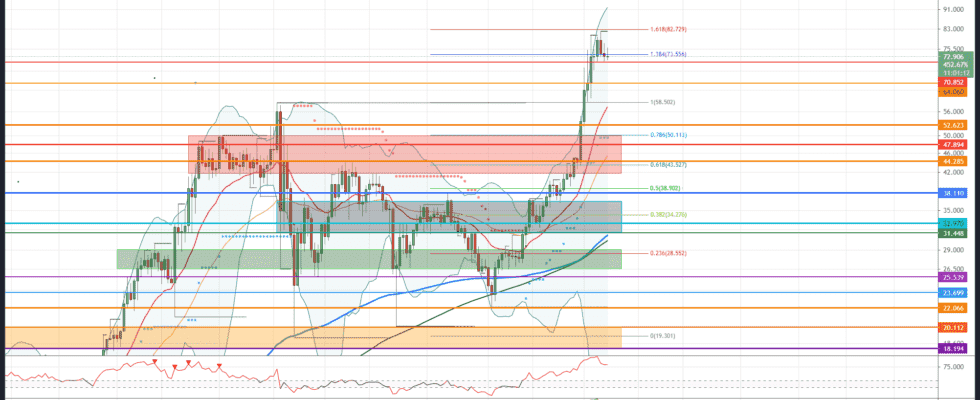
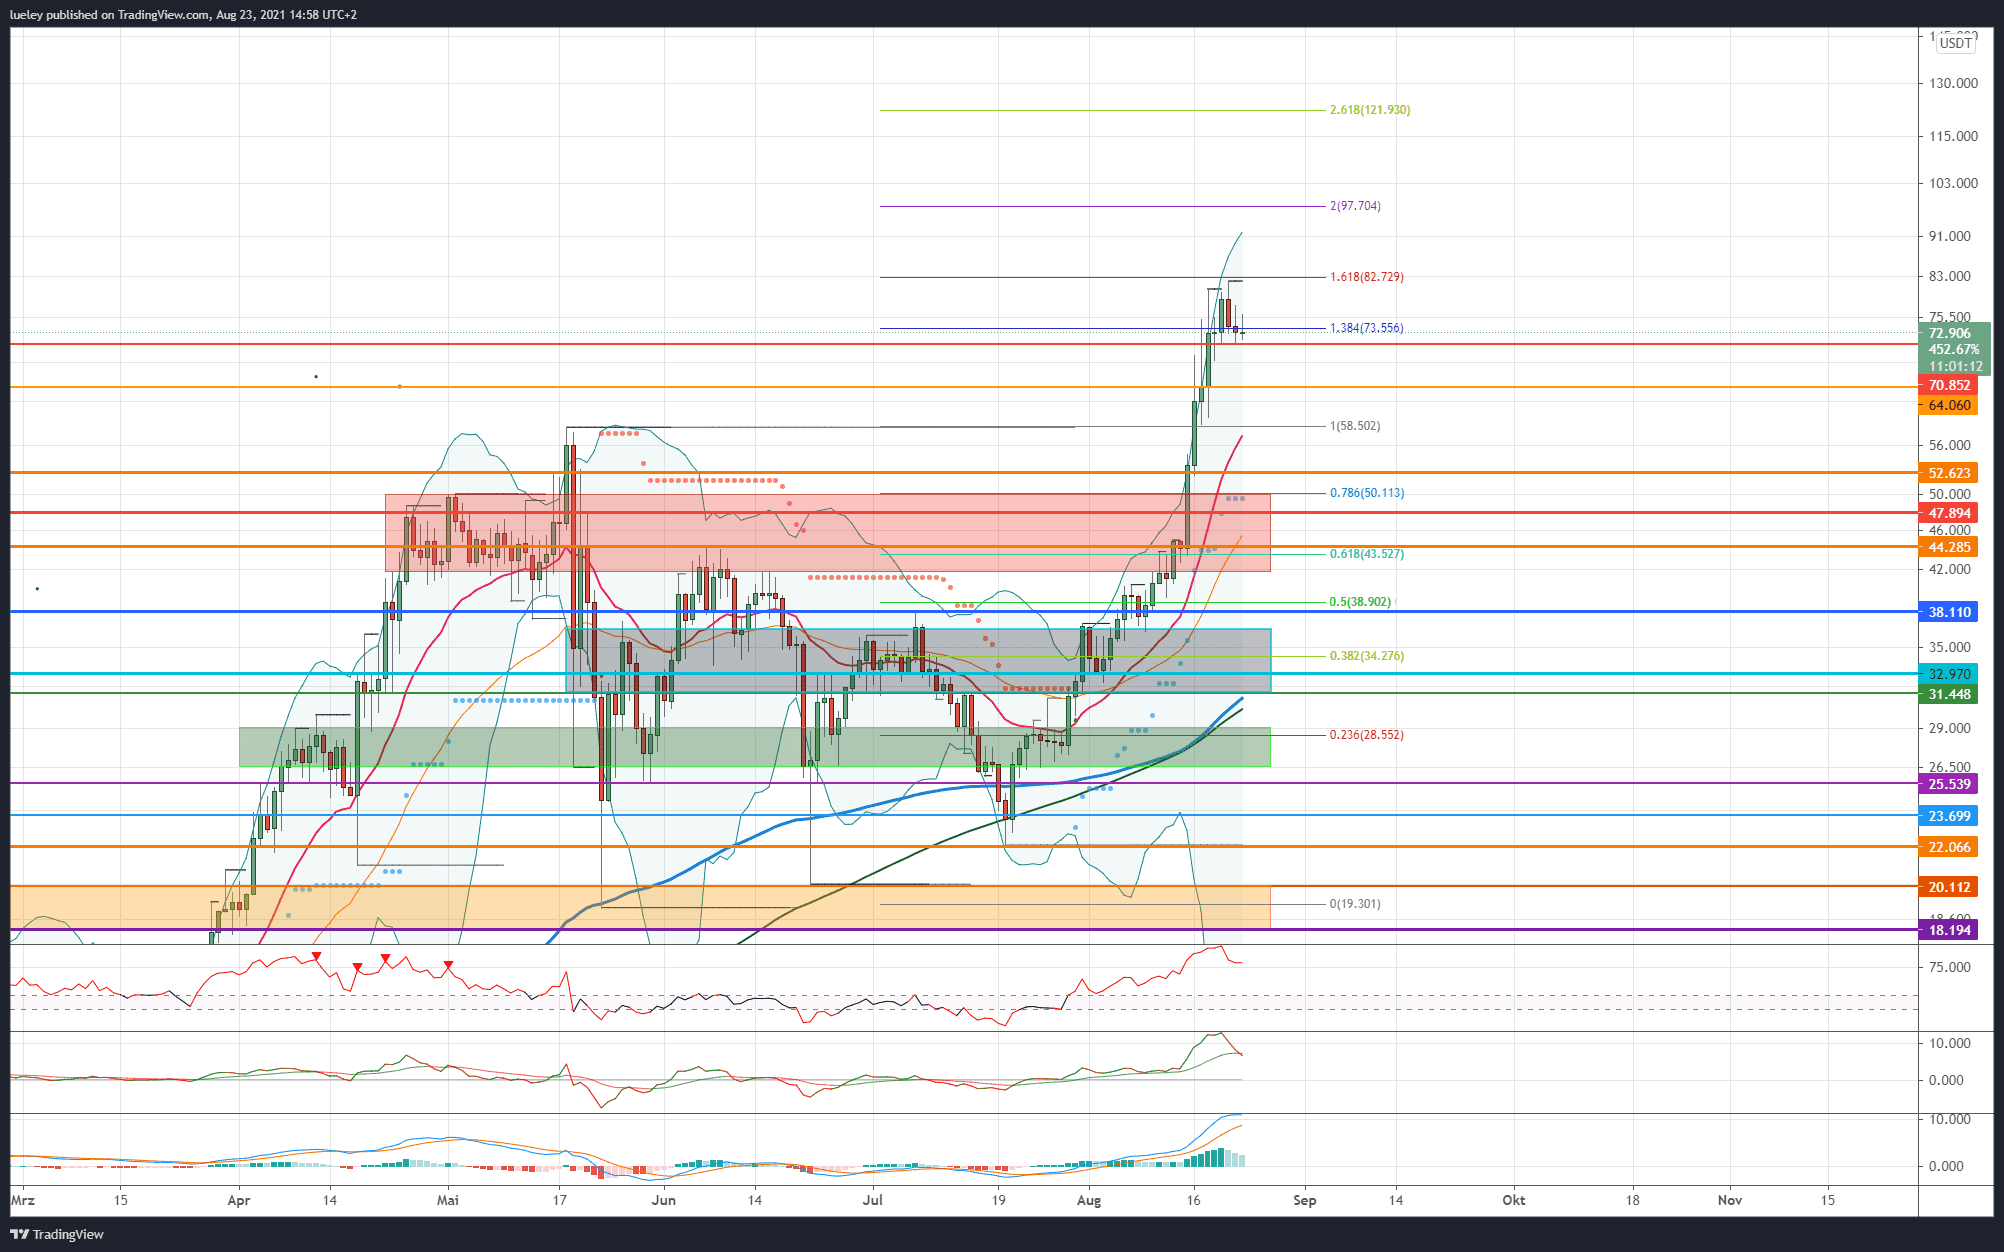
The course from Solana still only knows one direction, and that points north. Solana was able to build a new all-time high this week and reached the top of the area around the important price target in the form of the 161 Fibonacci extension. Although there is currently increased profit-taking and there are signs that the SOL course will cool down in the short term, higher prices can be expected in the future if you consider that the ecosystem around Solana is still being developed.
Bullish variant (Solana)
Although the price of Solana tends to be a bit weaker at the beginning of the week, with a 37 percent price premium in the last seven trading days, Solana is again the strongest top 10 Altcoin. In the short term, the SOL price could consolidate to the first support at USD 70.85, even a renewed test of USD 64.06 would be unproblematic from a bull’s point of view. A maximum correction to the old all-time high at USD 58.50 would be conceivable before Solana should initiate another rate upwards. If a breakout above the USD 82.73 succeeds as a result, the 200 Fibonacci extension at USD 97.70 moves into the focus of investors. The upper Bollinger Band, which ascends further north, additionally supports this scenario.
If the SOL price exceeds USD 97.70, the next price target is activated at USD 121.93. The 261 Fibonacci extension of the current trend movement runs here. If the bulls manage to overcome this resistance dynamically, a breakthrough to USD 161.13 cannot be ruled out in the coming months. This is where the 361 Fibonacci extension runs. If the overall market plays along and can continue to trend sustainably bullish until the end of the year, Solana could even target the 461 Fibonacci extension at USD 200. Investors should consider consolidating towards the EMA20 (red) to get into Solana.
Bearish variant (Solana)
The bears had little laughing about in the past two weeks of trading. Since breaking above the all-time high at USD 58.50, the SOL price has risen dynamically northwards and marked a new all-time high at USD 82.05. Solana is currently consolidating slightly south to USD 72.92. This brings the first support in the area of yesterday’s low of USD 70.85 back into focus. If the SOL course breaks this first support, a fallback to USD 64.06 should be planned. If this support is also abandoned, there is downside potential to the area of the old all-time high at USD 58.50. This price level is supported by the rising EMA20 (red) which also runs in this area.
If the bears manage to break this support level, the next target will be the strong support at USD 50.11. The upper edge of the red support area, the 78 Fibonacci retracement and the supertrend in the daily chart run along this multiple support. At this point, at the latest, a clear resistance from the bull camp can be expected. Should this support also be abandoned, there are further potential targets at USD 47.89 and USD 45.06.
There is strong horizontal support and the EMA50 (orange) at USD 45.06. In addition, this price mark represents the breakout level of the current breakout movement. Should this support also be undershot, Solana could fall back in the range between USD 43.52 (61er Fibonacci retracement) and USD 41.79. Only when this area is undercut dynamically will there be further correction potential up to the 50s Fibonacci retracement at USD 39.06. Again, increased resistance from the buyers’ camp can be expected here. If the SOL price continues to decline in the course of a corrective overall market, a fallback to USD 36.64 is conceivable. If Solana falls back into the gray support zone, another test of the 38 Fibonacci retracement at USD 34.25 is possible in the medium term. The maximum bearish price target is USD 31.44. In this area, in addition to the lower edge of the gray support area, there is also the EMA200 (blue) and just below the MA200 (green). From a technical chart point of view, no more correction potential can be derived.
Indicators (Solana):
The RSI continues to show a buy signal with a value of 78 in the daily chart, but is currently somewhat overbought. The same applies to the MACD indicator. This is also fairly high up, but so far this indicator is still far from a sell signal.
Worst price development among the top 10 altcoins:
Dogecoin (DOGE)
Price analysis based on the value pair DOGE / USD on Binance
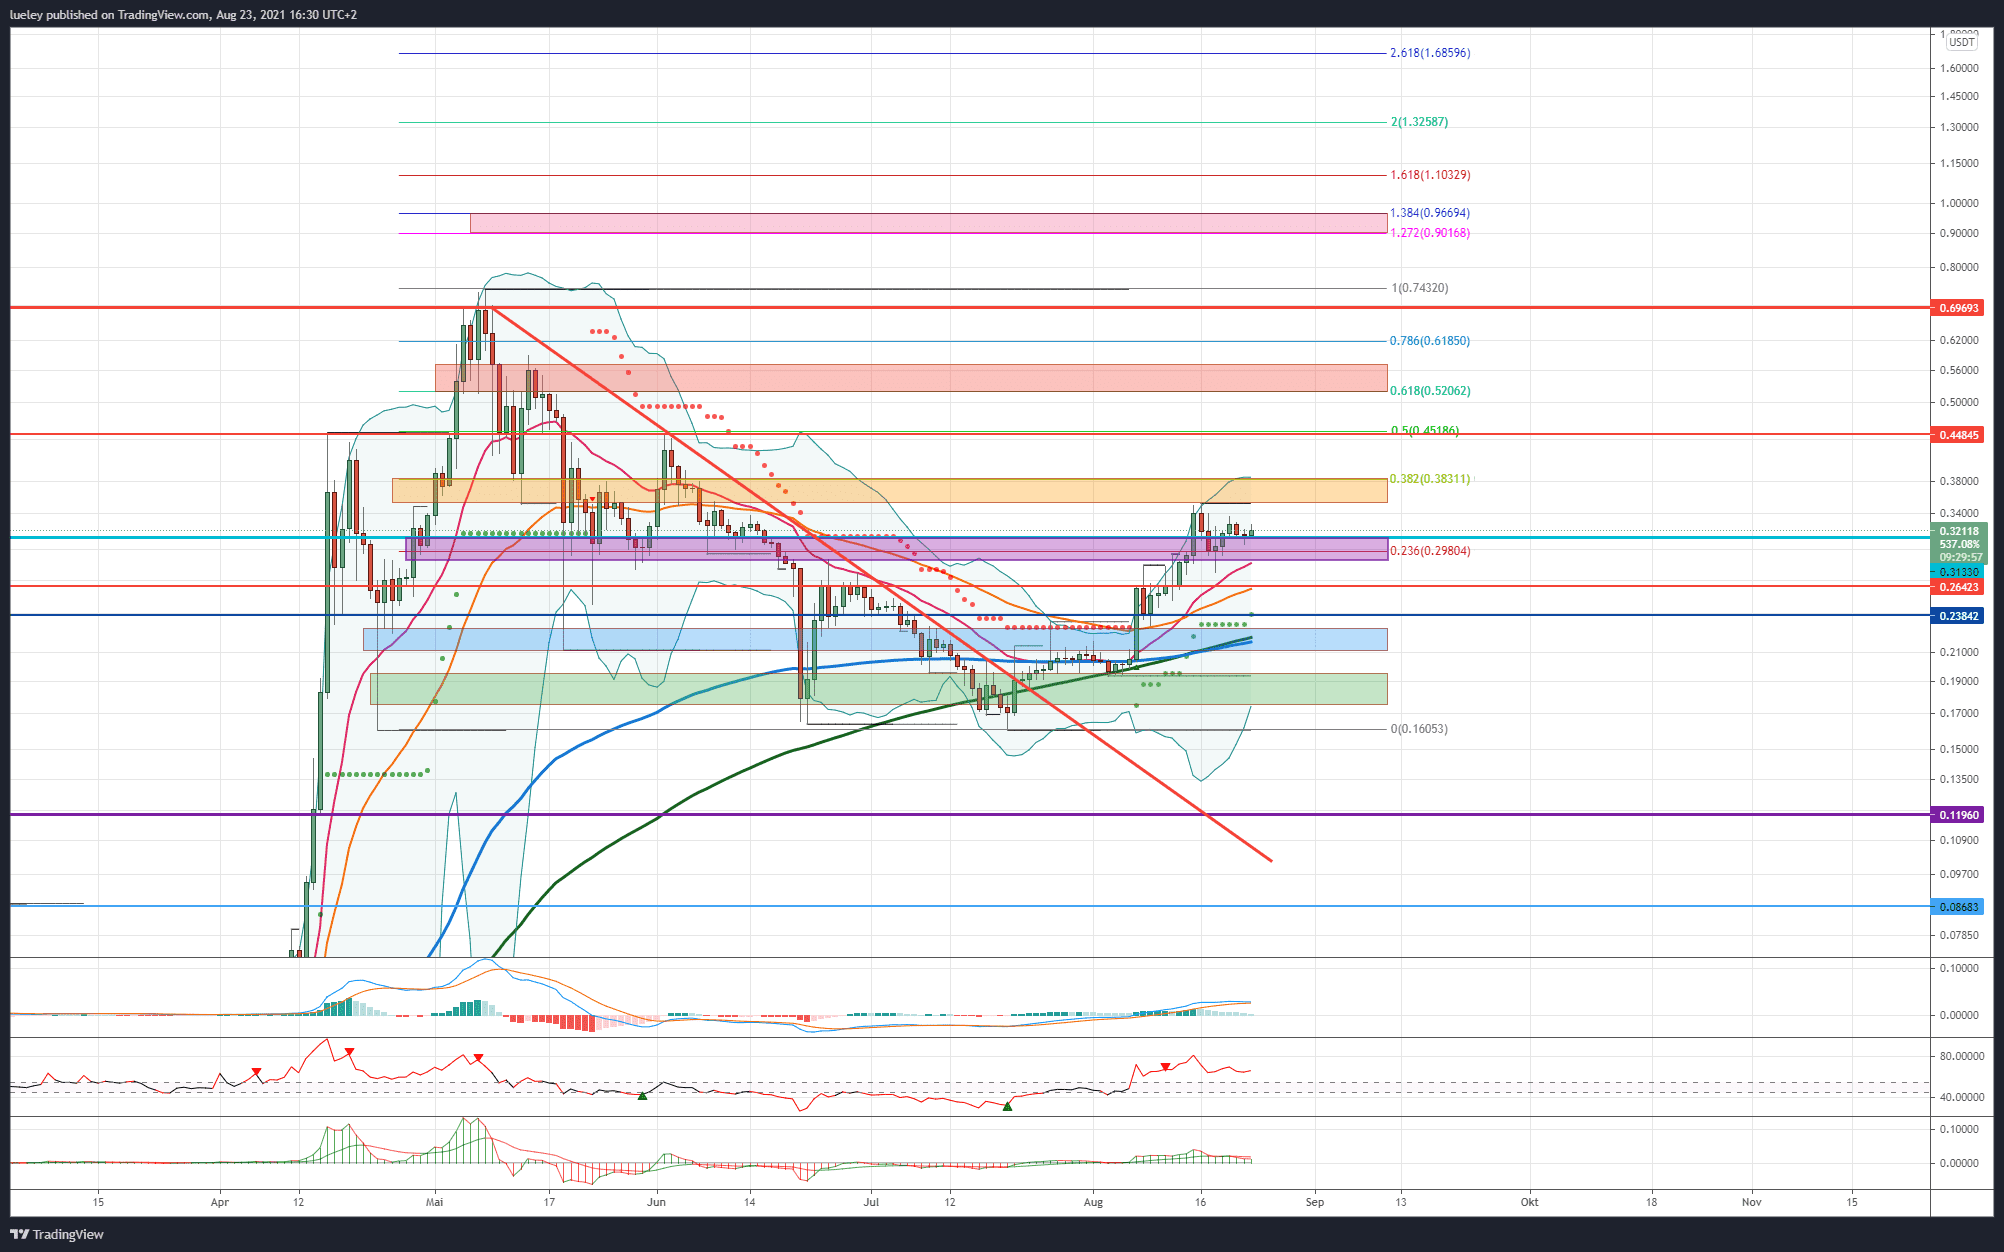
Dogecoin has increased significantly in value in the last few weeks of trading and has risen by almost 100 percentage points northwards since the break of the red downward trend line. Fired by news that the Doge Foundation is about to be re-established and that Ethereum founder Vitalik Buterin is on board, Dogecoin rose to the bottom of the orange resistance area at USD 0.35. In the last few days of trading, the price corrected back into the purple support zone, but has been able to defend it so far and is currently trading just above it at USD 0.32.
Bullish variant (Dogecoin)
The price of Dogecoin held its ground above the EMA20 (red) in the last few days of trading. As long as the DOGE rate is valued above the purple support area and does not slide back below the support at USD 0.264 (EMA50) (orange), another attempt to rise towards the previous week’s high at USD 0.352 can be expected. If this price level is overcome dynamically, the multiple resistance at USD 0.383 will be the first indicator to look at. Here you can find the upper edge of the orange resistance zone paired with the 38 Fibonacci retracement and the upper Bollinger band. Only when this resistance has been broken through sustainably will the next price target be activated in the form of the Fibonacci 50 retracement at USD 0.45. In addition, there is also a strong horizontal resistance here.
If this resistance is also overcome by the daily closing price, a subsequent increase in the red resistance area must be planned. In particular, the USD 0.520 should be paid attention to here, as this is the 61st Fibonacci retracement of the current movement. If the bulls manage to break through USD 0.571 and subsequently overcome the Fibonacci 78 retracement at USD 0.618, an increase to the horizontal resistance at USD 0.697 is conceivable. A renewed test of the all-time high at USD 0.743 cannot be ruled out. If the all-time high can also be broken in the medium term, Dogecoin could gain further strength and target the pink target area between USD 0.90 and USD 0.96. If there is a breakthrough above this, the 161 Fibonacci extension at USD 1.10 will come into focus as an important target. The maximum price targets for 2021 are 1.32 USD and in particular the 261 Fibonacci extension at 1.68 USD. From the current point of view, higher goals are not to be expected.
Bearish variant (Dogecoin)
However, if the DOGE rate cannot stabilize above USD 0.313 and falls back below the 23rd Fibonacci retracement at USD 0.298, a fallback to the EMA20 (red) at USD 0.288 should be planned. If this support is also abandoned at the daily closing rate, the correction extends to the cross support from EMA50 (orange) and horizontal support at USD 0.264. Here the cops will want to attack again. If, on the other hand, the bears manage to break through this support level dynamically, the supertrend at USD 0.238 will come into focus.
An immediate breakthrough in this support is currently not expected. If, contrary to expectations, the price level falls below this level, investors will again focus on the blue support zone. The current course rally started here. In addition, the EMA200 (blue) and the MA200 (green) are two very strong sliding supports at USD 0.218. For now, a relapse below USD 0.211 is not expected. Only when the overall market corrects more clearly, Dogecoin could target its maximum bearish price targets of 0.195 USD or even 0.175 USD. The $ 0.175 corresponds to the lower Bollinger band. Investors should also use setbacks up to a maximum of USD 0.238 for Dogecoin to make new purchases.
Indicators (Dogecoin):
The RSI continues to trade bullish with a value of 66 and has a buy signal pending. Although the MACD indicator is currently showing a slight buy signal, a renewed price weakness could quickly turn this signal into a sell signal.
Top 10 stability
The rate of the crypto key currency Bitcoin (BTC) was also friendly in the past week and traded a good six percentage points higher at the beginning of the week. The majority of the top 10 altcoins also benefit from this bullish tendency. The newcomer among the top 10, Solana (SOL) with 37 percent price explosion and Cardano (ADA) with 31 percent price increase, two top coins rise significantly more than Bitcoin itself Binance Coin (BNB) is growing significantly and has a price increase of 16 percentage points.
The list of underperformers is headed by Dogecoin (DOGE) with a price discount of five percentage points, followed by Uniswap (UNI), Bitcoin Cash (BCH) and Ripple (XRP) with a good three percent price decline each. The uneven development among the top 10 Altcoins has resulted in several changes in the ranking. Cardano overtook BNB in third place. Solana also continues to make up ground and jumps to eighth place. This pushes the high-speed blockchain Uniswap and Bitcoin Cash into ninth and tenth place. Once again it shows how closely the different top 10 Altcoins fight for their placements.
Winner and Loser of the Week
The temporary comeback of Bitcoin back above 50,000 USD is also ensuring that prices continue to rise on the overall market. More than 60 percent of the top 100 altcoins have jumped in price. Avalanche (AVAX) recorded the most significant price increase with a price increase of 163 percent, followed by Arweave (AR) with an increase in value of 85 percent. Audius (AUDIO) and Near (NEAR) can also convince with 82 percent and 71 percent increases in value. The list of underperformers is led by Ethereum Classic (ETC) with a nine percent decline in price. It is followed by BitTorrent (BTT) with an eight percent discount. Dogecoin (DOGE) is also taking a breather after the significant increase in the previous week and falling by almost six percent compared to the week. Despite slight profit-taking on some of the top 100 altcoins, the current situation on the market as a whole is increasingly bullish. Confidence among investors that an autumn rally will push the market towards its all-time highs appears to be solidifying this trading week as well.
Disclaimer: The price estimates presented on this page do not constitute buy or sell recommendations. They are only an assessment of the analyst.
The chart images were created using TradingView created.
USD / EUR exchange rate at the time of going to press: 0.84 euros.