
Is Bitcoin back in bullrun? – This is the question everyone is asking: is Bitcoin finally in bullrun condition? With the price of Bitcoin up almost 80% since the start of the year, is the bear market finally over? From a technical standpoint, the price remains stuck below the polarity zone between $30,000 and $32,000. This zone had allowed the price to rebound during the last bullrun, and it will absolutely be necessary to resume this level as support. Certain information coming from the on-chain analysis is extremely relevant to know if the market is on the verge of experiencing a new upward phase. Let’s look at the on-chain situation on Bitcoin.
The price of Bitcoin rises, the whales remain discreet
By following the different movements present at the network level, on-chain analysis makes it possible toidentify operators called “whales“. In concrete terms, entities with more than 1,000 BTC in wallet are whales. The monitoring of these portfolios makes it possible to make assumptions about the configuration of the market. Here is the graph of theevolution of addresses with more than 1,000 BTC :
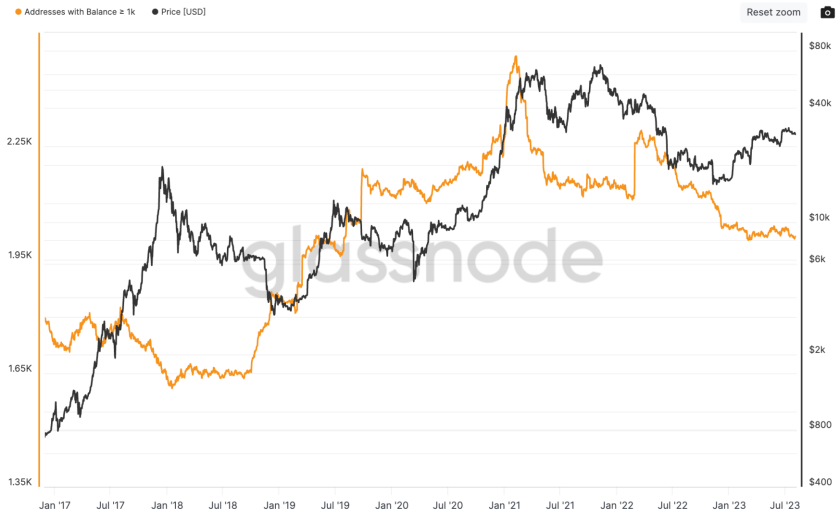
Usually the whales accumulate BTC before the bull market as was the case at the end of 2018. Indeed, the number ofaddresses with more than 1,000 BTC has increased (accumulation) from 2019 until the beginning of 2021. In February 2021, operators started to distribute and the price struggled to keep climbing. Since the beginning of the year, the price of Bitcoin has been increasing, but the whales remain very discreet. We note a change in behavior since the beginning of the year, but we are still far from known accumulation from 2019 to 2021.
>> 10% reduction on your trading fees? Sign up on Binance (commercial link) <<
Ongoing accumulation on Bitcoin
As we have seen the whales are not in the game at the moment. However, what is the behavior of market operators in general ? The liveliness indicator corresponds to the BTC liveliness. When the curve is up, rejuvenation takes precedence over maturation. The operators are then in the process of distribute. On the other hand, when the price falls, the situation is reversed. In fact, we can see that operators are currently accumulating BTC:
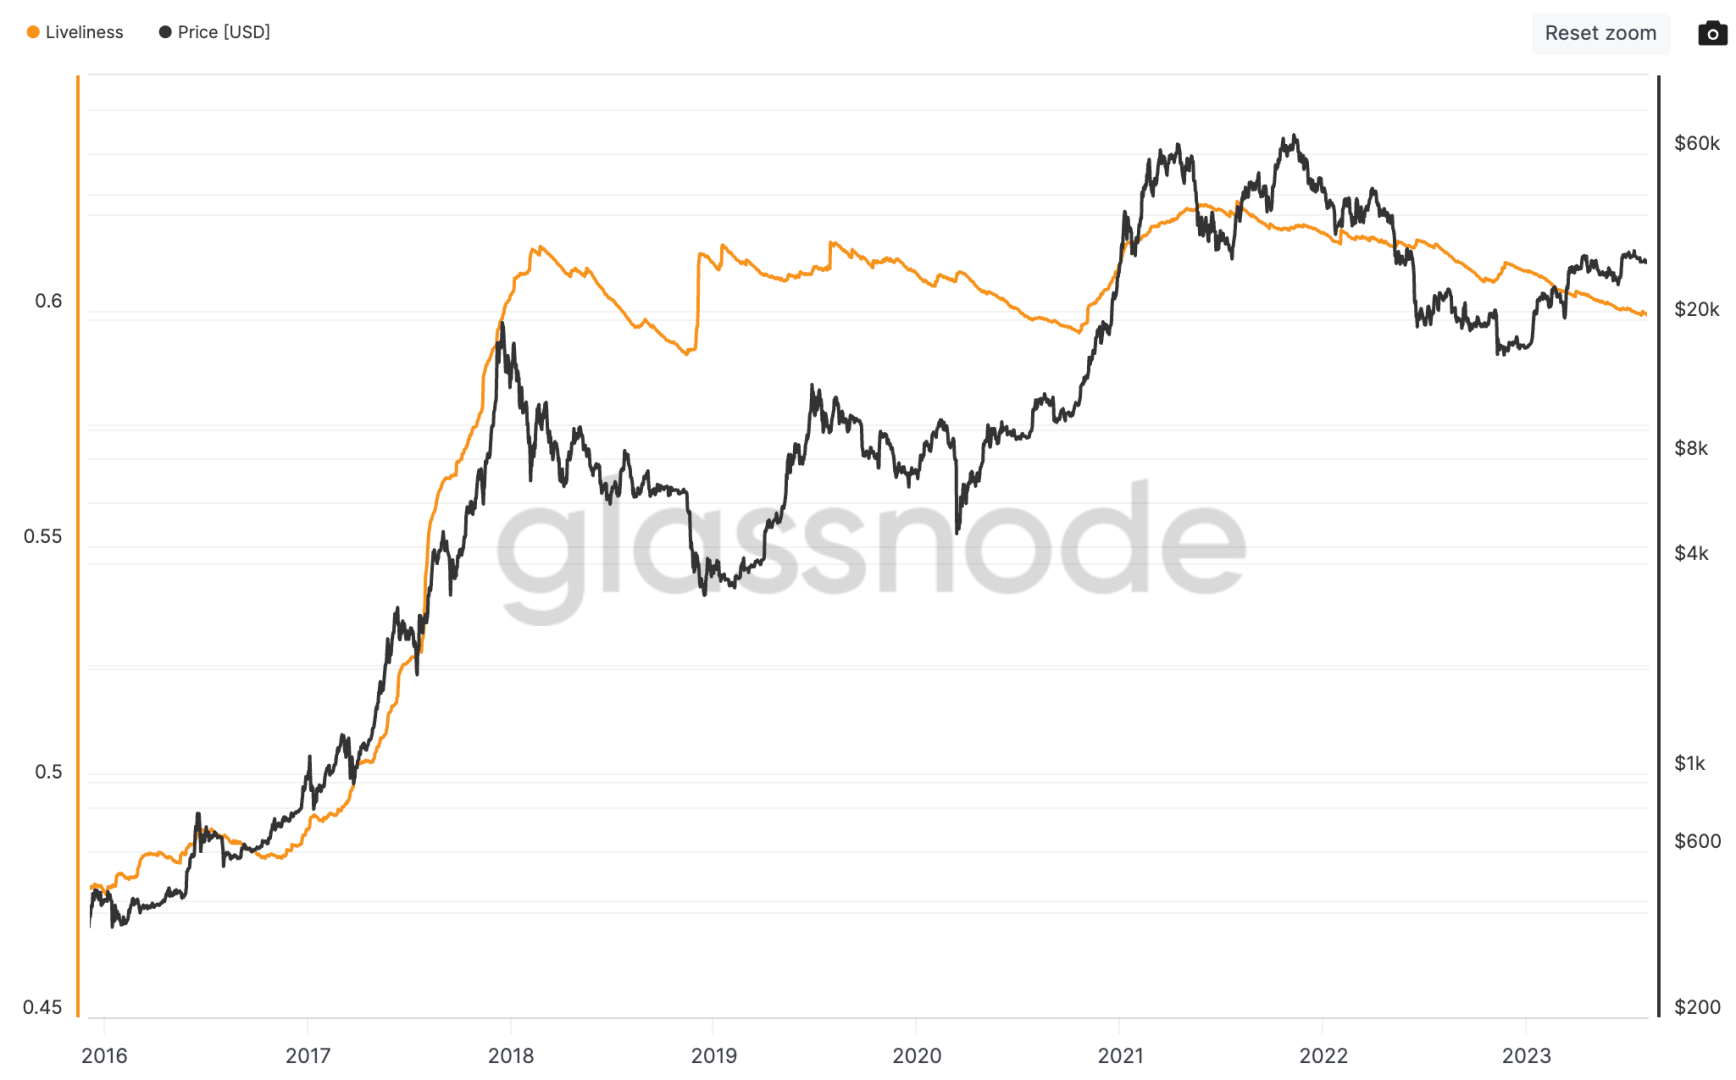
During a bear market, the operators tend to accumulate BTC as was the case in 2018. On the other hand, as soon as the price explodes upwards, the trend changes. Operators then adopt a distribution behavior (profit taking). Currently, operators are still in accumulation phase. The move from $15,000 to $30,000 on the price of BTC did not lead to a change in behavior.
To complete the analysis of BTC liveliness, we can take a look at the CDD. This allows to understand if traders are taking profits :
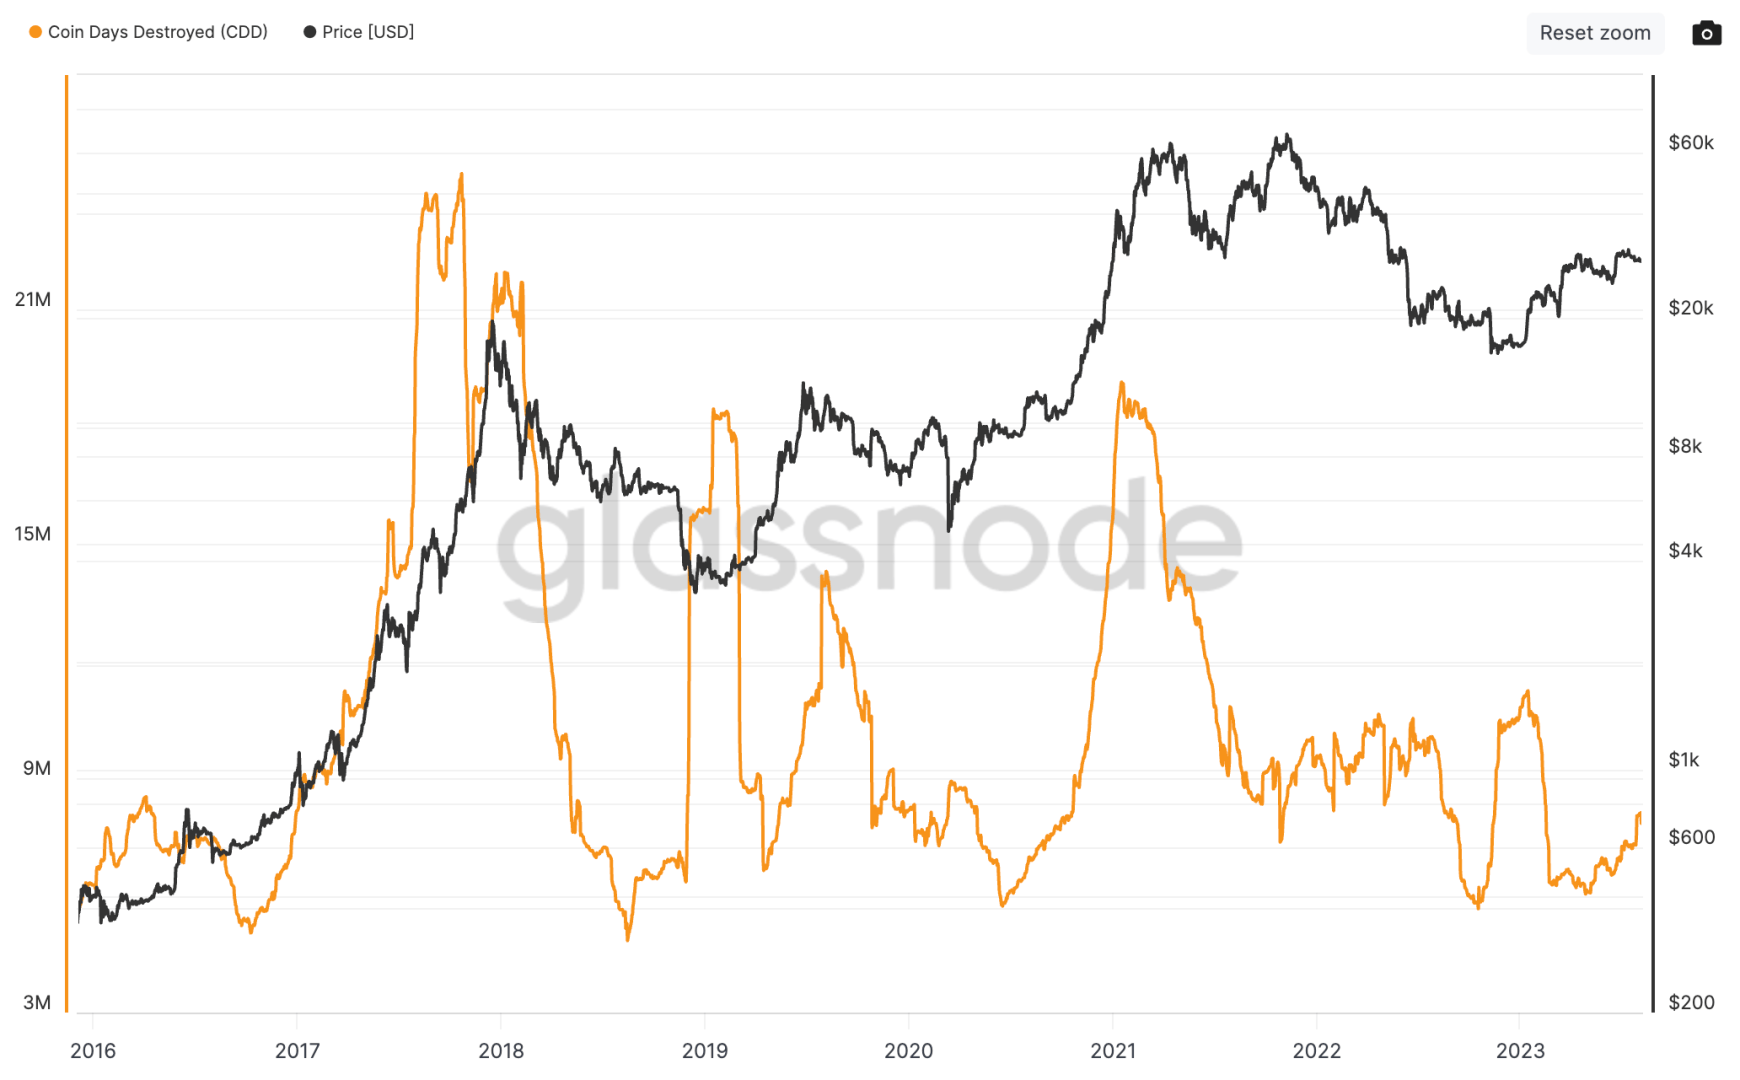
When the CDD is highthis shows that the operators are in the process of take profit. This behavior was particularly noticed in January-February 2021. Despite the increase known since the beginning of the year, the operators are not distributing significantly. These data are consistent with those from the liveness graph above.
Hold the $29,000 on Bitcoin to avoid a return to $20,000
In this part, we will focus on operators who do not keep their bitcoins (STH) for longand to those who keep long (LTH). STHs tend to react strongly to their emotionsit is for this reason that the returns at the level of the realized price of the STH allow a bounce (uptrend) or a rejection (downtrend). For now, the price moves above the realized price of LTH and STH :
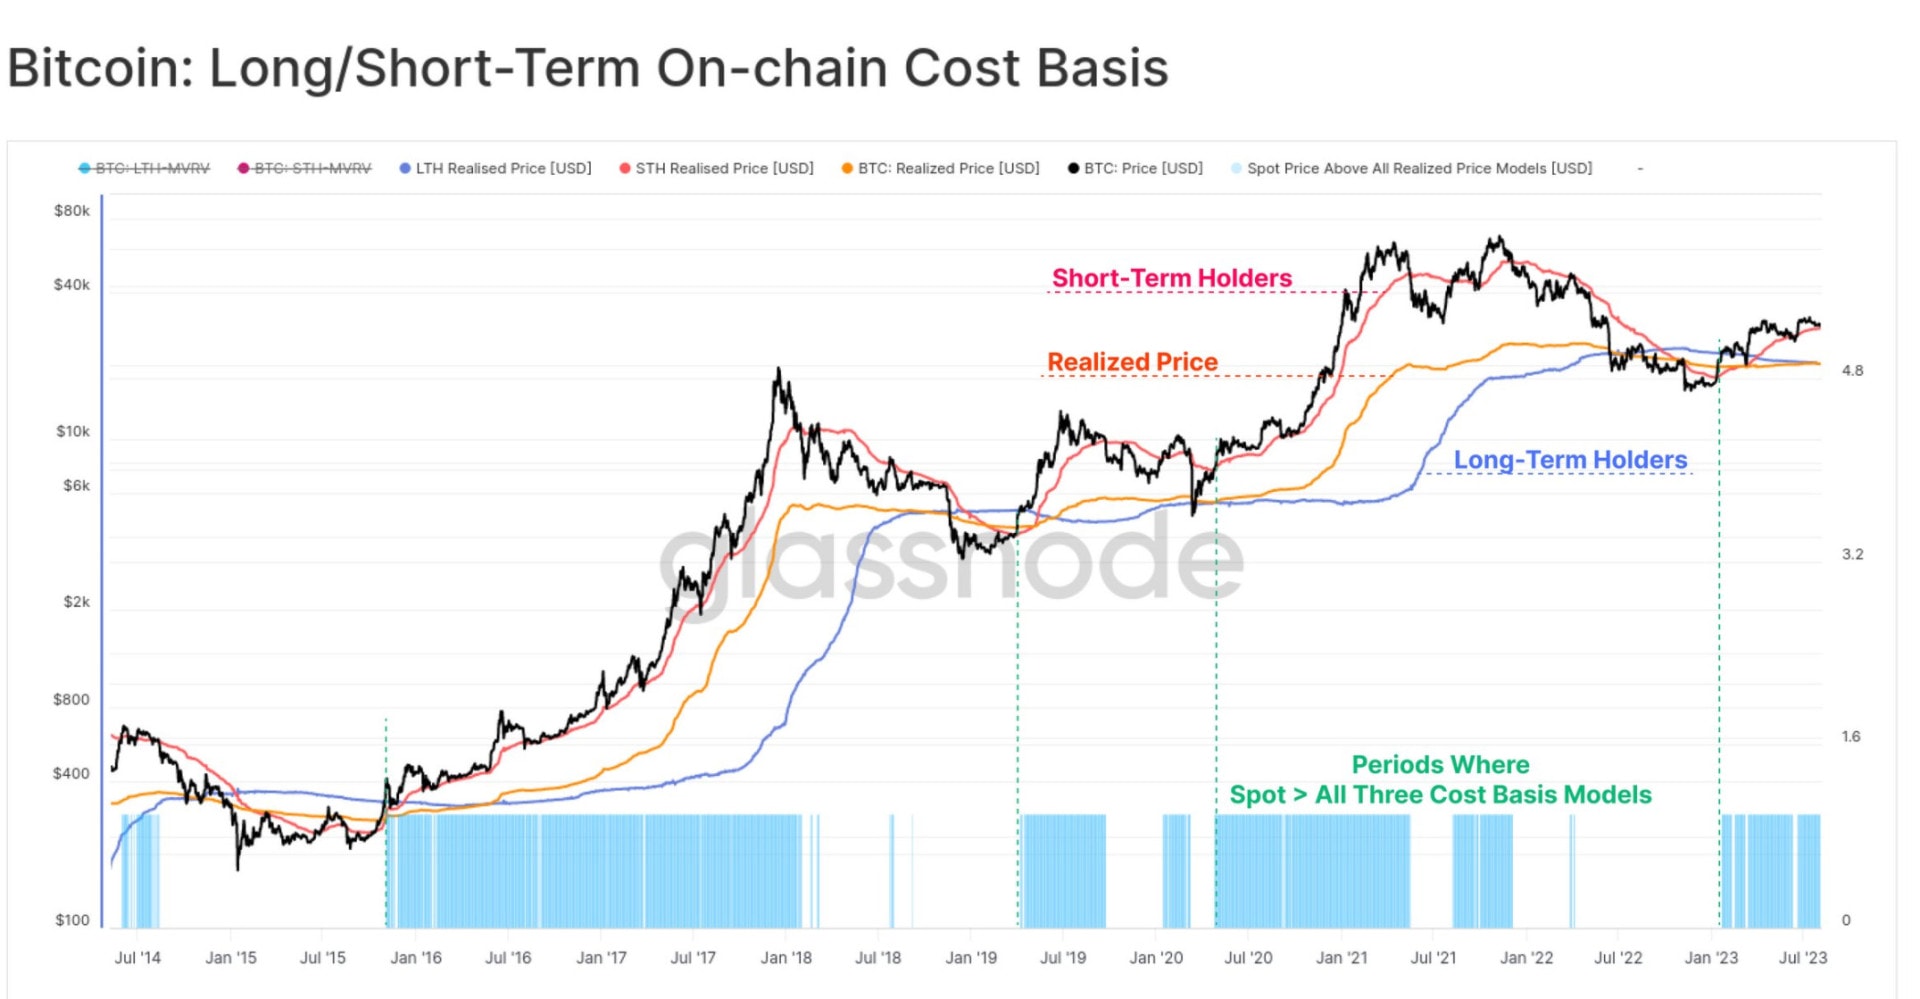
As long as the price is moving above the realized STH price, there is not too much to worry about. In this situation, the trend is considered bullish. Returns to the realized price level often lead to rebounds at the course level. On the other hand, if the course falls below the realized price of STHshort-term holders tend to panic and quickly sell. This can lead to downside volatility at the course level. In this case, the price tends to join the realized price of LTH. This was notably the case in March 2020, or in 2022. The price could then fall towards $20,000.
However, it is not automatic. In May 2021, the price fell below the realized price of STH without reaching the realized price of LTH. It is nevertheless a non-negligible risk.
Huge resistance lies in BTC’s path around $30,000
The graph presented by the Whalemap site makes it possible to display the volume accumulated by traders based on Bitcoin price. A hard zone is around $30,000 for the Bitcoin price:
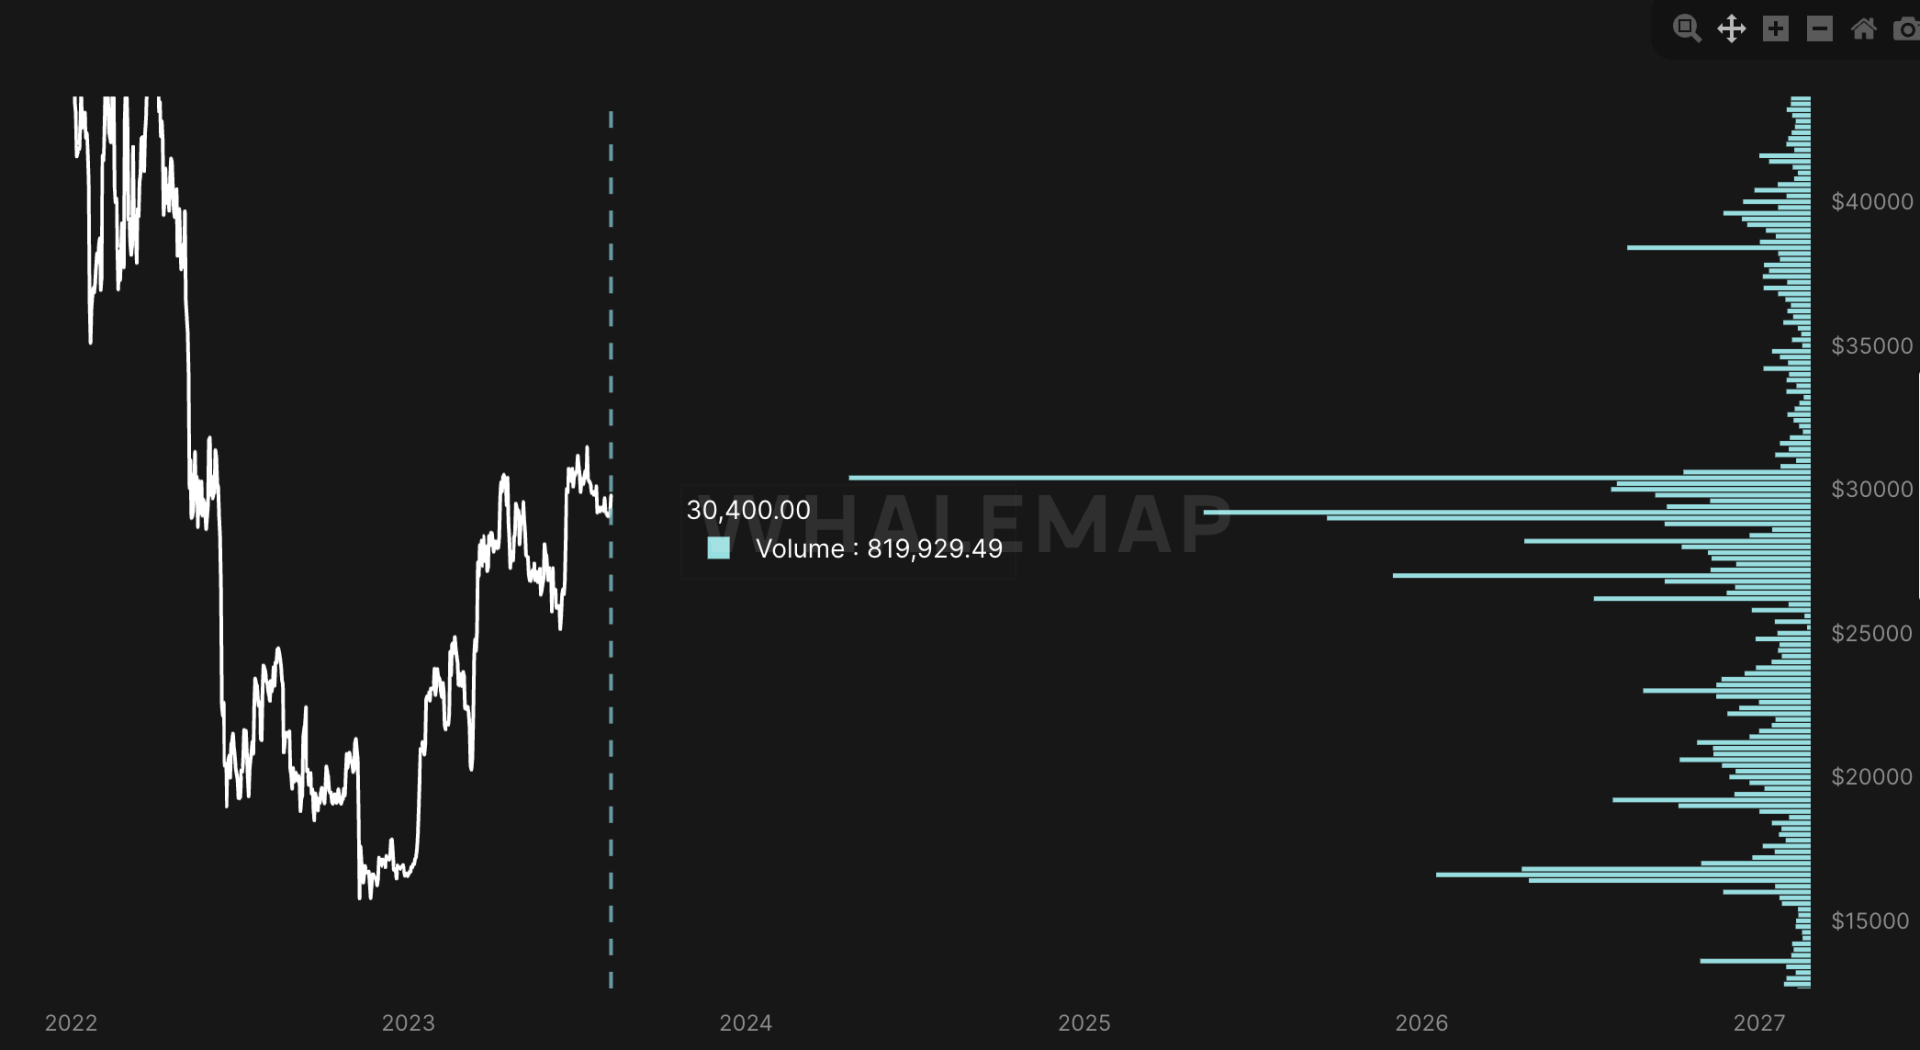
In fact, there are more 800,000 BTC which was accumulated around $30,400. This makes the area to $30,000 an important resistance for the class. Also, we can see that the $29,000 area is a great support area. In total, almostone million BTC accumulated at that level. Once again, we can see that the $29,000 level is key for subsequent events. If the price fails to break the level at $30,000and that the level of support at $29,000 gives waythe price could return to the level of the next strong support located at $27,000. Indeed, operators have accumulated more than 350,000 BTC at this level.
Thanks to the on-chain data we can see that the whales are not yet in the accumulation phase on the course of Bitcoin. When the price explodes higher, the whales are usually in the train. For the moment, the whales are abandoning the king of cryptocurrencies. On the other hand, we notice an accumulation on the part of the operators thanks to the liveliness indicator. While the course is up about 80% since the start of the year, traders continue to accumulate.
At the same time, it is interesting to note that the price must retake the area at $30,000 as support. For the moment, this level is resistance. Also, the level at $29,000 is an important support level to hold to avoid sliding towards the support at $27,000. Keep in mind that it is entirely possible to experience a return to $20,000. The risk would be present if the price were to fall below the realized price of the short-term holders. Therefore, it is still far too early to talk about the start of the bull market. However, it looks like the worst is over, and traders are hoarding again. BTC will have to break the polarity zone present around $30,000.
For you, blockchain technology and cryptocurrencies will soon be at the heart of the daily life of each of us. You can get exposure to Bitcoin, Ethereum and other tokens on the leading exchange. Register quickly on the Binance platformand save 10% on your trading fees by following this link (trading link).