Bitcoin (BTC) was able to stabilize in the last seven trading days and is currently trying to rise again towards USD 60,000. Investors seem to be taking advantage of the directionless situation with Bitcoin for increased entry into Altcoins. The dominance of the crypto reserve currency therefore has to give way and falls significantly back towards 45 percent.
Bitcoin (BTC): Bitcoin price back in no man’s land
BTC course: 55,393 USD (previous week: 55,216 USD)
Resistance / goals: $ 55,817, $ 56,867, $ 58,386, $ 59,527, $ 61,122, $ 61,771, $ 64,896, $ 67,416, $ 69,744, $ 70,000, $ 70,856, $ 76,472, $ 77,678, $ 80,323, $ 86,295, $ 89,982, $ 100,258 , $ 113,074
Supports: $ 53,005, $ 51,307 / $ 50,305, $ 49,423, $ 48,222, $ 47,070, $ 44,878, $ 43,030, $ 41,967, $ 40,240, $ 38,743

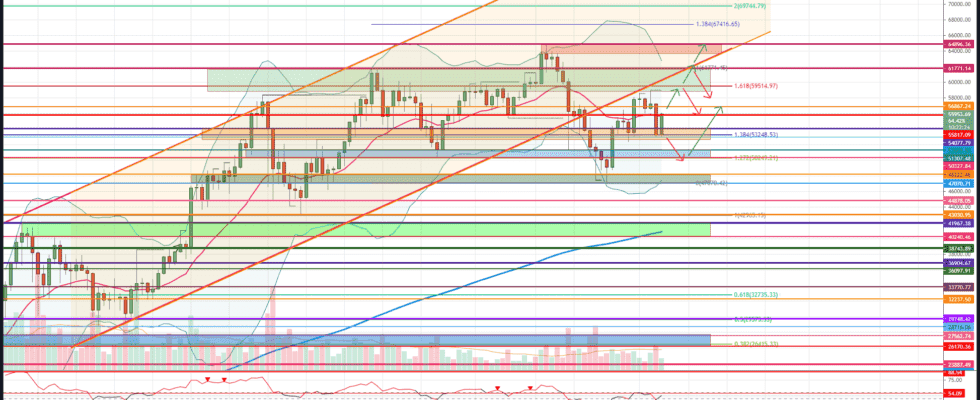
Price analysis based on the value pair BTC / USD on Coinbase
The crypto reserve currency Bitcoin worked its way back to the lower edge of the green resistance area in the last seven trading days. Here again profit-taking set in, which caused the BTC rate to correct yesterday, Tuesday, May 4th, to support at 53,005. At the time of this analysis, Bitcoin was able to recover from its previous day’s lows and is trading almost unchanged on a weekly basis.
Bullish scenario (Bitcoin price)
If the bulls manage to dynamically overcome the important resistance at USD 55,817 and thus also recapture the EMA20 (red), the horizontal resistance at USD 56,867 will come into focus again. If this chart level is broken as well, a rise up to USD 59,514 is likely. At this resistance level, the bulls have to prove whether they have the strength to push Bitcoin again towards the old history high at USD 61,771. Only when this resist is broken through sustainably and BTC can fight its way back into the uptrend channel does the chance of a breakthrough to the all-time high at USD 64,896 increase. If the red resistance zone is maintained as a result and Bitcoin can continue its upward movement, a rise to the 138 Fibonacci extension at USD 67,416 should be anticipated. If the trend movement continues, a directional decision will be made between USD 69,744 and USD 70,856.
The way towards USD 100,000
If the 161 Fibonacci extension of the current price movement and the 200 Fibonacci extension of the higher-level trading movement are overcome and Bitcoin stabilizes above these target projections, the 200 Fibonacci extension of the current upward movement at USD 76,472 will move into the focus of investors. The next relevant price target at USD 77,678 is just above this resistance. This resistance level arises from the monthly chart and is therefore of great importance. The first profit-taking should come as no surprise. After a breather, Bitcoin will hit the USD 80,323 mark. If investors’ interest in Bitcoin remains at a high level, a follow-up increase to the 261 Fibonacci extension of the higher-level price movement must be taken into account.
That course projection can be found at $ 86,295. A direct rise to the 461 Fibonacci extension, which is taken from the hourly chart, would then be conceivable. That resistance level runs at $ 89,982. Only when the bulls manage to let the Bitcoin price break out of the trend channel upwards is a price increase up to USD 100,258 realistic. Here is the 361 Fibonacci extension of the current price movement. A sustained stabilization beyond USD 100,000 will give the share price a further boost. The maximum price target for 2021 is between USD 113,074 and USD 114,959.
Bearish scenario (Bitcoin price)
The bears seem to have tasted blood. So far, the bears have prevented a renewed rise back into the uptrend channel. As long as the seller parries all attacks from the buyer, a relapse back to the orange support area between USD 54,077 and USD 52,713 can be expected at any time. If Bitcoin falls below USD 52,713 per day’s closing price, the downward movement will gain momentum again. The likelihood of a retest of the blue support area. It then continues to rise between $ 51,307 and $ 50,327. Should Bitcoin also give up this support zone on a sustained basis, a fallback towards USD 48,222 and USD 47,070 should be planned. If the bulls do not come back on the floor and ensure price stabilization, an expansion of the correction up to USD 44,878 is also conceivable.
A run-up to the February 28 low at USD 43,030 must also be taken into account. Should the BTC price break this strong support, price targets will activate at USD 41,967 and USD 40,240. The green support zone currently represents the maximum bearish price target. The EMA200 (blue) also provides support at USD 40,936, so a breakthrough in the first attempt is considered rather unlikely. Only with continued selling pressure could the BTC rate reach USD 36,743. From a technical chart point of view, however, there is so far no real reason for such a correction.
Social tokens – the next big thing?
Investment trend: social tokens
Find out more in the leading magazine for blockchain and digital currencies
(Print and digital)
☑ 1st edition free of charge
☑ Over 70 pages of crypto insights every month
☑ Never miss any more investment opportunities
☑ Free postage to your home
To the crypto compass magazine
Bitcoin dominance: market dominance reaches 50 percent

Bitcoin dominance based on values of Cryptocap shown
The battle for the psychological 50 percent mark seems decided. The dominance of the crypto key currency Bitcoin fell by around 5 percentage points in the last 5 trading days and tested the next important milestone at 45.71 percent on Wednesday morning. Although the BTC dominance is currently slightly above this key support at 46.20 percent, there has been no clear bullish counter-reaction so far.
BTC Dominance: Bullish Scenario
The BTC dominance has been under pressure since the 50 percent market dominance was abandoned. However, if the Bitcoin dominance manages to bottom out in the area of key support at 45.71 percent, the orange area could come into focus again. Here, however, the BTC dominance meets a strong resistance cluster consisting of horizontal resistance, lower channel edge and EMA20 (red). In the current situation, it will be difficult to recapture this area of resist. Should the BTC dominance manage to rise back into the downtrend channel, a retest of the resistance at 52.19 percent is initially possible. Here, the dominance of the crypto reserve currency is likely to run out of steam and subsequently fall back to 50 percent.
Should the BTC dominance unexpectedly break through this resistance upwards, a directional decision for the coming trading weeks will be made in the gray resistance zone. If the BTC dominance also manages to dynamically overcome this resistance in the area of 53.16 percent, the 54.23 percent comes back into focus as the relevant price target. The upper edge of the trend channel is currently also running here. Only when this cross-resistance is broken at the closing price of the day would a subsequent increase of up to 55.72 percent be planned. The maximum bitcoin dominance could then recover into the purple resistance area between 57.12 percentage points and 57.78 percent. In the short term, this resistance zone should be seen as a target for recovery. As long as Ethereum (ETH) and other large altcoins such as the Binance Coin (BNB) and, most recently, Dogecoin (DOGE) significantly outperform Bitcoin, a significant return to old strength is ruled out for the time being.
BTC Dominance: Bearish Scenario
Bitcoin’s market power has been clearly on the decline since the last analysis. The fact that the BTC dominance went straight to the first important price target shows that it is increasingly difficult for the crypto reserve currency to maintain its dominance in the current altcoin season. If the Bitcoin dominance cannot sustainably rise back to 50.01 percent in the coming days, it is only a matter of time until the 45.71 percent comes under pressure.
As a result, the ongoing downturn should gain further momentum and target the cross support at USD 43.26. If there is no bullish countermovement at this cross-support from the downtrend line and the course low from 2018, a relapse below 40 percent is also conceivable. The BTC dominance will subsequently correct further and start the green support zone between 39.14 percent and 37.67 percent. A recovery movement can be expected at the latest at 37.67 percent. It remains to be seen whether and how quickly the Bitcoin dominance can recover towards 50 percent.
Disclaimer: The price estimates presented on this page do not constitute buy or sell recommendations. They are only an assessment of the analyst.
The chart images were created using TradingView created.
USD / EUR exchange rate at the time of going to press: 0.84 euros.