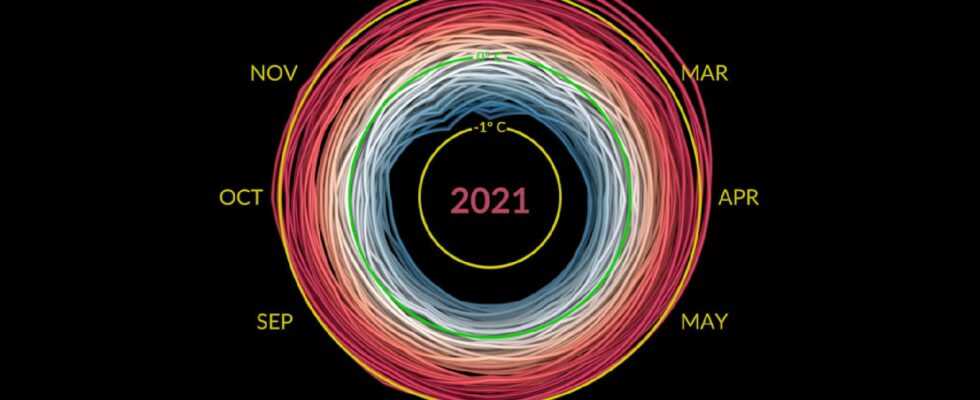
Sometimes a few pictures are better than data. This animation is very effective in showing the pace of climate change. A very fast pace, especially in recent decades.
Faced with climate change, caused by human activities, we must act now. Not in 2025, or in 2030, no: now. This is what the 6th report of the IPCC concluded just recently. The need for rapid action is connected to the rapid evolution of climate change itself, but also to a time lag: what we observe today is the result of yesterday’s emissions.
Global warming can be explained in figures or through very concrete examples such as rising sea levels. But sometimes a good visual animation works just as well to realize the magnitude of a phenomenon.
Using data from NASA, climatologist Ed Hawkins has produced a video animation that traces the evolution of global warming from 1880 (early industrial era) until 2021. It was released via the Scientific Visualization Studio , beginning of March 2022.
What the animation shows
The animation is so simple that it is very effective: we see, thanks to colored circles representing each passing year, how the temperatures increase little by little. Then, at the end, by changing perspective, we discover the magnitude of the increase summarized in a single image.
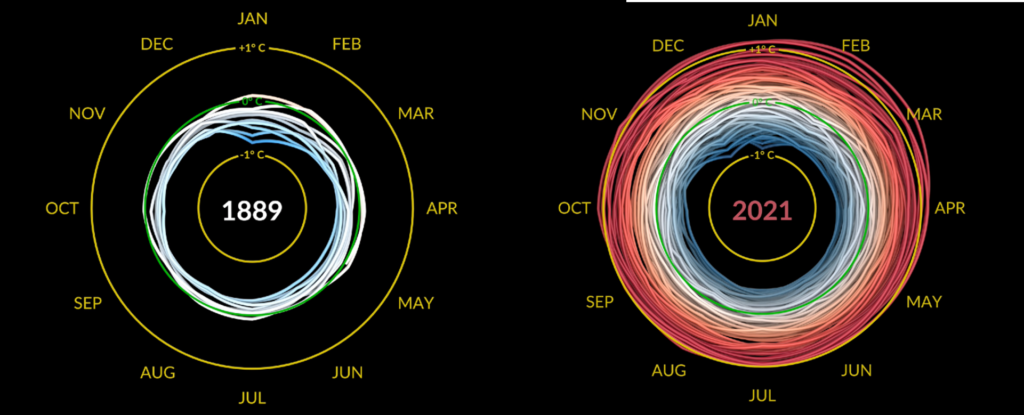
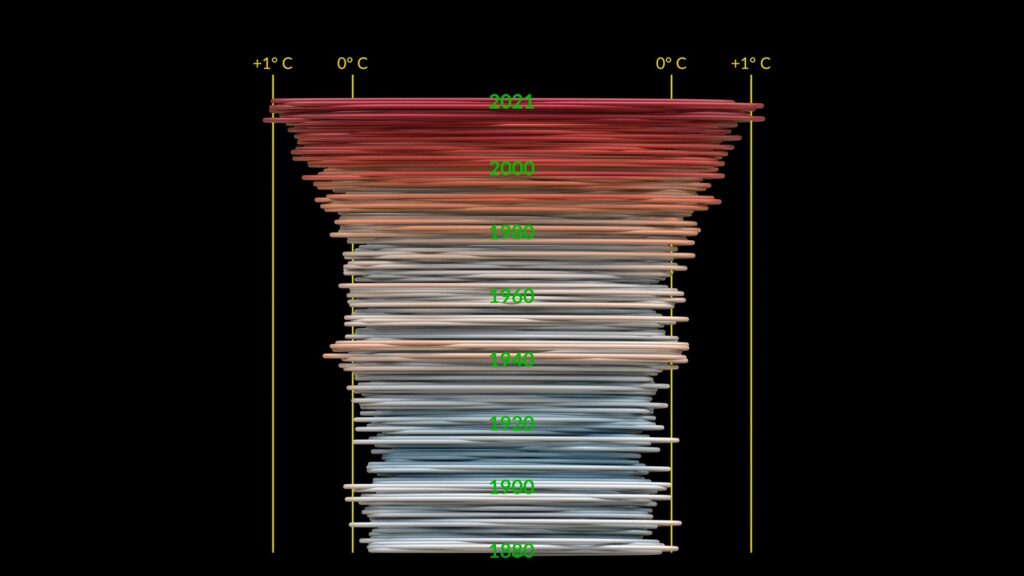
This last image shows how much the increase remains relatively limited for a century, before suddenly accelerating: it is only on the upper part of the model, around the year 1980, that the lines are larger. This shows how much the phenomenon is accelerating.

It is also on this speed that the scientists of the IPCC insist, showing, via scientific observations, that the pace of climate change has not been seen since, “ at least », 2,000 years. The rise in water levels is also occurring at rates not seen for 3,000 years. The level of CO2 concentration in the atmosphere is at its highest for 2 million years.